Where will markets move next?
 Back in February I wrote a piece for 80-20 members titled 'Stock markets at all-time highs, where next & should you buy?' In it I used technical analysis to try and predict where markets would head over the following months. It was well received by 80-20 Investor members as the predictions proved pretty accurate and profitable.
Remember that no one can predict the future. However, technical analysis can be used as a guide to the range of possible future outcomes in the coming months.
What is technical analysis?
Technical analysis is a method of predicting possible future stock market trends based on historical trends and patterns. The assumption in technical analysis is that historical performance of stocks and markets are an indication of future performance. At the simplest level you could argue that fear and greed drive a lot of investors’ actions. Let’s say that an opportunity presents itself and some investors jump on it and buy the shares in question. The demand then drives up the price. More investors jump on the bandwagon looking to profit. Then at some point the tide turns (fear sets in) as people think the price for the shares is looking expensive and so people start selling. More and more people start selling to take profits and the price falls. At some point the price falls until others think the shares look cheap and start buying, outnumbering the number of sellers. Again demand outstrips supply and the price goes back up.
This see-sawing explains the movement you see in stock market charts such as those below. The prices at which investors start bailing out and selling the shares is called a point of resistance while the point at which they pile in is called a point of support. As such there is a surprising level of predictability to human behaviour. In terms of the stock market that means when the price goes through historic points of resistance or support it can indicate an new unfolding market rally or collapse.
Why does it do this? Put simply investors are reacting to how other people in the market behave, when stock markets fall you feel tempted to sell, right? Also once it starts to rally, you are tempted to jump in? That’s why these patterns have a tendency to repeat.
So should I use technical analysis to drive my investment decisions?
Some investors and traders swear by it and trade solely using technical analysis. I don’t fall into that camp. I view technical analysis like a road map drawn by someone who has already completed a journey to somewhere near where you are planning to drive to. The road map won’t take you exactly to your intended destination, nor will it be entirely accurate. However, it will give you a better sense of what to expect. Then if you decide you like the look of a particular market you can use 80-20 Investor’s ‘Best funds by Sector‘ data to choose an actual fund to invest in. So where are 3 key stock markets now heading?
There are different types of technical analysis, however, I find the most useful guide is to simply highlight the points of resistance and support.
The US stock market
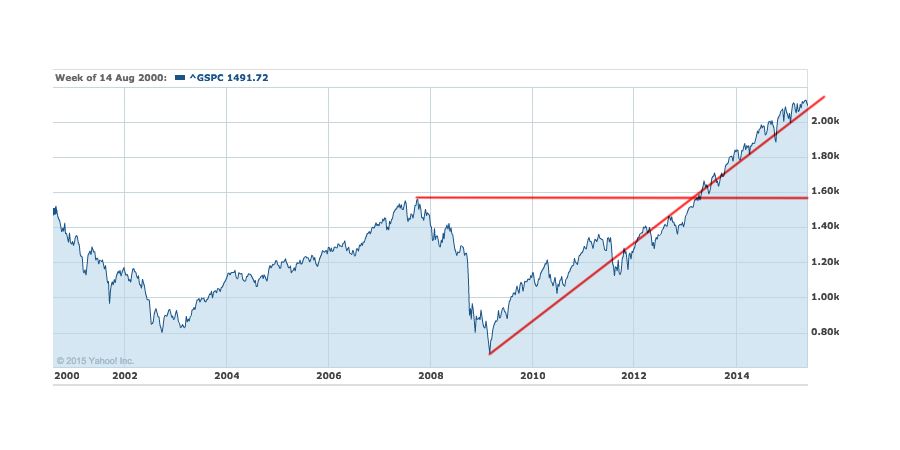
Below I have drawn the lines of support and resistance for the S&P 500. Since last time the S&P 500 has traded in a very narrow range, moving sideways, as a strong dollar started to hurt the stock market. Last time I said that if the rally is to continue then investors needed to start backing the belief that the US economic recovery has legs.
However since that time investor sentiment has turned neutral, from its previously bullish stance, and the market has limped along. Yet if you look at the chart below you can see that from a technical standpoint things remain positive and the market continues to bounce along the diagonal line of support. Yet this has become a 'reluctant rally' where it would appear that investors are buying into the stock market as the 'least bad option'. The problems will come when those already reluctant investors find that better option. The thing that has upset the market in the short term is the prospect of the US Federal Reserve (their central bank) possibly raising rates in September. This has caused markets to wobble and when rates do go up don't be surprised to see markets fall for a few weeks after.
FTSE 100 where next?
At the time of writing stock markets globally are in the midst of a sell-off sparked once again by wobbles in the bond market as well as concerns about a possible Greek exit from the eurozone.
Yet the technical analysis for the FTSE 100 is interesting. 80-20 Investor members can see the full analysis here.
There are clear levels of support which if breached will mean it's 'hang on to your hats time' as market sentiment in the short term will turn seriously negative, meaning that further losses are on the cards. If you would like to see the full analysis then you can try 80-20 Investor for FREE for 30 days.
The one market I'm excited about
Yet there is one other stock market that looks very exciting and is a great example of where technical analysis can spot opportunities to make money.
Back in February I pointed out there was the possibility of this market rallying 10% above where it stood at that time. Well that's exactly what happened.
It's no surprise that the 80-20 Investor Best of the Best Selection as well as my own portfolio have significant exposure to this market
80-20 Investor members can see the full analysis along with the technical analysis here. If you would like to see the full analysis and you aren't an 80-20 Investor member then you can try 80-20 Investor for FREE for 30 days.