

So as 2015 comes to a close I take a look back at the year's winners and losers before considering the investment outlook as we head into 2016. Why did most investors find it tough to make money in 2015? Where will the FTSE 100 end in 2015 and 2016? Where should you invest next year?
2015 - a year of volatility
This time last year we had just come off the back of two market wobbles caused by concerns over global growth. Broadly speaking, the market expected global growth concerns to continue to be the major theme in 2015. There was also much anticipation surrounding the launch of Quantitative Easing in the eurozone as well as more reforms in Japan. We started the year on the back foot with weaker than expected eurozone and Chinese economic growth data causing markets to wobble again. In fact the FTSE 100 started 2015 at 6,566, falling from a recent high around 6,800.
Yet the expectation for the year was overwhelmingly positive. Below are the predictions from a number of investment banks (the so called smart money) of where the FTSE 100 would end up at the end of 2015:
- Credit Suisse - 7,300
- Morgan Stanley - 7,200
- JP Morgan - 7,200
- Goldman Sachs - 7,100
- Brewin Dolphin - 7,000
- UBS - 6,700
Now at the time of writing they are all wide of the mark (the FTSE 100 is currently bouncing around 6,100). Of course investment banks make their money from investing their clients money. So their forecasts are always going to be tinged with more than a hint of optimism. If you paint too negative a picture your clients might just pull their money out of the markets altogether.
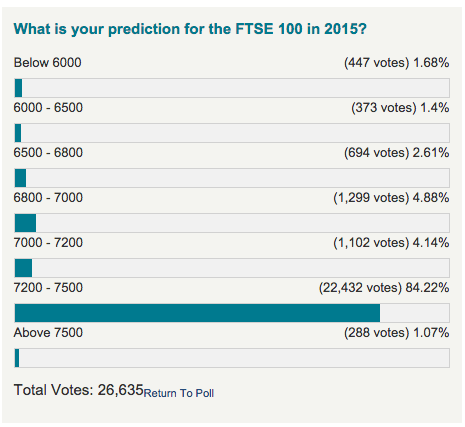
Yet the sense of optimism wasn't just confined to the City. A national newspaper carried out a poll on its website asking for reader predictions. The results appear to have never seen the light of day. But based on the predictions of over 23,000 people 97% of respondents were far too optimistic, unless we have the Santa rally of all Santa rallies of course.
The full results are shown below:
In fairness the FTSE 100 did rally strongly in the first quarter of 2015 hitting an all time high of 7,103 on 27th April, as shown in the chart below (click to enlarge):
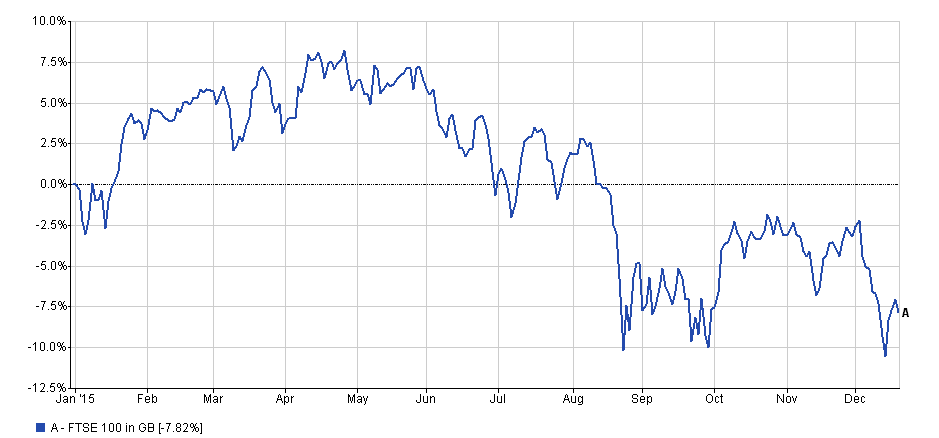
However a series of crises over the following months weighed on stock markets globally. These included the Chinese stock market crash, the Greek debt crisis, Chinese growth concerns, worries over a potential currency war and the commodities slump.
Yet the above chart only focuses on the price of the FTSE 100. Although 2015 was a difficult year to make money, those who invested globally stood a better chance. Below I list the top 10 investment sectors (the winners) as well as the 10 worst performing sectors (the losers) for 2015
2015 Winners
| Sector | Year to date return % |
| European Smaller Companies | 16.24 |
| Japanese Smaller Companies | 14.45 |
| Japan | 13.73 |
| UK Smaller Companies | 12.84 |
| Europe Excluding UK | 6.87 |
| Technology & Telecoms | 5.76 |
| Property | 4.53 |
| UK Equity Income | 2.87 |
| North America | 2.8 |
| Targeted Absolute Return | 2.39 |
2015 Losers
| Sector | Year to date return % |
| China/Greater China | 0.07 |
| Cash | 0.03 |
| Mixed Investment 0%-35% Shares | -0.18 |
| Sterling Strategic Bond | -0.19 |
| North American Smaller Companies | -0.37 |
| Sterling High Yield | -0.59 |
| Global Bonds | -1.54 |
| Global Emerging Market Bond | -4.32 |
| Asia Pacific Excluding Japan | -5.89 |
| Global Emerging Markets | -11.27 |
One sector that I didn't include in the above analysis (due to it's adhoc nature) was the Specialist Sector. This mish-mash of a sector most notably contains the commodity focused funds. Perhaps unsurprisingly this sector was therefore down -6.16%.
Those investors who made money in 2015 would have avoided emerging markets (which got hammered by a strong dollar and the commodity rout) and Asian equities (except Japan). Instead they would have favoured Japanese and European equities as well as smaller companies (with these benefiting from being largely sheltered from the Chinese economic slowdown, unlike their large cap peers). Successful investors would also have protected themselves from the downside by using property and defensive shares (represented in the table by UK equity funds) as opposed to corporate bonds. The trouble is that hindsight is wonderful but on the 1st January 2015 how were investors to know which sectors would perform well? The answer was that you didn't need to...
80-20 Investor outperforms
As you know each month the 80-20 Investor algorithm picks a shortlist of funds across low, medium and high risk areas. 80-20 Investor members will choose from this menu and construct their own portfolios. However, to give a sense of how the 80-20 Investor algorithm performs I track the returns that would have been achieved if someone had bought every fund within the Best of the Best Selection on 1st January and copied the Selection as it evolved over the year.
The Best of the Best Selection is up over 4% year to date (at one point it was up as much as 12%). So in other words the balanced portfolio investing in a range of assets including bonds and equities would have ranked 8th (outperforming over 30 other sectors) in the above table of 2015 winners.
That just goes to prove the robustness of the 80-20 Investor algorithm. It also highlights what can be achieved with very little time and effort on your part and the use of 80-20 Investor. How does that compare with the total return from the FTSE 100 (with dividends reinvested) and the average managed fund? How about the equivalent tracker funds from Vanguard which have the same asset mix?
| Portfolio | 2015 Return % |
| 80-20 Investor | 4.04 |
| Passive tracker portfolio | 0.96 - 1.13 |
| Average fund manager | 0.37 - 1.02 |
| FTSE 100 | -4.35 |
The reason why the 80-20 Investor portfolio was able to outperform is that it continually pivoted where it was investing. It is therefore no coincidence that the portfolio has been invested in the sectors which appear in the winners' table above.
Outlook for 2016
In 2015 most investors were caught by surprise by the marked increase in volatility, a result of the various unfolding crises. So what can we expect from 201?. More of the same? Does it even matter given how wide of the mark most investors are with their predictions (as evidenced earlier).
In truth an investment process, such as that baked into 80-20 Investor helps ensure you can ignore the noise and make rational and (hopefully) profitable investment decisions. So in a sense you shouldn't care too much about what the smart money thinks is going to happen in 2016 and let 80-20 Investor's algorithm and analysis guide you. However, while the investment banks' crystal ball gazing ability is questionable these guys are significant players in the markets so always influence its movement to a certain extent. As shown last year their 'year-ahead' forecasts more accurately predict the coming months (i.e the first quarter of the year). That's not surprising as in reality most people derive their long term view by just extrapolating their short term view of where markets are headed.
A recent poll of nearly 40 traders, fund managers and investment bank strategists came up with median forecasts of
- 6,250 for the FTSE 100 at the end of 2015
- 6,400 by mid-2016
- 6,700 by end of 2016
Or in other words they forecast a 10% rise in the FTSE 100 within the year. That's pretty bullish but not as bullish as the 14% rise they predict for European Equities.
(Photo by Stuart Miles via freedogotalphotos.net)
The material in any email, the MonetotheMasses.com website, associated pages / channels / accounts and any other correspondence are for general information only and do not constitute investment, tax, legal or other form of advice. You should not rely on this information to make (or refrain from making) any decisions. Always obtain independent, professional advice for your own particular situation. See full Terms & Conditions and Privacy Policy
Neither MoneytotheMasses.com/80-20 Investor nor its content providers are responsible for any damages or losses arising from any use of this information. Past performance is no guarantee of future results.
Funds invest in shares, bonds, and other financial instruments and are by their nature speculative and can be volatile. You should never invest more than you can safely afford to lose. The value of your investment can go down as well as up so you may get back less than you originally invested.
Information provided by MoneytotheMasses.com/80-20 Investor is for general information only and not intended to be relied upon by readers in making (or not making) specific investment decisions.
Appropriate independent advice should be obtained before making any such decisions. Leadenhall Learning (owner of MoneytotheMasses.com/80-20 Investor) and its staff do not accept liability for any loss suffered by readers as a result of any such decisions.
The tables and graphs are derived from data supplied by Trustnet. All rights Reserved.

£200 Pension Cashback Offer
Make a qualifying deposit or transfer a pension to our partner Interactive Investor.
- Deposit or transfer a pension of at least £20k and you could earn £200 cashback
- Terms and Fees apply, Capital at risk
- New & Existing customers opening a SIPP
- Offer ends 31st July 2026
Before starting your transfer, check you won't lose any valuable benefits (such as guaranteed annuity rates or a lower protected pension age) and find out what exit fees you might have to pay
