

Commentary
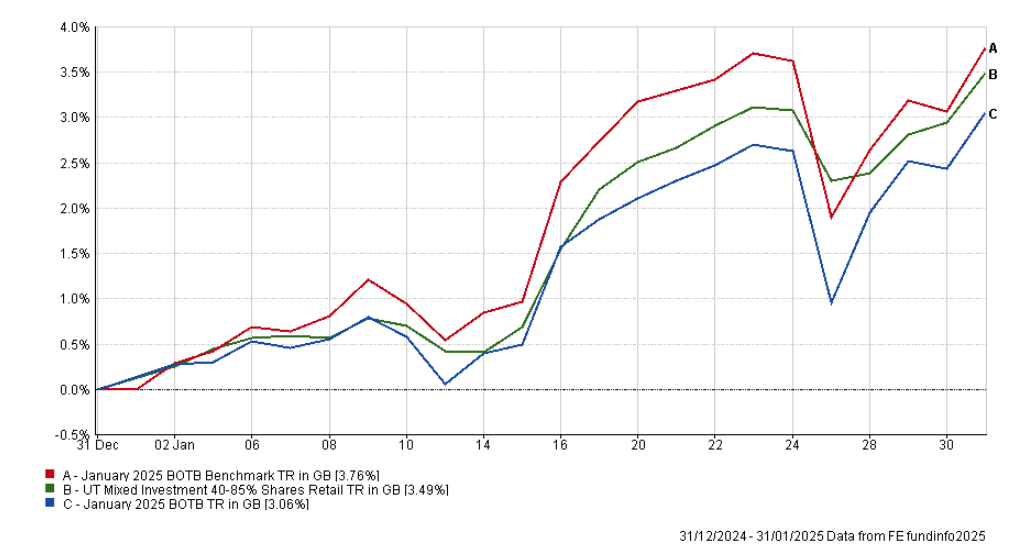
Of the 30 funds in January's BOTB selection 15 funds have retained their place this month. While this is the lowest number for some time, the BOTB still performed very strongly during January, with the average return across the selection being over 3%. However, as you can see in the chart below, January's BOTB lagged its benchmarks after it took a hit following the launch of the new Chinese DeepSeek AI model, which sent US tech stocks into a tailspin. Ultimately, the selection did recover to finish the month at a new all-time high, as shown in the chart at the foot of this article. In fact, the BOTB has now crossed the 100% profit mark, meaning that it has now doubled in value since its inception in 2014.

Digging deeper into the performance of the funds within the BOTB during January, the table below highlights the top performers. These were mostly made up of funds with US exposure (so they benefited from the slump in the pound versus the US dollar) but with limited or no exposure to big US tech stocks (so avoiding the DeepSeek damage). It is good to see that 2 of the funds listed are in my own £50k portfolio.
| Fund | January 2025 % return |
| Artemis Global Income | 7.25 |
| Ninety One UK Equity Income | 6.07 |
| M&G Global Dividend | 5.67 |
| Fidelity American | 5.55 |
| Troy Asset Management Ltd Trojan Global Income | 5.29 |
At the other end of the scale you can see that only three funds from January's BOTB lost money, which goes to show just how good a month it was. The bottom two funds both have significant exposure to Indian equities which have endured their worst four-month period of losses in over two decades, due to weak earnings results and concerns over US trade tariffs.
| Fund | January 2025 % return |
| abrdn High Yield Bond | 0.65 |
| CT High Yield Bond | 0.58 |
| Man Absolute Value Fund | -0.81 |
| FSSA Asia Focus | -1.08 |
| Schroder Asian Discovery | -2.11 |
In terms of February's asset mix, it is not much different to the asset mix from January. However, the most notable difference is the shift from global equity funds to global equity income funds. This is a reflection of the vulnerability we've seen in the AI-theme and large US tech stocks. Global equity income funds tend to focus on companies that pay reliable dividends and as such tend not to have exposure to US tech stocks. The one notable change in the asset mix is the removal of any direct exposure to Japanese equites.
Below I list this month's selection in full with the 15 funds that regained their place in black while the new additions are in green. As usual, I have included the full list sorted alphabetically by name and then by risk category.
February's Best of the Best Selection - (A-Z by fund name)
(funds unchanged from last month are in black while new additions are in green):
| Name | Sector | ISIN Code | Risk |
| Artemis Global Income | Global Equity Income | GB00B5N99561 | Medium risk |
| Artemis UK Select | UK All Companies | GB00B2PLJG05 | Higher risk |
| Aviva Inv Continental European Equity | Europe Excluding UK | GB0004457973 | Medium risk |
| AXA Framlington American Growth | North America | GB00B5LXGG05 | Higher risk |
| AXA Framlington Global Technology | Technology & Technology Innovation | GB00B4W52V57 | Higher risk |
| Baillie Gifford China | China/Greater China | GB00B39RML74 | Higher risk |
| Baillie Gifford High Yield Bond | Sterling High Yield | GB0030816606 | Lower risk |
| BNY Mellon Global High Yield Bond | Sterling High Yield | GB00B7KWF216 | Lower risk |
| BNY Mellon Global Opportunities | Global | GB00B83R9Z17 | Medium risk |
| BNY Mellon Real Return | Targeted Absolute Return | GB00B8GG4B61 | Lower risk |
| CT Emerging Market Bond | Global EM Bonds - Hard Currency | GB0002365608 | Lower risk |
| Fidelity American | North America | GB00B8GPC429 | Higher risk |
| Fidelity Global Dividend | Global Equity Income | GB00B7778087 | Medium risk |
| Fidelity Index Pacific ex Japan | Asia Pacific Excluding Japan | GB00BHZK8G51 | Higher risk |
| Invesco Asian (UK) | Asia Pacific Excluding Japan | GB00B1W7HW60 | Higher risk |
| Invesco Global Equity Income (UK) | Global Equity Income | GB00B3FD1Z66 | Medium risk |
| Invesco Global Ex UK Enhanced Index (UK) | Global | GB00BZ8GWQ44 | Medium risk |
| Invesco High Yield (UK) | Sterling High Yield | GB00B3RW7649 | Lower risk |
| Jupiter China | China/Greater China | GB00B1DTDX49 | Higher risk |
| Jupiter Merian Global Equity | Global | GB00B1XG8F22 | Medium risk |
| L&G Strategic Bond | Sterling Strategic Bond | GB00B1TWMW95 | Lower risk |
| M&G Recovery | UK All Companies | GB00B7759Y38 | Medium risk |
| Man High Yield Opportunities Fund | Sterling High Yield | GB00BJK3W057 | Lower risk |
| Sarasin Global Dividend | Global Equity Income | GB00BGDF8F44 | Medium risk |
| Sarasin Global Equity Real Return | Mixed Investment 40-85% Shares | GB00B7W4B053 | Medium risk |
| Schroder High Yield Opportunities | Sterling High Yield | GB00B83RDY83 | Lower risk |
| Schroder Managed Wealth Portfolio | Mixed Investment 20-60% Shares | GB00B84YNB54 | Lower risk |
| T. Rowe Price US Large Cap Growth Equity | North America | GB00BD5FHW12 | Higher risk |
| Thesis TM Tellworth UK Select | Targeted Absolute Return | GB00BNY7YM73 | Lower risk |
| UBS US Growth | North America | GB00B7VHZX64 | Higher risk |
February's Best of the Best Selection - (grouped by risk)
Here is February's shortlist grouped by their risk category (funds unchanged from last month are in black while new additions are in green):
| Name | Sector | ISIN Code | Risk |
| Baillie Gifford High Yield Bond | Sterling High Yield | GB0030816606 | Lower risk |
| BNY Mellon Global High Yield Bond | Sterling High Yield | GB00B7KWF216 | Lower risk |
| BNY Mellon Real Return | Targeted Absolute Return | GB00B8GG4B61 | Lower risk |
| CT Emerging Market Bond | Global EM Bonds - Hard Currency | GB0002365608 | Lower risk |
| Invesco High Yield (UK) | Sterling High Yield | GB00B3RW7649 | Lower risk |
| L&G Strategic Bond | Sterling Strategic Bond | GB00B1TWMW95 | Lower risk |
| Man High Yield Opportunities Fund | Sterling High Yield | GB00BJK3W057 | Lower risk |
| Schroder High Yield Opportunities | Sterling High Yield | GB00B83RDY83 | Lower risk |
| Schroder Managed Wealth Portfolio | Mixed Investment 20-60% Shares | GB00B84YNB54 | Lower risk |
| Thesis TM Tellworth UK Select | Targeted Absolute Return | GB00BNY7YM73 | Lower risk |
| Artemis Global Income | Global Equity Income | GB00B5N99561 | Medium risk |
| Aviva Inv Continental European Equity | Europe Excluding UK | GB0004457973 | Medium risk |
| BNY Mellon Global Opportunities | Global | GB00B83R9Z17 | Medium risk |
| Fidelity Global Dividend | Global Equity Income | GB00B7778087 | Medium risk |
| Invesco Global Equity Income (UK) | Global Equity Income | GB00B3FD1Z66 | Medium risk |
| Invesco Global Ex UK Enhanced Index (UK) | Global | GB00BZ8GWQ44 | Medium risk |
| Jupiter Merian Global Equity | Global | GB00B1XG8F22 | Medium risk |
| M&G Recovery | UK All Companies | GB00B7759Y38 | Medium risk |
| Sarasin Global Dividend | Global Equity Income | GB00BGDF8F44 | Medium risk |
| Sarasin Global Equity Real Return | Mixed Investment 40-85% Shares | GB00B7W4B053 | Medium risk |
| Artemis UK Select | UK All Companies | GB00B2PLJG05 | Higher risk |
| AXA Framlington American Growth | North America | GB00B5LXGG05 | Higher risk |
| AXA Framlington Global Technology | Technology & Technology Innovation | GB00B4W52V57 | Higher risk |
| Baillie Gifford China | China/Greater China | GB00B39RML74 | Higher risk |
| Fidelity American | North America | GB00B8GPC429 | Higher risk |
| Fidelity Index Pacific ex Japan | Asia Pacific Excluding Japan | GB00BHZK8G51 | Higher risk |
| Invesco Asian (UK) | Asia Pacific Excluding Japan | GB00B1W7HW60 | Higher risk |
| Jupiter China | China/Greater China | GB00B1DTDX49 | Higher risk |
| T. Rowe Price US Large Cap Growth Equity | North America | GB00BD5FHW12 | Higher risk |
| UBS US Growth | North America | GB00B7VHZX64 | Higher risk |
The funds that dropped out of the Best of the Best Selection
For reference, the funds from last month that dropped out of the 80-20 Investor Best of the Best list are listed below:
| Name | Sector | ISIN Code | Risk |
| abrdn High Yield Bond | Sterling High Yield | GB0000938844 | Lower risk |
| Artemis SmartGARP UK Equity | UK All Companies | GB00B2PLJM64 | Medium risk |
| AXA Framlington Fintech | Financials and Financial Innovation | GB00B5BHKC62 | Higher risk |
| Barclays Global Markets Balanced | Mixed Investment 20-60% Shares | GB00B4Z0MR31 | Lower risk |
| CT High Yield Bond | Sterling High Yield | GB0008371014 | Lower risk |
| Fidelity Index World | Global | GB00BJS8SJ34 | Medium risk |
| FSSA Asia Focus | Asia Pacific Excluding Japan | GB00BWNGXJ86 | Higher risk |
| L&G Global Technology Index Trust | Technology & Technology Innovation | GB00B0CNH163 | Higher risk |
| M&G Global Dividend | Global Equity Income | GB00B46J9127 | Medium risk |
| Man Group Man Absolute Value | Targeted Absolute Return | GB00BF1X8084 | Lower risk |
| Man Group Man Japan CoreAlpha | Japan | GB00B0119B50 | Higher risk |
| Man Group Man Sterling Corporate Bond | Sterling Corporate Bond | GB00BNLYQX62 | Lower risk |
| Ninety One UK Equity Income | UK All Companies | GB00BV9G3J51 | Medium risk |
| Schroder Asian Discovery | Asia Pacific Excluding Japan | GB00B5ZS9V71 | Medium risk |
| Troy Asset Management Ltd Trojan Global Income | Global Equity Income | GB00BD82KP33 | Medium risk |
The Asset mix
The current asset mix of the new Best of the Best Selection is shown below with last month's figures in brackets:
- Global Fixed Interest 18% (20%)
- UK Fixed Interest 5% (3%)
- Alternatives 10% (10%) - includes absolute return strategies
- North American Equities 27% (27%)
- Emerging Market Equities 3% (0%)
- Asian Equities 6% (6%)
- European Equities 8% (5%)
- Japanese Equities 1% (5%)
- UK Equities 11% (12%)
- Cash 0% (0%)
- China Equities 6% (6%)
- Property Equities 0% (0%)
- Other International Equities 5% (6%)
- Commodities and Energy 0% (0%)
80-20 Investor's outperformance continues
As you know the Best of the Best Selection is the shortlist of the best funds highlighted by our 80-20 Investor algorithm split into high, medium and low-risk categories. This shortlist is updated at the start of every month.
The green line in the chart below (click to enlarge) shows how a portfolio would have performed since inception (in August 2014) if it had been split equally between the Best of the Best Selection funds and then switched each month when each new shortlist was published. I have also charted the performance against that of the average cautious managed fund (blue line) and the average managed fund with up to 85% equity exposure (red line). In reality, the 80-20 Investor's asset allocation typically lies between these two as it usually has 40-60% exposure to equities at any one time. So they provide a good comparison of how fund managers with a similar remit have fared over the same period.
As you can see, since launch in August 2014 the 80-20 Investor BOTB has outperformed the average managed fund and the market.


All performance figures are net of fund charges. The material in any email, the MoneytotheMasses.com website, associated pages / channels / accounts and any other correspondence are for general information only and do not constitute investment, tax, legal or other form of advice. You should not rely on this information to make (or refrain from making) any decisions. Always obtain independent, professional advice for your own particular situation. See full Terms & Conditions, Privacy Policy and Disclaimer.
Neither MoneytotheMasses.com or 80-20 Investor nor its content providers are responsible for any damages or losses arising from any use of this information. Past performance is no guarantee of future results.
Funds invest in shares, bonds, and other financial instruments and are by their nature speculative and can be volatile. You should never invest more than you can safely afford to lose. The value of your investment can go down as well as up so you may get back less than you originally invested. Tax rules can change and benefits depend on individual circumstances.
Information provided by MoneytotheMasses.com or 80-20 Investor is for general information only and not intended to be relied upon by readers in making (or not making) specific investment decisions.
Appropriate independent advice should be obtained before making any such decisions. Leadenhall Learning (owner of MoneytotheMasses.com or 80-20 Investor) and its staff do not accept liability for any loss suffered by readers as a result of any such decisions.
The tables and graphs are derived from data supplied by Trustnet. All Rights Reserved.

£200 Pension Cashback Offer
Make a qualifying deposit or transfer a pension to our partner Interactive Investor.
- Deposit or transfer a pension of at least £20k and you could earn £200 cashback
- Terms and Fees apply, Capital at risk
- New & Existing customers opening a SIPP
- Offer ends 31st July 2026
Before starting your transfer, check you won't lose any valuable benefits (such as guaranteed annuity rates or a lower protected pension age) and find out what exit fees you might have to pay
