

Commentary
Of the 30 funds in December's BOTB, 17 funds have retained their place in January's selection. The chart below shows the average performance of the BOTB during December (the green line) against a benchmark that is calculated using the respective sector averages for each fund in the BOTB and assuming the same asset mix (the blue line). You can see that the BOTB outperformed its benchmark, after last month’s disappointment.
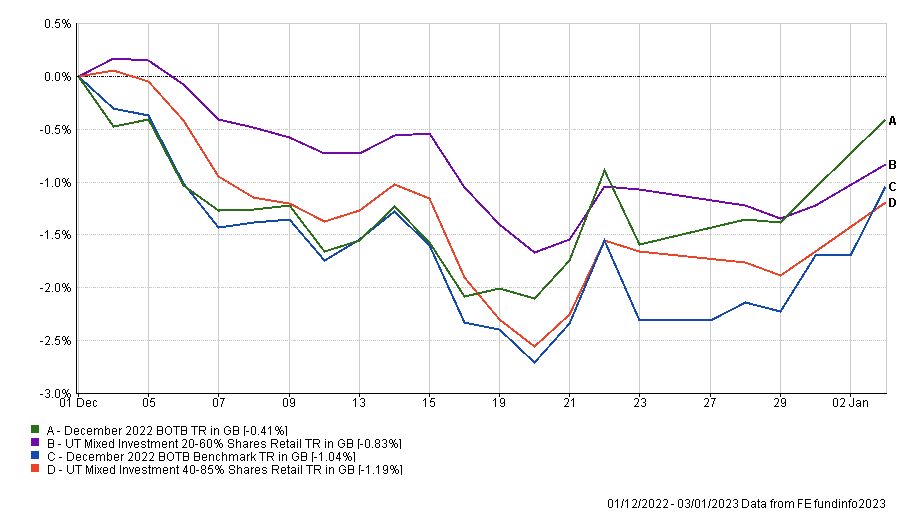
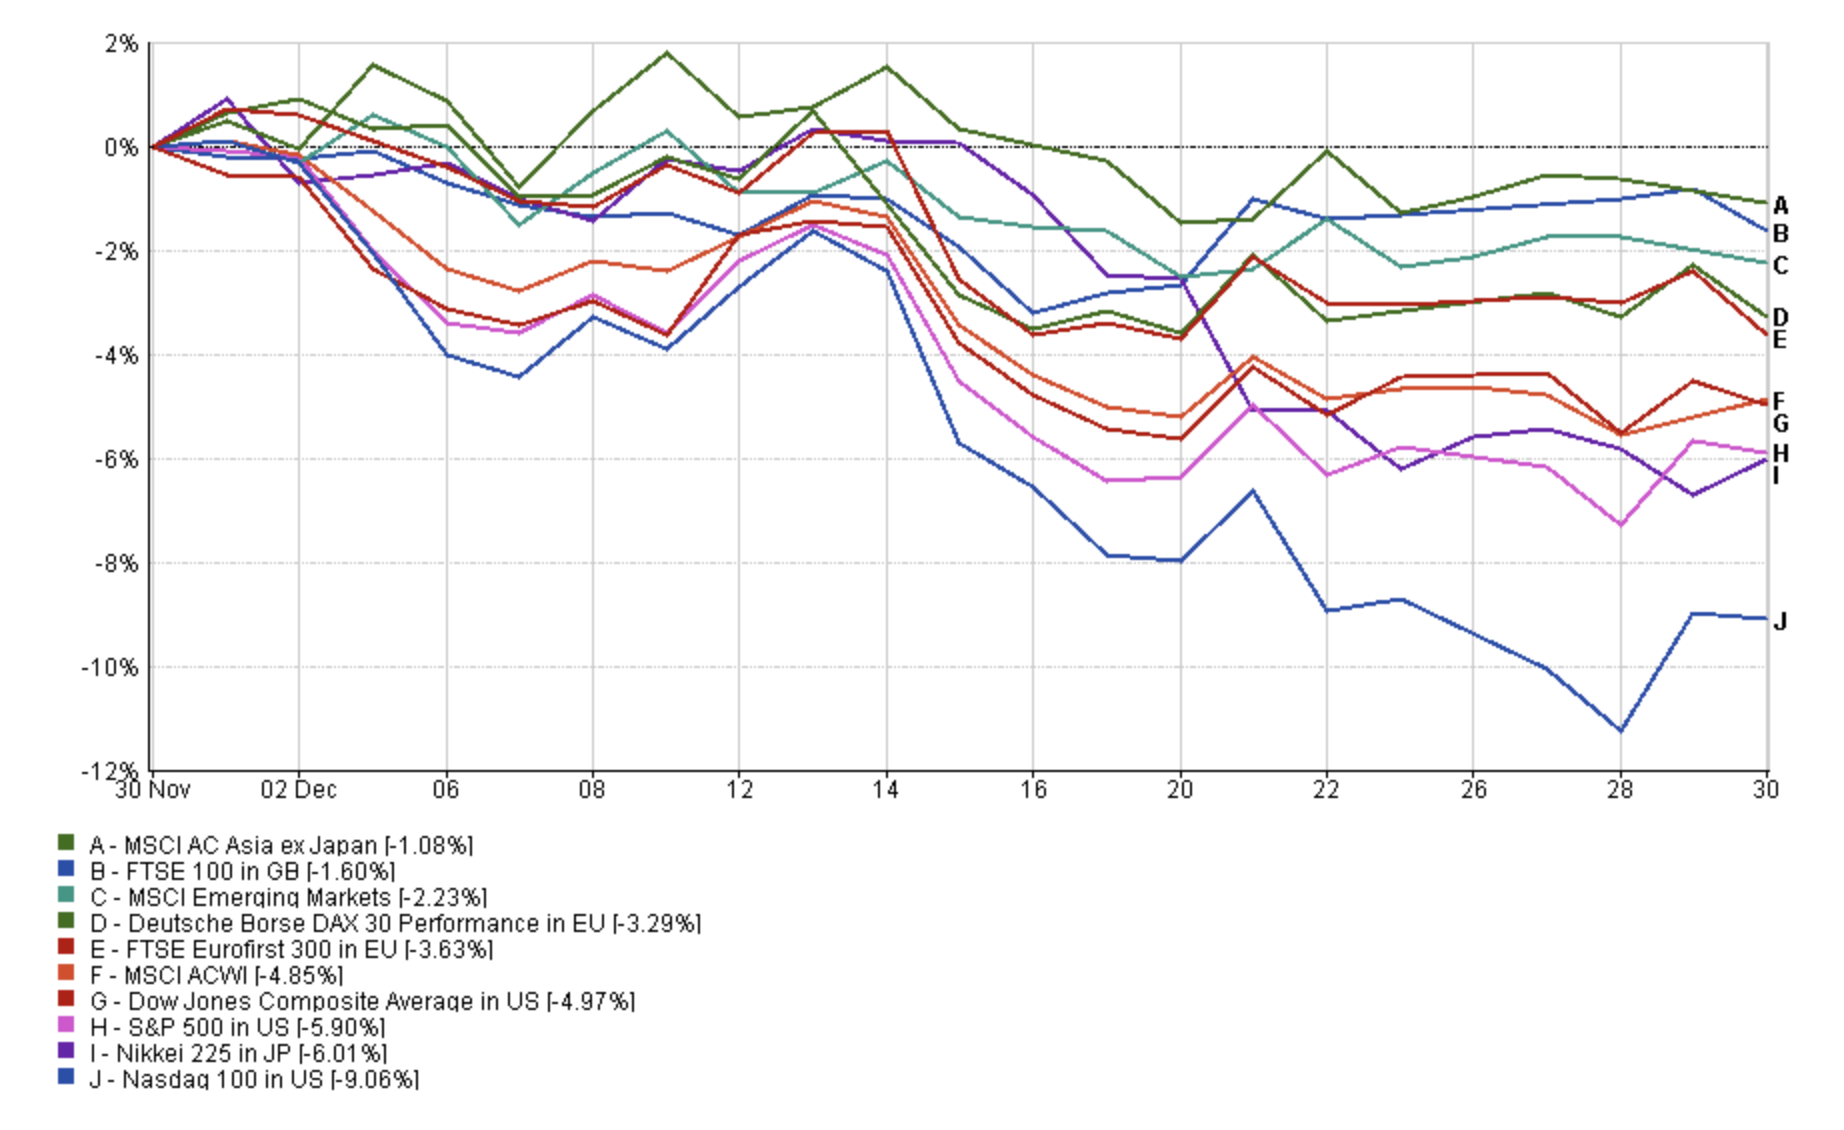
The above chart also shows how the selection has fared against the average professionally managed fund from the Mixed Investment 20-60% Shares sector and the Mixed Investment 40-85% Shares sector. The former is typically more cautious than the BOTB given its lower equity exposure while the latter tends to be more adventurous. You can see that the BOTB rebounded strongly during the last two weeks of December when we saw bonds struggle but Asian, emerging markets, UK, European and value stocks outperform their US peers, as shown in the chart below.
Within the BOTB the only drag on performance came from Indian equities and a few bond funds. But having said that, only three funds failed to make a profit during the month (shown below) which is a great result given how difficult December proved to be for investors, as shown in the chart above.
| Fund | December 2022 % return |
| Schroder Sustainable Bond | 0.08 |
| Invesco Global Targeted Returns (UK) | 0.02 |
| Jupiter Monthly Income Bond | -0.04 |
| EdenTree Responsible and Sustainable Short Dated Bond | -0.25 |
| Stewart Investors Indian Subcontinent Sustainability | -0.36 |
At the other end of the scale the best-performing funds, shown in the table below, include FSSA Asia Focus, BNY Mellon Global Income and Jupiter Global Value Equity, each of which are in my £50k portfolio.
| Fund | December 2022 % return |
| MI Thornbridge Global Opportunities | 4.46 |
| T. Rowe Price US Large Cap Value Equity | 3.91 |
| AXA Framlington Health | 3.44 |
| FSSA Asia Focus | 3.3 |
| Artemis Strategic Assets | 3.14 |
| BNY Mellon Global Income | 3.12 |
| McInroy & Wood Emerging Markets | 2.74 |
| Jupiter Global Value Equity | 2.72 |
If you recall, last month AXA Framlington Biotech had a stay of execution, after a disappointing November, and was included in December's BOTB. Although not shown above it returned 2.31% over the course of December, which ultimately justified its inclusion.
January's BOTB has an equity exposure of 60%. Once again, there is a slightly reduced US equity exposure but this month we also see a fall in the exposure to Asian/emerging markets. The key beneficiaries were UK equities and European equities. In fact the BOTB has its highest European equity exposure since the Ukraine war began. Similarly, the BOTB now has its highest exposure to bonds since the start of 2022. Both of these are bold moves that are in contrast with the trends that we saw in the BOTB during 2022, where European equity exposure and bond exposure were generally scaled back. Time will tell if the new shift proves profitable.
At the foot of this article, you can see how the 80-20 Investor selection continues to outperform the professional fund managers as well as the market since its launch eight years ago.
Below I list this month's selection in full with the 17 funds that regained their place in black while the new additions are in green. As usual, I have included the full list sorted alphabetically by name and then by risk category.
January's Best of the Best Selection - (A-Z by fund name)
(funds unchanged from last month are in black while new additions are in green)
| Name | Sector | ISIN Code | Risk |
| abrdn Europe ex UK Income Equity | Europe Excluding UK | GB00B7LG0W70 | High risk |
| abrdn Global Focused Equity | Global | GB00B6915J97 | High risk |
| abrdn High Yield Bond | Sterling High Yield | GB00B79RR984 | Low risk |
| Artemis Strategic Assets | Flexible Investment | GB00B3VDD431 | Medium risk |
| Aviva Inv Multi Strategy Target Return | Targeted Absolute Return | GB00BMTRW090 | Low risk |
| AXA Framlington Biotech | Specialist | GB00B784NS11 | High risk |
| AXA Global Short Duration Bonds | Sterling Strategic Bond | GB00BDFZQV30 | Low risk |
| BlackRock Natural Resources Growth & Income | Commodity/Natural Resources | GB00B6865B79 | High risk |
| BNY Mellon Global Income | Global Equity Income | GB00B7XK5M25 | Medium risk |
| EdenTree Responsible and Sustainable Short Dated Bond | Sterling Corporate Bond | GB00BZ012J01 | Low risk |
| Invesco Global Bond (UK) | Global Bonds | GB00B3RW7B97 | Low risk |
| Invesco Global Targeted Returns (UK) | Targeted Absolute Return | GB00B8CHD050 | Low risk |
| Jupiter Global Value Equity | Global | GB00BF5DRF26 | Medium risk |
| Jupiter Merian Global Strategic Bond | Sterling Strategic Bond | GB00B1XG7L17 | Low risk |
| Jupiter Merlin Balanced Portfolio | Mixed Investment 40-85% Shares | GB0031845141 | Medium risk |
| LF Brook Continental European | Europe Excluding UK | GB0031831570 | High risk |
| LF Lightman European | Europe Excluding UK | GB00BGPFJN79 | High risk |
| LF Ruffer Diversified Return | Targeted Absolute Return | GB00BMWLQW82 | Low risk |
| Liontrust India | India/Indian Subcontinent | GB00B1L6DV51 | High risk |
| M&G Short Dated Corporate Bond | Sterling Corporate Bond | GB0031110397 | Low risk |
| Man GLG Japan Core Alpha | Japan | GB00B3F46Y30 | Medium risk |
| McInroy & Wood Emerging Markets | Global Emerging Markets | GB00B7SKS407 | High risk |
| MI Thornbridge Global Opportunities | Global | GB00B5TP8W88 | High risk |
| Ninety One Global Special Situations | Global | GB00B29KP103 | High risk |
| Royal London Global Equity Income | Global Equity Income | GB00BL6V1118 | Medium risk |
| Stewart Investors Asia Pacific Sustainability | Specialist | GB00B0TY6V50 | Medium risk |
| TB Evenlode Income | UK All Companies | GB00BD0B7D55 | Medium risk |
| TB Saracen Global Income & Growth | Global Equity Income | GB00B5B35X02 | Medium risk |
| Thesis TM Tellworth UK Select | Targeted Absolute Return | GB00BNY7YM73 | Low risk |
| UBS UK Equity Income | UK Equity Income | GB00B4W58959 | Medium risk |
January's Best of the Best Selection - (grouped by risk)
Here is January's shortlist grouped by their risk category (funds unchanged from last month are in black while new additions are in green):
| Name | Sector | ISIN Code | Risk |
| abrdn High Yield Bond | Sterling High Yield | GB00B79RR984 | Low risk |
| Aviva Inv Multi Strategy Target Return | Targeted Absolute Return | GB00BMTRW090 | Low risk |
| AXA Global Short Duration Bonds | Sterling Strategic Bond | GB00BDFZQV30 | Low risk |
| EdenTree Responsible and Sustainable Short Dated Bond | Sterling Corporate Bond | GB00BZ012J01 | Low risk |
| Invesco Global Bond (UK) | Global Bonds | GB00B3RW7B97 | Low risk |
| Invesco Global Targeted Returns (UK) | Targeted Absolute Return | GB00B8CHD050 | Low risk |
| Jupiter Merian Global Strategic Bond | Sterling Strategic Bond | GB00B1XG7L17 | Low risk |
| LF Ruffer Diversified Return | Targeted Absolute Return | GB00BMWLQW82 | Low risk |
| M&G Short Dated Corporate Bond | Sterling Corporate Bond | GB0031110397 | Low risk |
| Thesis TM Tellworth UK Select | Targeted Absolute Return | GB00BNY7YM73 | Low risk |
| Artemis Strategic Assets | Flexible Investment | GB00B3VDD431 | Medium risk |
| BNY Mellon Global Income | Global Equity Income | GB00B7XK5M25 | Medium risk |
| Jupiter Global Value Equity | Global | GB00BF5DRF26 | Medium risk |
| Jupiter Merlin Balanced Portfolio | Mixed Investment 40-85% Shares | GB0031845141 | Medium risk |
| Man GLG Japan Core Alpha | Japan | GB00B3F46Y30 | Medium risk |
| Royal London Global Equity Income | Global Equity Income | GB00BL6V1118 | Medium risk |
| Stewart Investors Asia Pacific Sustainability | Specialist | GB00B0TY6V50 | Medium risk |
| TB Evenlode Income | UK All Companies | GB00BD0B7D55 | Medium risk |
| TB Saracen Global Income & Growth | Global Equity Income | GB00B5B35X02 | Medium risk |
| UBS UK Equity Income | UK Equity Income | GB00B4W58959 | Medium risk |
| abrdn Europe ex UK Income Equity | Europe Excluding UK | GB00B7LG0W70 | High risk |
| abrdn Global Focused Equity | Global | GB00B6915J97 | High risk |
| AXA Framlington Biotech | Specialist | GB00B784NS11 | High risk |
| BlackRock Natural Resources Growth & Income | Commodity/Natural Resources | GB00B6865B79 | High risk |
| LF Brook Continental European | Europe Excluding UK | GB0031831570 | High risk |
| LF Lightman European | Europe Excluding UK | GB00BGPFJN79 | High risk |
| Liontrust India | India/Indian Subcontinent | GB00B1L6DV51 | High risk |
| McInroy & Wood Emerging Markets | Global Emerging Markets | GB00B7SKS407 | High risk |
| MI Thornbridge Global Opportunities | Global | GB00B5TP8W88 | High risk |
| Ninety One Global Special Situations | Global | GB00B29KP103 | High risk |
The funds that dropped out of the Best of the Best Selection
For reference, the funds from last month that dropped out of the 80-20 Investor Best of the Best list are listed below:
| Name | Sector | ISIN Code | Risk |
| abrdn Global Equity | Global | GB0031682627 | High risk |
| AXA Framlington Health | Healthcare | GB00BRJZVQ71 | High risk |
| BNY Mellon Multi-Asset Balanced | Mixed Investment 40-85% Shares | GB00B8K9JZ06 | Medium risk |
| Fidelity European | Europe Excluding UK | GB00BFRT3504 | Medium risk |
| FSSA Asia Focus | Asia Pacific Excluding Japan | GB00BWNGXJ86 | High risk |
| Margetts BLENHEIM Diversified Fixed Income | Sterling Strategic Bond | GB00BNDQ8X45 | Low risk |
| Schroder Sustainable Bond | Sterling Strategic Bond | GB00B57BFC79 | Low risk |
| Stewart Investors Global Emerging Markets | Specialist | GB0030187438 | Medium risk |
| Stewart Investors Indian Subcontinent Sustainability | India/Indian Subcontinent | GB00B1FXTG93 | High risk |
| Stewart Investors Worldwide Leaders Sustainability | Global | GB0030978729 | High risk |
| T. Rowe Price Japanese Equity | Japan | GB00BD446L18 | High risk |
| T. Rowe Price US Large Cap Value Equity | North America | GB00BD446M25 | Medium risk |
| VT Johnston Multi-Asset Cautious | Mixed Investment 20-60% Shares | GB00BM952705 | Low risk |
The Asset mix
The current asset mix of the new Best of the Best Selection is shown below with last month's figures in brackets:
- Global Fixed Interest 19% (16%)
- Alternatives 12% (14%) - includes absolute return strategies
- North American Equities 14% (18%)
- Emerging Market Equities 6% (4%)
- European Equities 12% (9%)
- Japanese Equities 5% (5%)
- UK Equities 15% (11%)
- Cash 8% (9%)
- Asian / Emerging market equities 0% (14%)
- Other international equities 5% (0%)
- Commodities and Energy 4% (0%)
80-20 Investor's outperformance continues
As you know the Best of the Best Selection is the shortlist of the best funds highlighted by our 80-20 Investor algorithm split into high, medium and low-risk categories. This shortlist is updated at the start of every month.
The green line in the chart below (click to enlarge) shows how a portfolio would have performed since inception (in August 2014) if it had been split equally between the Best of the Best Selection funds and then switched each month when each new shortlist was published. I have also charted the performance against that of a FTSE 100 tracker fund (the black line) and the average cautious managed fund (blue line) and the average managed fund with up to 85% equity exposure (red line). In reality, the 80-20 Investor's asset allocation typically lies between these two as it usually has 40-60% exposure to equities at any one time. So they provide a good comparison of how fund managers with a similar remit have fared over the same period.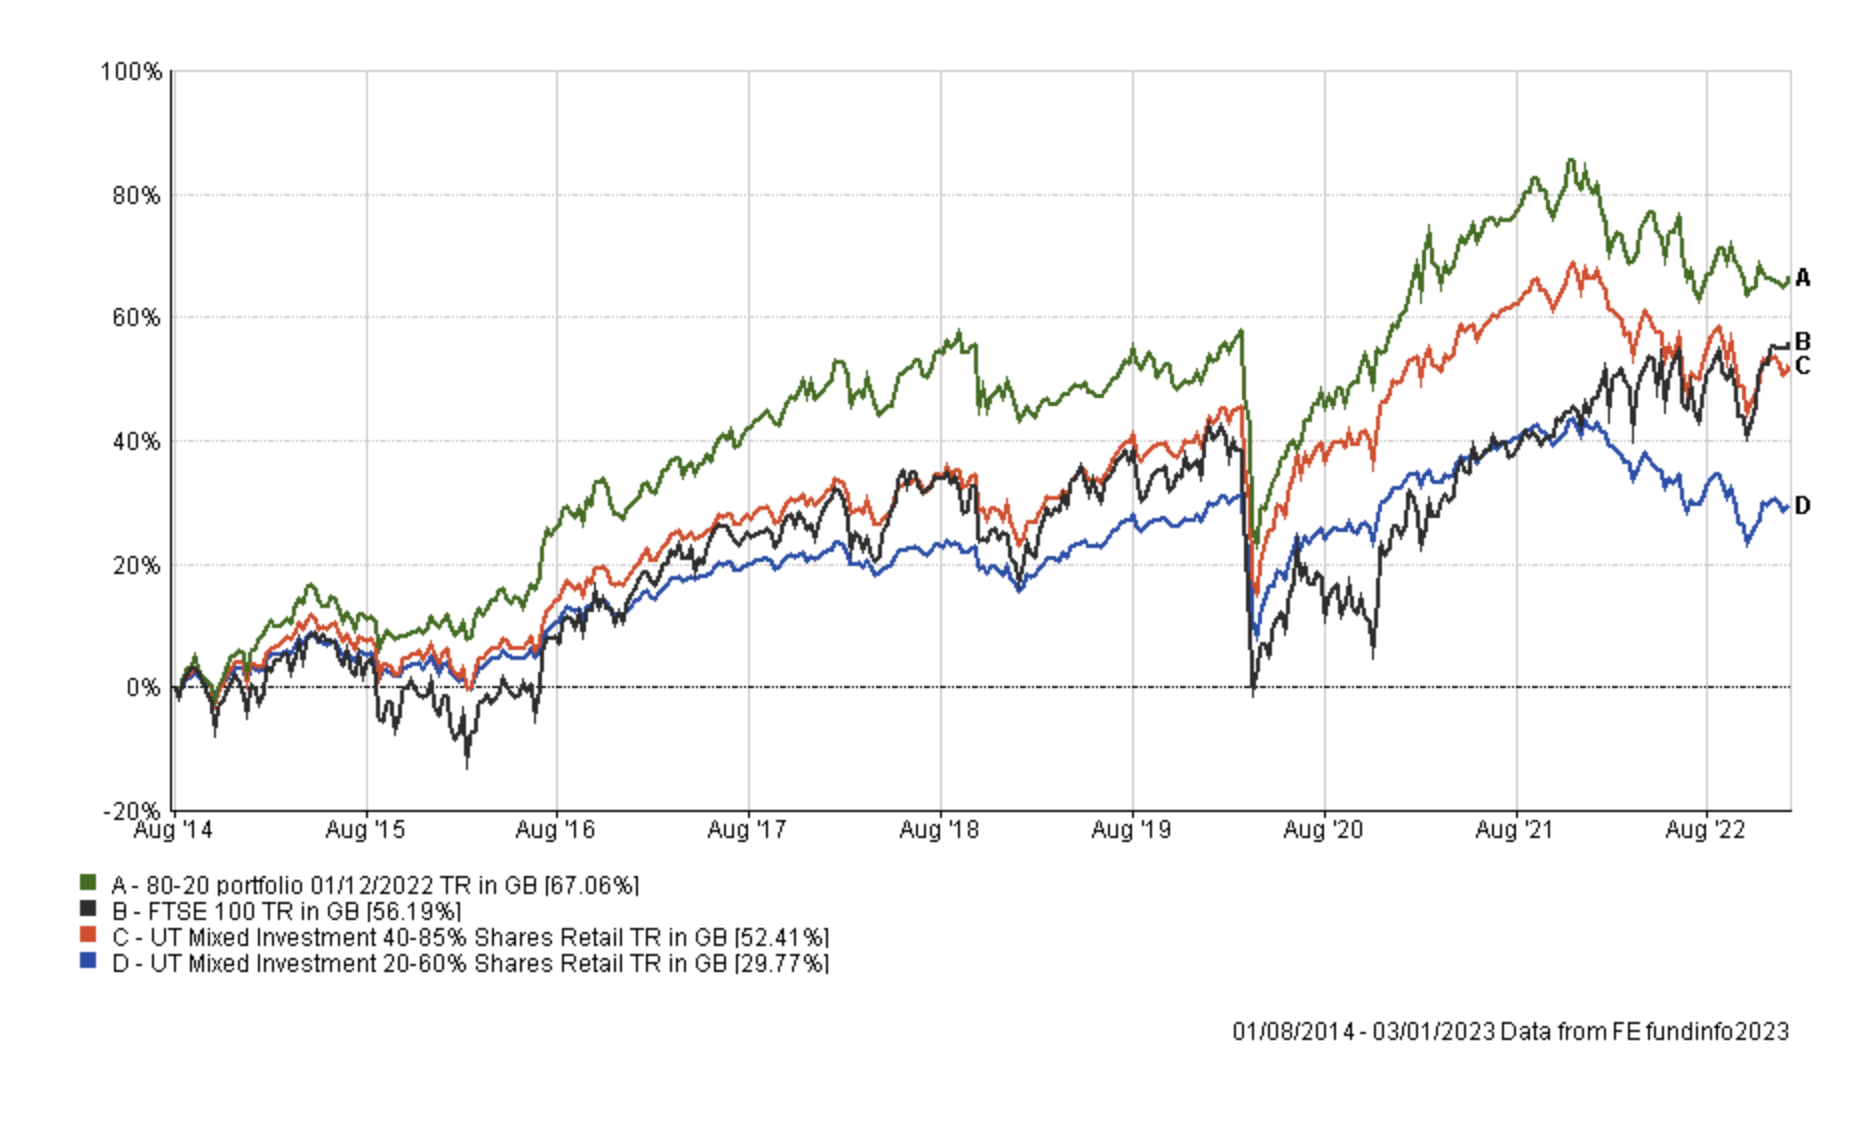
As you can see, since launch in August 2014 the 80-20 Investor BOTB has outperformed the average managed fund and the market.
All performance figures are net of fund charges. The material in any email, the MoneytotheMasses.com website, associated pages / channels / accounts and any other correspondence are for general information only and do not constitute investment, tax, legal or other form of advice. You should not rely on this information to make (or refrain from making) any decisions. Always obtain independent, professional advice for your own particular situation. See full Terms & Conditions, Privacy Policy and Disclaimer.
Neither MoneytotheMasses.com or 80-20 Investor nor its content providers are responsible for any damages or losses arising from any use of this information. Past performance is no guarantee of future results.
Funds invest in shares, bonds, and other financial instruments and are by their nature speculative and can be volatile. You should never invest more than you can safely afford to lose. The value of your investment can go down as well as up so you may get back less than you originally invested. Tax rules can change and benefits depend on individual circumstances.
Information provided by MoneytotheMasses.com or 80-20 Investor is for general information only and not intended to be relied upon by readers in making (or not making) specific investment decisions.
Appropriate independent advice should be obtained before making any such decisions. Leadenhall Learning (owner of MoneytotheMasses.com or 80-20 Investor) and its staff do not accept liability for any loss suffered by readers as a result of any such decisions.
The tables and graphs are derived from data supplied by Trustnet. All Rights Reserved.

£200 Pension Cashback Offer
Make a qualifying deposit or transfer a pension to our partner Interactive Investor.
- Deposit or transfer a pension of at least £20k and you could earn £200 cashback
- Terms and Fees apply, Capital at risk
- New & Existing customers opening a SIPP
- Offer ends 31st July 2026
Before starting your transfer, check you won't lose any valuable benefits (such as guaranteed annuity rates or a lower protected pension age) and find out what exit fees you might have to pay
