

80-20 Investor members will know that I have no preference for active or passive funds nor do I champion using one over the other. Just as a reminder actively managed funds are those run by a fund manager whose job it is to pick investments and use his or her skill to outperform their peers. Passive funds on the other hand tend to simply track market indices and are run by automated computer programmes. The latter tend to be considerably cheaper as a result.
80-20 Investor incorporates both types of funds and indeed my own £50,000 portfolio has contained both passive and active funds at various points as a result. Yet the debate rages on between the two camps over which is best. All the research on the subject always seems to start with the same flawed assumption, which is that you have to buy and hold an investment in perpetuity. Over the long term no fund manager always outperforms but they will over shorter time horizons when conditions favour their investment process. Equally they will have periods of underperformance. Neil Woodford, deemed by many as the most ‘gifted’ fund manager is having a torrid time at present.
With the unstoppable rise of passive investment offerings active fund managers, as well as financial journalists, are still fanning the flames of the active vs passive debate. Journalists do it because they need to sell newspapers and to appease their advertisers, the active fund managers themselves. Look through this weekend’s money sections and typically most of the adverts or advertorials promote active funds.
The conventional wisdoms surrounding active managed funds is that they tend to outperform in falling markets (as canny managers make active moves to avoid an impending crisis) but lag in rallies. With regard to the latter the conventional wisdom is that passive funds perform best during rallies. The logic is compelling, passive funds tend to be trackers so when the stock market rockets they too should head for the stars leaving active managers to play catch up as they scramble to jump on board the latest move.
However, this is based on the assumption that markets just go up and down. They also go sideways for long periods of time, such as they have done for the last few months. The assumption right now is that with markets at all-time highs a stock market crash is imminent. While that seems likely, there is also the scenario that we could trade sideways for an extended period of time before markets move up or down. History contains many examples.
A few months ago I read an interesting article in the Financial Times speculating that perhaps now was the time that active fund managers were poised to outperform their passive competitors. The article made some valid points. The crux of the article was that we are in a sideways market and passive strategies will just trend sideways too, constrained by their design. Active managers on the other hand exploit their stock picking genius to find pockets of outperformance in sideways markets. After all in a sideways moving market not everything moves sideways, just most things do. Interestingly the lengthy article had no evidence to back up its claims. Again conventional wisdom and logic formed much of the argument.
But is any of this actually true? Are we just being spun convenient truths that the fund management industry want us to believe? Are we just genuinely accepting what everyone else ‘knows’ as true, akin to the world being flat?
There’s no doubt that passive and active funds do outperform or underperform during different periods but is there any true pattern that is reflective of their active/passive nature rather than each fund’s own investment mandate.
This is a very difficult thing to test. To do it I looked at a benchmark of passive funds versus a benchmark for active management within the UK equity space. The reason for using UK equities is because it has the largest sample size (number of funds) and the longest track history. For the active managed benchmark I used the Investment Management association’s sector UK All Companies. This is made up almost exclusively of active managed funds although some expensive tracker funds creep in. However, their impact will be minimal as I’m looking at the average performance over all 240 funds.
So to start with let’s zoom right out and look back as far as I can obtain data for, which is as far back as 1990 . The chart below shows the performance of the average 'active fund (in red) versus that of passive UK equity funds (in blue).
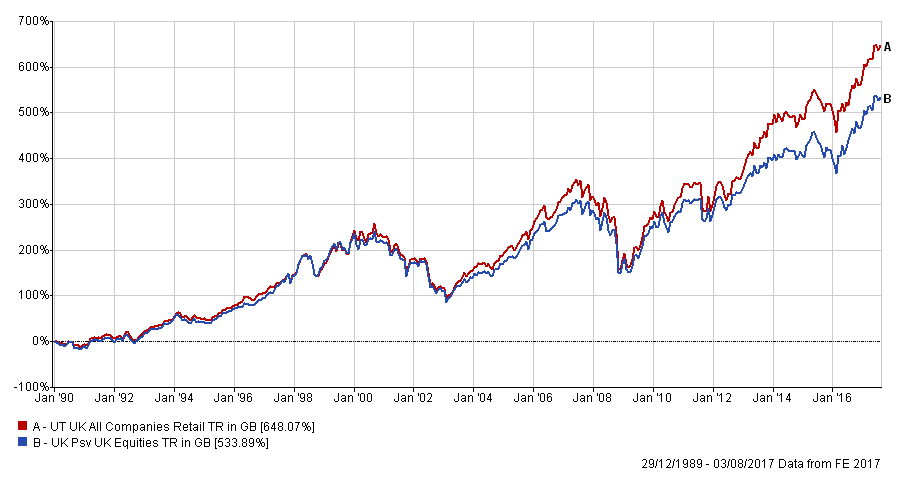
The chart suggests that the typical active fund has outperformed the average passive fund over the long term. That may surprise some but you can see from the chart that the outperformance isn't consistently achieved. So are there certain conditions when active outperforms passive investing? Also what about the the sideways market theory?
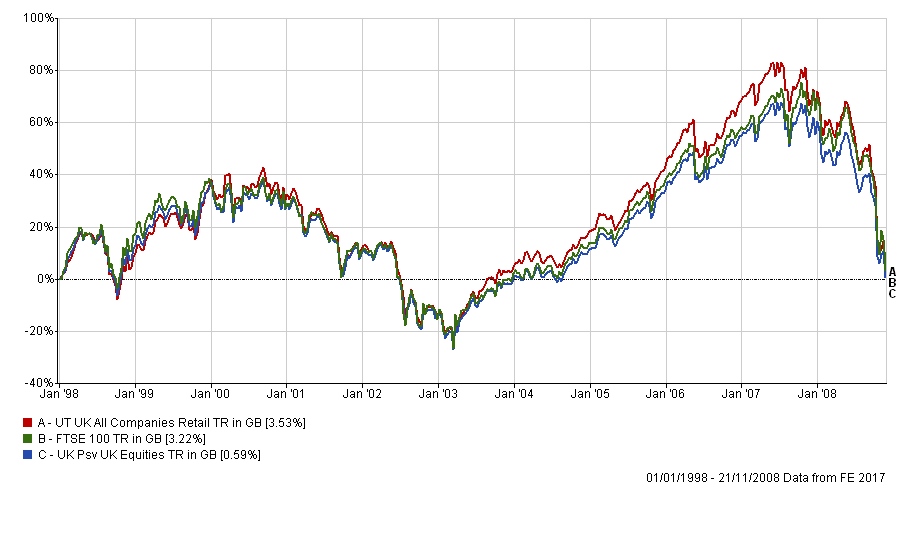
Again, taking a long term view the market went nowhere between 1998 and 2008. This does of course include the dotcom boom and bust and the financial crisis. The chart below shows how the FTSE 100 (black), the average active fund (in red) and the average passive fund (blue) fared during this period. The actively managed funds won by a whisker and it of course masks huge variations within the group itself. Passives performed surprisingly worse than the FTSE 100 index, and this may be partly due to old style passives being far more expensive than their modern day counterparts. However what you can see is that active funds hugely outperformed in the run up to the 2007 peak before crashing back down to earth along with the rest of the market.
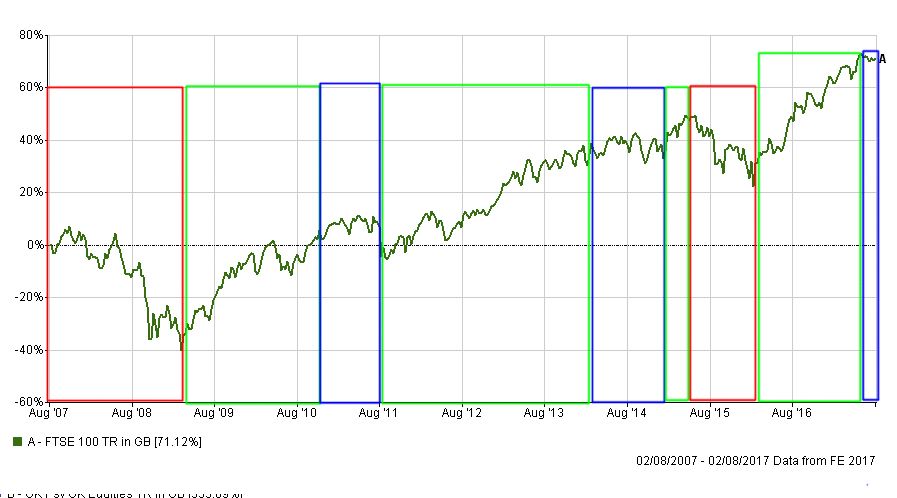
However, a sideways market can also be defined as one where prices remain constrained between previous market highs and previous market lows. By that definition the above sideways market doesn't fit the bill under this stricter definition. Identifying uptrends, downtrends and sideways markets is not an exact science. There is an element of subjectivity to it. Below is a chart of the FTSE 100 over the last five years. I am going to focus on the phases in this market and compare how passive and active funds typically fared. The benefit of doing so is that I can focus on a stricter definition of a sideways market. To be consistent I have considered a sideways market to be a period where the FTSE 100 doesn't move up or down by more than 5% and is generally constrained by its previous highs and low. The chart below (click to enlarge) shows the periods I've defined with green being an uptrend, red being a downtrend and blue being a sideways market.
I then looked to see if there was any pattern to whether active or passive funds outperform in each market condition. I also compared the performance of the FTSE 100 and FTSE All Share. This is shown in the table below:
| Type of market | Start date | End date | Active return % | Passive return % | FTSE 100 return % | FTSE All Share return % |
| Down | 03/08/2007 | 09/03/2009 | -43.44 | -41.15 | -39.29 | -40.86 |
| Up | 09/03/2009 | 22/12/2010 | 81.06 | 77.73 | 80.35 | 84.27 |
| Sideways | 22/12/2010 | 14/07/2011 | 1.04 | 0.2 | -0.39 | 0.21 |
| UP | 14/07/2011 | 24/02/2014 | 36.56 | 26.89 | 29.16 | 32.47 |
| Sideways | 24/02/2014 | 26/01/2015 | 0.57 | 1.92 | 2.96 | 2.72 |
| Up | 26/01/2015 | 26/05/2015 | 7.42 | 6.42 | 3.11 | 4.48 |
| Down | 26/05/2015 | 10/02/2016 | -14.5 | -16.62 | -16.65 | -15.81 |
| Up | 10/02/2016 | 22/05/2017 | 33.59 | 36.22 | 39.97 | 38.8 |
| Sideways | 22/05/2017 | 02/08/2017 | -0.11 | -0.37 | -0.74 | -0.51 |
In the table above I've highlighted the best (in green) and worst (in red) performers for each market period. The first thing to notice is that passives rarely outperformed. However if we look at the two equity indices (and assume they represent modern low cost passive tracking ETFS) they do outperform actives sometimes. But generally there is no discernible pattern amongst this albeit limited data set.
However the chart below of the cumulative performance of each portfolio/index over the last five years (i.e. the same period that the table above covers). clearly shows that the active funds (in red) outperformed.
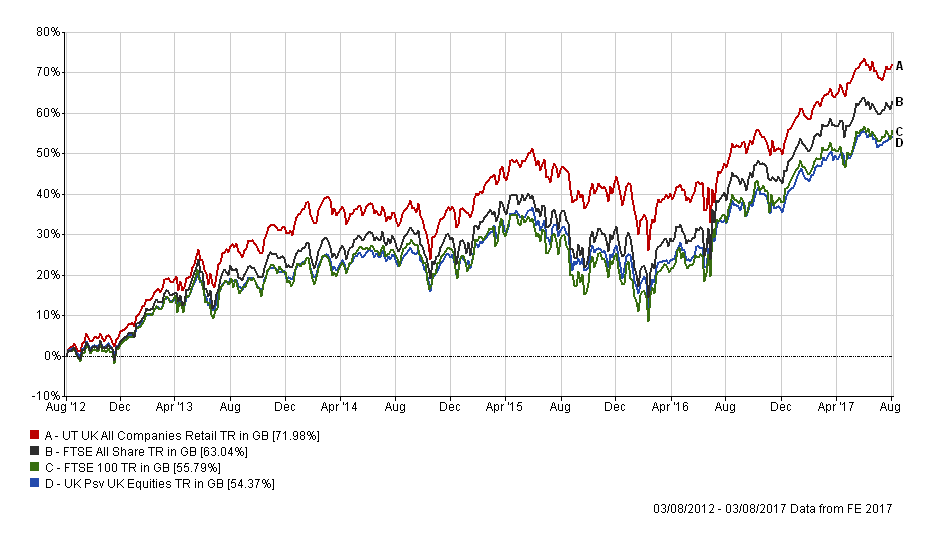
Most of this outperformance for active funds actually came in the second and third uptrends in the last five years. The rest of the time any outperformance was marginal at best or they lagged. But what is particularly interesting is that both of these favourable periods were preceded by sideways markets. Whenever an uptrend was preceded by a downtrend then active funds lagged, irrespective of how they performed in the downtrend.
While the evidence isn't conclusive it does suggest that the conventional wisdoms may not be true, Active fund managers likely outperform after a sideways market because they take bigger risks in order to try and outperform in a frustratingly stagnant period. After all they have to try and justify their fees. If the market suddenly rallies then this rewards the extra risk they've taken on board. Interestingly the results suggest that when the market is on the way down active managers apply the brakes which then limits the upside in the subsequent rebound. However, this isn't too detrimental to their performance across the period as a whole.
Given that we are in a sideways market right now should you invest in active funds for their stock picking prowess? I'd say there's no evidence to suggest that's a valid approach. However, if you think the market will resume an upward trajectory then it may well pay off. Yet I'd question the idea that the active fund managers will outperform by being good stock pickers. Some will but overall the outperformance of them as a collective has been correlated to that of smaller companies shares. Over the last 10 calendar years whenever the FTSE 250 has outperformed passive strategies so too have active funds, with only one exception.
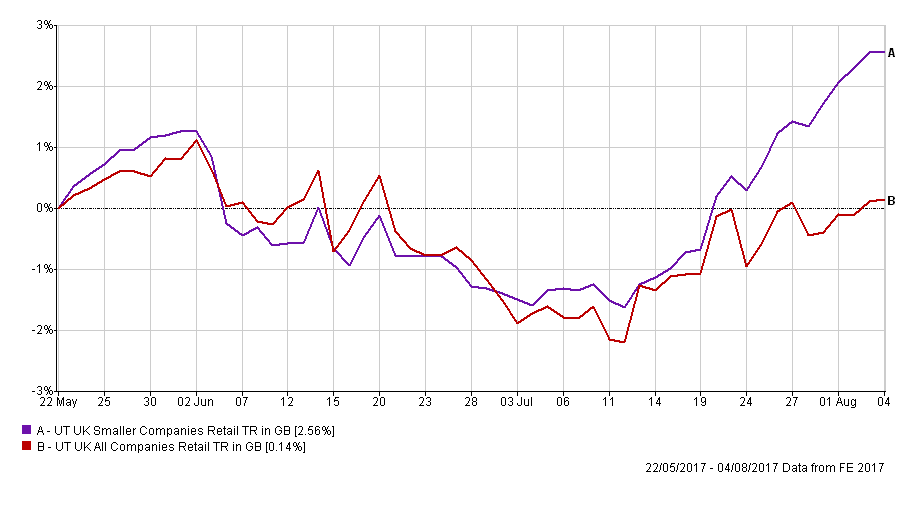
Research going back 100 years shows just three investment strategies have consistently outperformed all others, namely momentum investing , value investing and investing in smaller companies. The latter has had a great run over the last decade and fund managers have gravitated towards it as a result. The chart below (click to enlarge) shows the performance of smaller companies vs their larger cap counterparts during the current sideways market over the last few months. Smaller companies have suddenly started to show signs of outperforming. So perhaps active funds managers are about to start outperforming passive fund again, but not for the reasons the national press keep telling you.
It once again emphasises why armchair investors can and do outperform the market. Far from claiming to be great stock pickers, like fund managers do, they can follow one of the three aforementioned proven investment strategies. 80-20 Investor does just that.

£200 Pension Cashback Offer
Make a qualifying deposit or transfer a pension to our partner Interactive Investor.
- Deposit or transfer a pension of at least £20k and you could earn £200 cashback
- Terms and Fees apply, Capital at risk
- New & Existing customers opening a SIPP
- Offer ends 31st July 2026
Before starting your transfer, check you won't lose any valuable benefits (such as guaranteed annuity rates or a lower protected pension age) and find out what exit fees you might have to pay
