

I was asked the following question via Chatterbox a few months ago.
Do funds with performance fees do better than those that don’t. If so it would be useful to have this indicator
It's a very good question and I've not seen any evidence published to answer this either way. So this article looks to answer that question. But first, some of you may be unfamiliar with the concept of performance fees.
What is a fund performance fee?
A performance fee is a fee that is charged by a fund if certain investment return targets are hit. They usually are charged by investment trusts and targeted absolute return funds but you do occasionally see them in equity unit trust sectors.
Often the performance fees are levied in addition to the normal annual management charge but occasionally they replace it. What makes performance fees confusing is that how they are applied varies from fund to fund. The theory at least is that performance fees are meant to align the interests of investors and fund managers, motivating the latter to provide value for money for investors via increased returns.
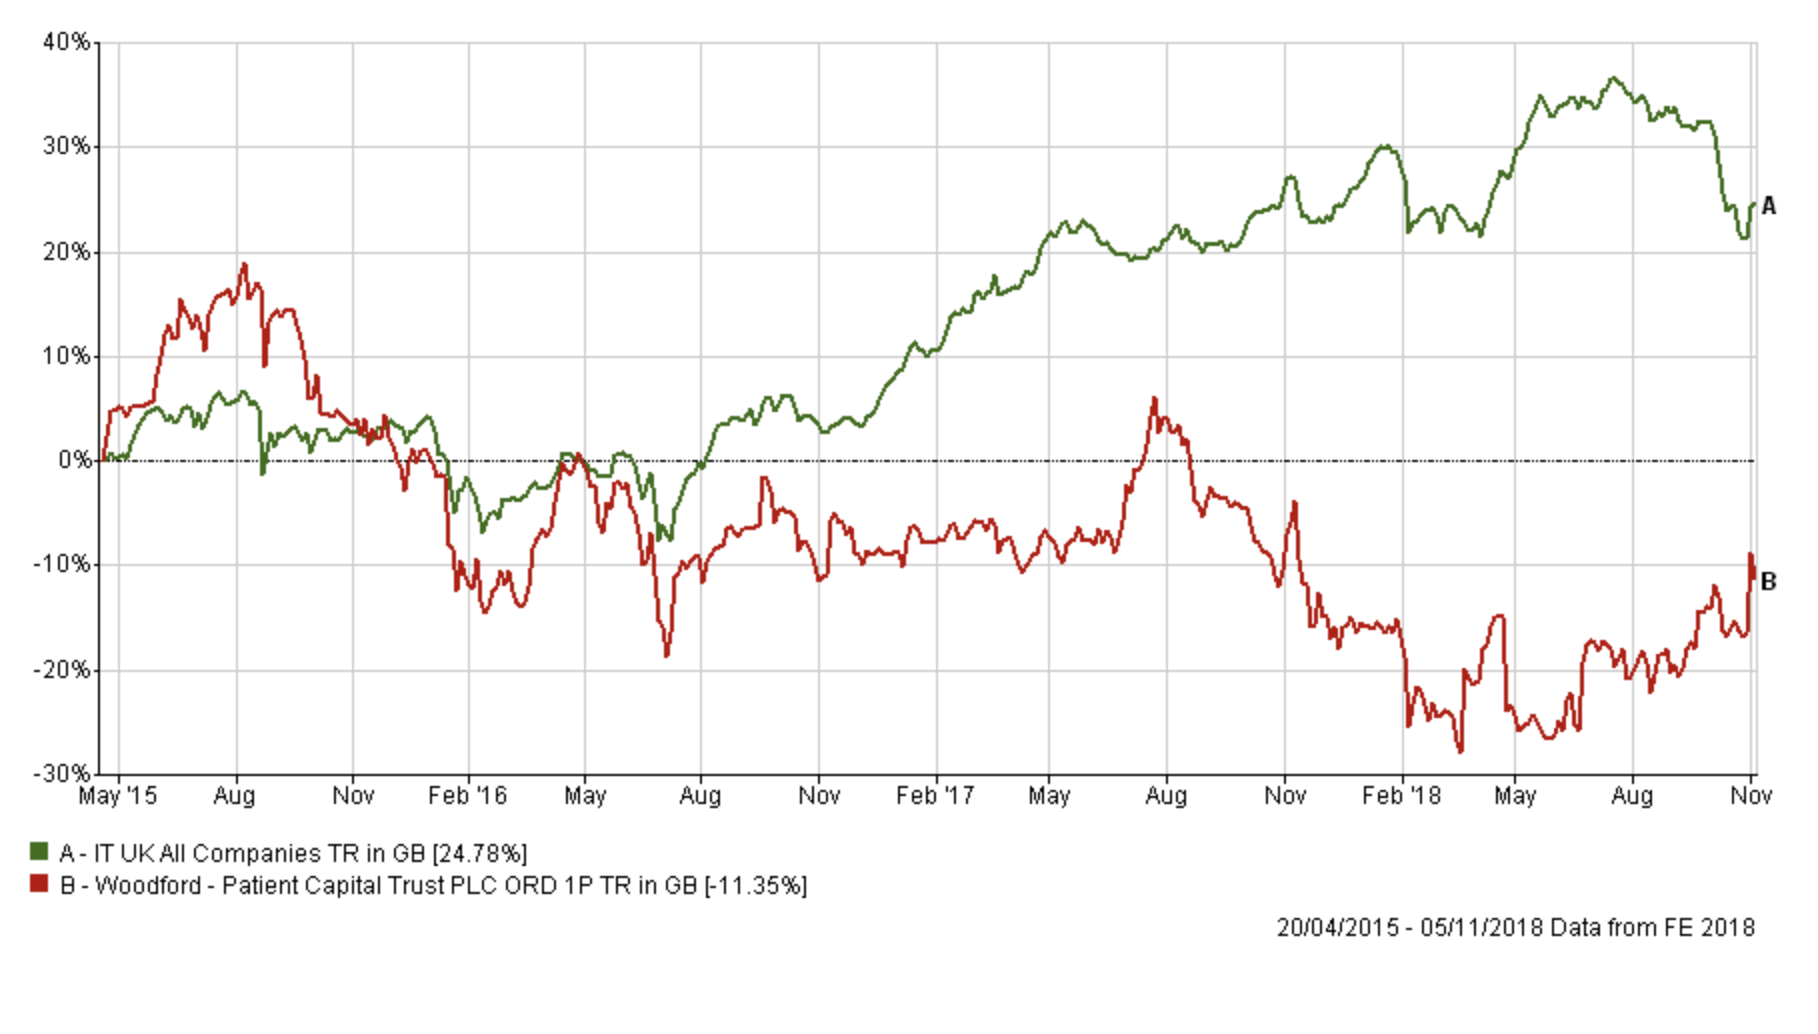
However, there have been some high profile funds that charge performance fees that have performed dismally. Neil Woodford's Patient Capital Trust is a case in point. This is an investment trust which, while not charging an annual management charge, charges a lofty performance fee of 15% of any excess returns over a 10% cumulative hurdle rate. What that means is that the performance fee is only applied if Neil Woodford delivers a cumulative return of 10% each year. It's a charging structure that seems fair to investors as it means that the fund only applies a performance fee if it keeps producing good returns (many funds with performance fees don't do this). The cumulative hurdle rate means that Woodford's fund can't take a performance fee following a period of underperformance. Perhaps that's just as well when you look at the chart below which shows Woodford's performance versus his peers since launch in April 2015.
So while the performance fee can be used as a marketing ploy to imply that investor and management interests are more aligned is there any evidence that it actually provides better investment returns? After all, as the saying goes, the road to hell is paved with good intentions.
Do performance fees lead to outperformance
When assessing the impact of a performance fee on investor returns it's important to not just focus on performance after charges. After all, a fund manager could theoretically take increased levels of risk to try and beat a given hurdle rate in order to generate revenue for the fund management company. But good investment management is about managing risk as well as producing investment returns. If you have a choice between two investments that produce the same returns but one takes much less investment risk (i.e you had a much lower chance of losing money) you would logically choose the lower risk option. So alongside annualised performance, I have also considered the following statistics:
Alpha - is a figure which measures a manager’s apparent skill at picking winning investments versus their benchmark. Alpha is the excess return versus the return of a fund’s benchmark (i.e the market). So a fund with a positive alpha indicates that the fund manager has outperformed through skill. While a negative alpha figure would indicate underperformance.
Beta - measures a fund’s sensitivity to the general market in which it operates. The market always has a beta of 1 by definition. So if a fund also has a beta of 1 that would mean that if the market rose by 5% then so should the fund. If the fund has a beta of -1 then as the market rises so the fund falls. A well-managed index fund will have a beta of exactly 1. Funds that outperform the market when it does well but do even worse when the market is going down will have a beta above 1. So a fund that will perform well in a rebound will likely be one with a beta of more than 1. Funds' beta statistics are sometimes published on their factsheets.
Sharpe ratio - not a widely known statistic yet it indicates how much extra return a fund manager has achieved for the increased risk they have taken. There is nothing wrong with fund managers taking calculated investment risks if they result in additional returns for investors. So the higher a fund’s sharpe ratio the better.
Maximum Drawdown - I analysed how the funds have performed over the last 3 years and what the maximum fall (from peak to trough) during the period was for each fund.
I also looked at the maximum weekly gain and maximum weekly loss over the last three years as well as the level of volatility.
To carry out the research I looked at the 2000+ unit trusts available to investors and determined which applied any form of performance fee. That gave a shortlist of 40 funds from a range of sectors including Global, North America, and UK equities but also property. However, a significant number (18 in fact) reside in the Targeted Absolute Return sector, a sector that is marketed as being able to provide positive returns in all market environments.
The full list of all 40 funds is as follows:
| Argonaut FP Argonaut Absolute Return |
| Artemis Pan-European Absolute Return |
| Artemis US Absolute Return |
| BlackRock Emerging Markets Absolute Alpha |
| BlackRock European Absolute Alpha |
| BlackRock UK Absolute Alpha |
| City Financial Absolute Equity |
| Insight Absolute Insight |
| Janus Henderson Credit Alpha |
| Janus Henderson European Absolute Return |
| Janus Henderson UK Absolute Return |
| LF Odey Absolute Return |
| S&W Saltus Multi Asset Class |
| Schroder European Equity Absolute Return |
| Schroder UK Dynamic Absolute Return |
| Thesis TM Sanditon European Select |
| Thesis TM Sanditon UK Select |
| Threadneedle UK Absolute Alpha |
| Carvetian Fenix Balanced |
| Orbis Global Balanced Standard |
| FP 8AM Tactical Growth Portfolio |
| Elite EF Rosevine Capital Global Equity |
| Orbis Global Equity Standard |
| Artemis US Extended Alpha |
| Threadneedle American Extended Alpha |
| TIME Investments Social Freehold |
| Barings Global Agriculture |
| FP WM Global Trend |
| Investec Enhanced Natural Resources |
| JOHCM UK Opportunities |
| Jupiter International Financials |
| M&G Episode Macro |
| TIME Investments Commercial Freehold |
| TIME Investments Freehold Income Authorised |
| JOHCM UK Equity Income |
| JOHCM UK Dynamic |
| Thesis TM Sanditon UK |
| Threadneedle UK Extended Alpha |
| VT Cape Wrath Focus |
| VT Sorbus Vector |
Next, I looked at how each fund had performed versus its peers (not its chosen benchmark because this can be manipulated by the manager to make it easier to charge a performance fee) for each of the key statistics mentioned above. I calculated which decile each fund ranked in its sector for each attribute. Remember that deciles run from 1 to 10, with the top 10% of funds for an attribute being given a decile number of 1. The worst funds are given a decile number of 10.
In theory, funds with a performance fee (regardless of their sector) should outperform their peers (i.e. be ranked in decile 5 or lower) for each attribute if there is even to be a suggestion that a performance fee has a positive impact. Of course, some funds do rank well while others don't so I wanted to see how the group performed as a whole over the last few years.
Therefore I calculated the mode (the most common decile rank), mean (the average rank) and median. As a reminder, the median is the middle number if you wrote the ranks in order. So the median of 1, 3, 3, 6, 7, 8, 9 is 6.
The table below shows the outcome for each attribute:
| Statistic | Median | Mode | Mean |
| Alpa | 6 | 8 | 5.44 |
| Beta | 5 | 1 | 4.91 |
| Max Drawdown | 5 | 10 | 5.65 |
| Max Gain | 5 | 1 | 4.94 |
| Max Loss | 5.5 | 7 | 5.76 |
| Return | 5.5 | 3 | 5.32 |
| Sharpe | 4 | 10 | 5.26 |
| Volatility | 6 | 4 | 5.94 |
If you focus on the mean number to start with you can see that generally, funds with performance fees don't tend to outperform or manage risk any better than funds without a performance fee. In fact, often they do slightly worse than average. The mode and median help give the averages some context. For example, if you look at the max loss row you can see that the average decile rank is 5.76 and the mode and median suggest that most of the results are bunched around that average. That means that funds with performance fees tend to suffer larger losses in falling markets. Conversely, the picture is slightly more positive for max gain and beta.
I have highlighted in red what the funds with performance fees are weakest at (volatility) and what they are best at (beta). Taking all this into account it suggests that there is a tendency for fund managers with performance fees to chase the upside with increased risk (higher volatility). But that extra risk isn't typically rewarded (as shown by the average Sharpe ratio ranked below 5).
Of course the mean figures across the table group around the number 5 as you would expect but the important takeaway is that there is no evidence that performance fees improve risk management or performance. In fact, the mode median and mean are all below 5 on specific characteristics, namely alpha (a measure of a manager's skill level), max loss and max drawdown.
Over the last three years, fund managers have clearly gravitated towards high beta strategies (i.e following the market trend) which has been rewarded when markets have risen (max gain) but lost when markets have fallen (max loss). This may suggest that, at best, some fund managers with performance fees have favoured a momentum strategy and then taken a slice of any outperformance via a performance fee or, at worst, simply created expensive closet tracker funds. That may explain why their mean performance figure isn't above 5 (the performance figures I've used are after performance fees have been deducted). Interestingly the mode (the most common rank) for return was 3 for 'return' while it is 1 for max gain. That may suggest that those funds ranking higher, which probably favoured momentum rather than closet tracking, took a smaller performance fee off the top.
The results are interesting but suggest that rather than picking a fund because it has a performance fee you would have been better off investing with momentum yourself using alternatives and not paying additional charges for the privilege. Remember, keeping charges low is key to successful investing.
However, we must bear in mind that the sample size is small, the time frame is short (only 3 years) and we don't have evidence of whether all the funds had performance fees in place for the whole duration. But what we can conclude is that while the evidence doesn't suggest that funds with performance fees should be avoided you should certainly not expect them to outperform or protect your capital by minimising downside risks

£200 Pension Cashback Offer
Make a qualifying deposit or transfer a pension to our partner Interactive Investor.
- Deposit or transfer a pension of at least £20k and you could earn £200 cashback
- Terms and Fees apply, Capital at risk
- New & Existing customers opening a SIPP
- Offer ends 31st July 2026
Before starting your transfer, check you won't lose any valuable benefits (such as guaranteed annuity rates or a lower protected pension age) and find out what exit fees you might have to pay
