

I'm often asked by those with money to invest that given the current market conditions whether it is best to invest all their money at once or whether to invest it in stages, known as dripping. If it's the latter then what is the optimum frequency i.e. monthly, quarterly or yearly.
It really is the million dollar question. A key aim of the research I publish for 80-20 Investor members is to attempt to answer these kinds of questions because they can positively influence investor returns for the rest of their DIY investing journey. So in this article I look at the returns produced by the FTSE 100 during key periods of its 30 year history.
30 years of returns
The chart below shows the total return achieved if you had invested in the FTSE 100 since 1986 (which assumes that all dividends were reinvested):
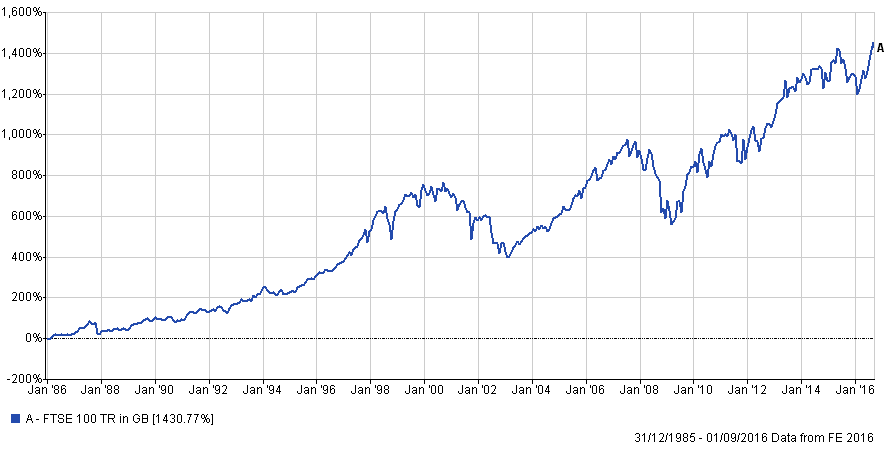
You can get a feel for the ups and downs of the market over that time. The total return is an impressive 1,400%. If instead we just focus on the share price moves (i.e. the FTSE 100 Index figure you see quoted on the news, ignoring dividends) the chart looks like this:
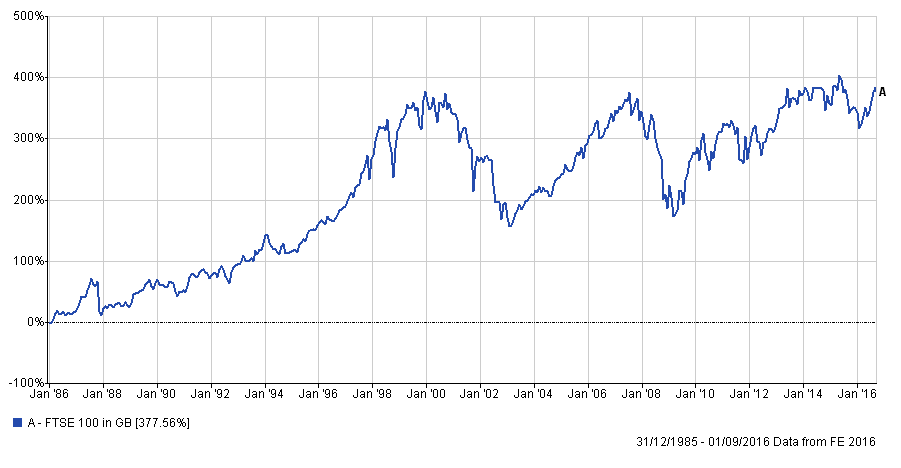
One thing to note is the huge difference reinvesting dividends has over time. The effect of compounding (1,400%) hugely outperforms the simple price movement (which returned 377%). That is why it's important that if you ever buy a tracker fund that you check it includes reinvested dividends. However, for the purposes of this piece of research the important things to note are the market highs in the second graph. News coverage only ever focuses on the second graph (the value of the FTSE 100 Index at any point) so this is what influences investors nervousness when they are deciding whether to invest all at once or drip in.
Ideally to answer the original question we would analyse the returns generated by every possible permutation of starting day, end day, drip frequency and drip period length. Of course the number of permutations is mind boggling and analysing them all is not realistic and not necessary. The theory is that because we can't time the market perfectly then a process such as dripping in is a simple and effective strategy to mitigate any downside risks. Therefore it makes sense to just focus on ascertaining the best strategy during extreme time periods for investment returns.
Market extremes
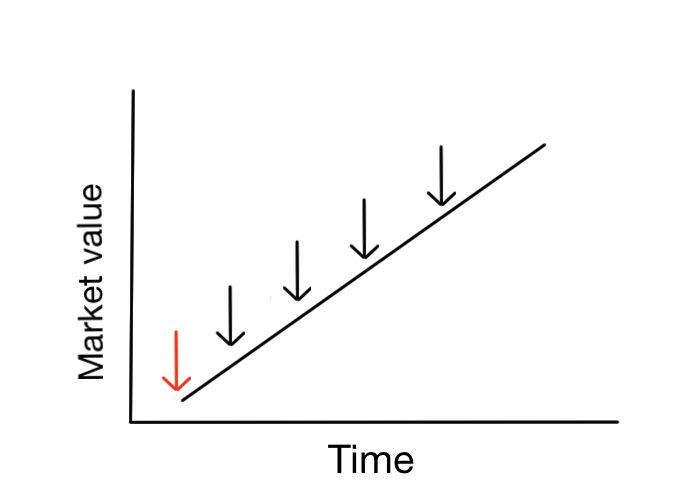
In investing it always helps to think in extremes when trying to understand something. So let's first use the extreme example that markets go up in a straight line after we decide to invest, as shown below. The red arrow is the point when a lump sum investor would invest while the black arrows are when a 'dripping' investor invests.
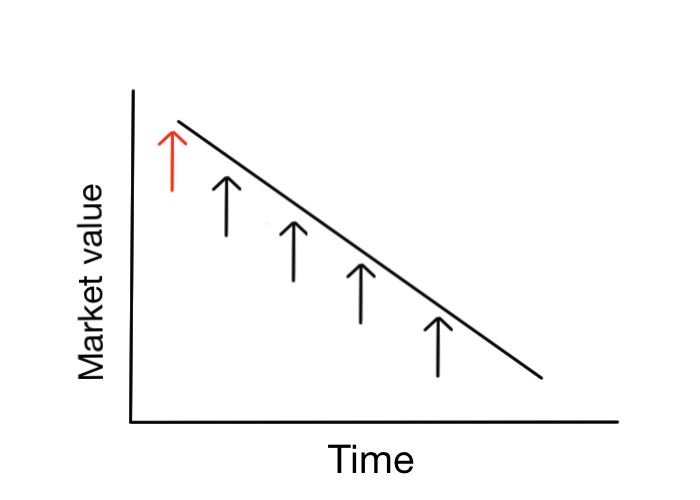
In a falling market the opposite is true, as shown by the image below. Each dripped instalment loses less and less as markets fall, plus they will make more profit if the market rebounds.
Of course real markets don't work so simply, so let's look at real life examples.
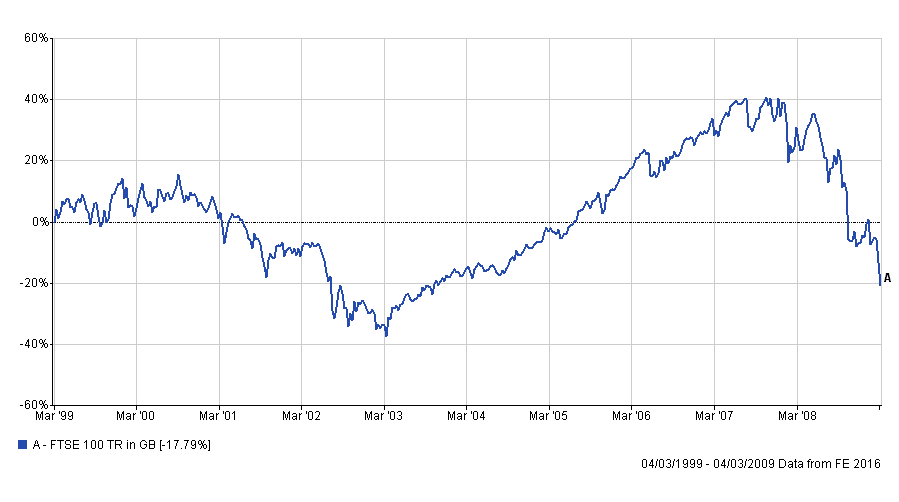
The worst ten year time frame for investing
The two charts at the start of this article show that one of the worst ten year periods for investing started just before the dotcom bubble burst. The period in question is the 10 year period following 4th March 1999 as shown by the total return chart below:
The table below shows how much money you would have made or lost by investing your money all at once or when using various dripping strategies between 4th March 1999 and 4th March 2009. The winner is in green.
| Investment strategy | Total invested | Final value |
| £12k at start | £12,000 | £9,865 |
| £1,200 a year | £12,000 | £9,995 |
| £300 every quarter | £12,000 | £9,892 |
| £100 per month | £12,000 | £9,921 |
Clearly dripping in was the best strategy but the difference was marginal given the timescale involved.
The worst five year time frame for investing
What about if you only invest for 5 years? The table below shows the returns from each strategy assuming you had invested £12,000 for the 5 years after the dotcom market peak (30th December 1999 to 29th December 2004).
| Investment strategy | Total invested | Final value |
| £12k at start | £12,000 | £9,668 |
| £2,400 a year | £12,000 | £12,370 |
| £600 every quarter | £12,000 | £12,884 |
| £200 per month | £12,000 | £12,827 |
This time the difference is huge with the lump strategy producing a loss of nearly 20% versus a profit of 7% from dripping in monthly or quarterly.
From dotcom peak to 2016
Investors are always nervous at market peaks which is why I'm asked the lump sum versus market peak question the most when markets hit new highs. So the table below shows how each strategy fared if used from the dotcom market peak until the start of 2016:
| Investment strategy | Total invested | Final value |
| £20k at start | £20,000 | £35,212 |
| £1,176 a year | £20,000 | £34,787 |
| £294 every quarter | £20,000 | £35,170 |
| £98 per month | £20,000 | £35,139 |
The difference between each strategy is marginal but the lump sum strategy wins.
It's more about time than timing
Pulling all of this together there a number of things to take away:
- if you think markets are going up then you should invest all your money up front
- if you think markets are going to fall then a drip strategy is more suitable.
However clearly a number of factors determine which strategy is ultimately successful including:
- the price you bought at
- the frequency of your investment
- the market movement
Yet the biggest factor which determines which strategy is best is the time you plan to spend invested. The shorter the time frame (i.e 5 years) the less time your portfolio has to recover from a severe market fall, as shown above. In addition the shorter your investing timeframe the greater the frequency of any drip should be, certainly in extreme market conditions. However when your investing timeframe starts to increase, even by just another 5 years, very quickly the benefits of dripping are eclipsed by the benefits of time in the market.
The only caveat to this would be if somehow you condensed the time period in which you drip to just a few months or a year (rather than across the whole period like I've assumed) and happen to catch a market fall with your last cash installment being invested at the market bottom. That's incredibly unlikely. While the research doesn't test this angle what we see is that clearly as your investment timeframe increases then the benefits of either strategy (using a lump sum or drip strategy) have a smaller and smaller impact on your eventual return. The reason for this is that the effects of compounding of reinvested dividends are what determine the lion-share of your eventual return, as demonstrated by the difference in the first two charts in this article.
The loss of compounding
Of course the research above assumes that you buy and hold the same asset, namely the FTSE 100 for the entire time you invest. There is absolutely no reason for you to do this, despite most investors doing so. The key message behind 80-20 Investor is the importance of reviewing and changing your investment strategy to suit prevailing market conditions. So in a downward equity market other assets will rise which you can invest in instead. The table below shows how someone who invested £50,000 when 80-20 Investor first launched in August 2014 would have fared assuming they bought the Best of the Best Selection versus dripping the money in monthly.
| Investment strategy | Total invested | Final value | Total return |
| £50,000 inveted in 80-20 Investor Best of the Best since inception 2 yrs ago | £50,000 | £63,958 | 27.92% |
| Monthly drip into 80-20 Investor Best of the Best | £50,000 | £58,200 | 16.40% |
| £50,000 invested in FTSE 100 two years ago | £50,000 | £54,982 | 9.96% |
| Monthly drip into FTSE 100 starting 2 years ago | £50,000 | £54,690 | 9.38% |
The point to take from this is that even with a safety first drip strategy it is still possible to comfortably outperform the market .
So to sum up if you are a long term investor the logistical problems of monthly dripping are unlikely to be worth the long term benefit. Ultimately if you are worried markets are likely to fall then the best way to mitigate the impact is actually to increase your investment timeframe (i.e be a long term investor) and review your portfolio more regularly.
The material in any email, the MonetotheMasses.com website, associated pages / channels / accounts and any other correspondence are for general information only and do not constitute investment, tax, legal or other form of advice. You should not rely on this information to make (or refrain from making) any decisions. Always obtain independent, professional advice for your own particular situation. See full Terms & Conditions and Privacy Policy
Neither MoneytotheMasses.com/80-20 Investor nor its content providers are responsible for any damages or losses arising from any use of this information. Past performance is no guarantee of future results.
Funds invest in shares, bonds, and other financial instruments and are by their nature speculative and can be volatile. You should never invest more than you can safely afford to lose. The value of your investment can go down as well as up so you may get back less than you originally invested.
Information provided by MoneytotheMasses.com/80-20 Investor is for general information only and not intended to be relied upon by readers in making (or not making) specific investment decisions.
Appropriate independent advice should be obtained before making any such decisions. Leadenhall Learning (owner of MoneytotheMasses.com/80-20 Investor) and its staff do not accept liability for any loss suffered by readers as a result of any such decisions.
The tables and graphs are derived from data supplied by Trustnet. All rights Reserved.

£200 Pension Cashback Offer
Make a qualifying deposit or transfer a pension to our partner Interactive Investor.
- Deposit or transfer a pension of at least £20k and you could earn £200 cashback
- Terms and Fees apply, Capital at risk
- New & Existing customers opening a SIPP
- Offer ends 30th June 2026
Before starting your transfer, check you won't lose any valuable benefits (such as guaranteed annuity rates or a lower protected pension age) and find out what exit fees you might have to pay
