

If you read my recent weekly newsletter you will be aware of the importance of bond duration. I ended my commentary by saying that when/if the bond market unravels further then the 80-20 Investor algorithm will inevitably highlight those funds worth looking at.
I also pointed out that bond funds with long durations will get hammered if the bond market sell-off intensifies. The answer would be to look to hold bond funds with shorter durations. However, this is easier said than done as I've yet to come across duration data available either publicly or via a paid subscription. The reason is because the fund managers don't always release this data.
Over the weekend I pondered this problem posed in my newsletter and was compelled to come up with a research solution to uncover those funds with short duration (or indeed long duration).
How to solve a problem like bond duration
Given that October has been a month where duration has been a key driver of bond returns one idea would be to simply rank all bond funds by their level of return for the month of October. The idea is that those with the highest returns would likely have a low duration while those which have lost the most money will have the longest duration.
The fly in the ointment is that duration isn't the only driver of bond returns. Others include supply and demand, credit risk (i.e the risk that the bond issuer may go bust), interest rate moves, the level of coupon paid and occasionally currency moves.
The trouble is that it is difficult to tell which factor is driving returns at a given point. For example sterling plummeted by as much as 5% against the dollar in October which would boost the returns of global bond funds. Therefore I introduced and calculated another factor to help me, namely the correlation of every bond fund to a known short duration bond fund.
Correlation is a statistical measure that shows the degree to which two things move in relation to each other. If two things have a correlation coefficient of 1 then they move in tandem. If the correlation coefficient is -1 then they move in opposite directions. If the correlation is 0 then they move independently of one another. It follows that a correlation coefficient can only run from -1 to 1.
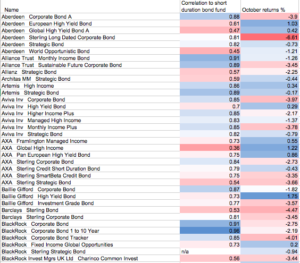
So the table below shows every UK Corporate bond fund , UK Strategic bond fund and UK High Yield bond fund alongside their correlation coefficient over the last 6 months to a short dated bond fund benchmark (namely the M&G - Short Dated Corporate Bond fund) as well as their total return for the month of October. Both columns are colour coded (in the same way as our heatmaps) with red showing a low correlation to short dated bonds as well as poor performance for the month of October. To put it simply blue is good and red is bad for both columns.
Now the analysis is not a crystal ball nor a definitive answer to the problem of determining a bond fund's duration. However if a fund has shown a high correlation to a short duration bond fund over the last six months and has also performed strongly in October (a month when duration gained greater influence) then it's worth further consideration as part of a short duration bond portfolio.
The table enables you to quickly dismiss those funds most likely to perform badly in a bond bear market while highlighting those that are likely to fare better. If you find a bond fund which ticks both boxes then find its fund factsheet via your chosen investment platform to see what might explain the figures quoted. In particular, source the fund manager's recent comments (via Google) on how they are managing bond duration. A good example is Artemis Strategic Bond where my table shows blue for each metrics. My analysis is validated by the latest fund manager commentary from Artemis' James Foster in which he states he deliberately reduced his duration in September.
Likewise it's interesting to see funds such as Aberdeen European High Yield and Invesco Perpetual Monthly Income Plus pass the % return test but fail the correlation test. That's because the former's returns would have been boosted by currency moves while the latter benefited from its equity content. Finally you will notice that the Barclays Sterling Bond fund doesn't fare well under either measure so I anticipate it being dropped from November's Best of the Best Selection and ultimately my £50,000 portfolio.
Table
If you click the image you will download the full table as an excel file

The material in any email, the MonetotheMasses.com website, associated pages / channels / accounts and any other correspondence are for general information only and do not constitute investment, tax, legal or other form of advice. You should not rely on this information to make (or refrain from making) any decisions. Always obtain independent, professional advice for your own particular situation. See full Terms & Conditions and Privacy Policy
Neither MoneytotheMasses.com/80-20 Investor nor its content providers are responsible for any damages or losses arising from any use of this information. Past performance is no guarantee of future results.
Funds invest in shares, bonds, and other financial instruments and are by their nature speculative and can be volatile. You should never invest more than you can safely afford to lose. The value of your investment can go down as well as up so you may get back less than you originally invested.
Information provided by MoneytotheMasses.com/80-20 Investor is for general information only and not intended to be relied upon by readers in making (or not making) specific investment decisions.
Appropriate independent advice should be obtained before making any such decisions. Leadenhall Learning (owner of MoneytotheMasses.com/80-20 Investor) and its staff do not accept liability for any loss suffered by readers as a result of any such decisions.
The tables and graphs are derived from data supplied by Trustnet. All rights Reserved.

£200 Pension Cashback Offer
Make a qualifying deposit or transfer a pension to our partner Interactive Investor.
- Deposit or transfer a pension of at least £20k and you could earn £200 cashback
- Terms and Fees apply, Capital at risk
- New & Existing customers opening a SIPP
- Offer ends 31st July 2026
Before starting your transfer, check you won't lose any valuable benefits (such as guaranteed annuity rates or a lower protected pension age) and find out what exit fees you might have to pay
