

Much of the mainstream investment press gets bogged down with the active fund versus passive fund debate. As you will no doubt be aware, there has been plenty of research published to show that active fund managers as a group don't tend to beat the market over the long-term. Of course that therefore means they seldom outperform passive tracker funds over the long term either.
That is because there is a tendency for many active fund managers to closely track their benchmarks and their peers from within the same sector. This herding instinct is largely driven by a fund manager's desire to preserve their job. Underperform and you might lose your job, but stick with the herd and you should hopefully survive. Outperformance is desirable but not necessary if job security is important to you. Obviously this closet tracking is a problem if you invest in such a fund as you are essentially paying over the odds for a fund that by nature of its charges, is going to underperform the market.
However individual active fund managers can and do outperform their passive peers over short time intervals and occasionally over longer time periods. Those fund managers that have managed to genuinely outperform the market, over a given timeframe, usually plough their own furrow, when compared to the wider market or peers, and back their convictions by investing in a concentrated portfolio of shares. It does however mean that if their convictions prove ill-judged then they could significantly underperform their peers.
Of course it is important to highlight that there is no rule that says you have to buy and hold one fund indefinitely, be it actively managed or passively managed. That is why you will find that 80-20 Investor does not discriminate against active or passive funds. Indeed I've held both within my own £50,000 portfolio, instead preferring to invest in what is working (active or passive). It is worth reading my article "Active vs Passive funds… breaking the mould", which highlights how 2022 was a year that rewarded those managers that backed their convictions.
The key to diversifying a portfolio is to ensure that you invest in a range of assets and funds that perform differently in different environments. If you hold more than one fund that invests in a given asset type (i.e. UK equities) it is preferable that they don't invest and behave in the same way. It follows therefore that if you hold too many funds from the same sector that the diversification benefits dimmish. Read my previous research article "Diversification dilemma: How many funds should you buy per sector?" for insights on this topic.
But that piece of research focused on how many funds (chosen at almost random) would it take before diversification benefits are lost. So instead, how do you go about finding those equity fund managers that are doing something different from the crowd of mediocrity and closet tracker funds? Funds that might be useful to diversify your portfolio or be included if you want to back a certain theme, trend or equity sector. That is what I answer in this research article.
How to find funds backing their convictions
So how do you find equity funds that have conviction and that are doing something different? There are a number of ways.
Analyse past performance
One way is to analyse fund performance over discrete time periods. However this has its limitations. For example, if you analyse the performance of funds during 2022, you are likely to identify those equity funds that have deliberately avoided exposure to technology stocks and/or had increased exposure to energy stocks. But there are also other drivers too that will have contributed to any outperformance or underperformance. To identify funds that are doing something different it would require you to analyse performance over lots and lots of different time periods, which are determined by macro events or the performance of key markets or sectors during the designated time periods. That works if you know what you are looking for (i.e. funds that might perform well if we have a recession) but not if you are trying to build a shortlist of funds that are genuinely run in an active way, that may do something different to the funds you already hold.
Active share
Another way to find conviction funds is by looking at Active Share. Active Share is a measure of the disparity between the holdings in a fund or portfolio and the index or benchmark that's associated with it.
The Active Share calculation works by comparing a fund's asset allocation to that of its benchmark or peer group average, finding the total of the absolute difference in allocation for each holding and then halving it. Here is an example of how you can calculate Active Share.
| Fund A % allocation | Benchmark % allocation | Absolute difference | |
| Company A shares | 80% | 50% | 30% |
| Company B shares | 10% | 50% | 40% |
| Company C shares | 10% | 0% | 10% |
| Total | 100% | 100% | 80% |
Therefore the Active Share measure for Fund A is 1/2 x (30% + 40% + 10%) = 40%
Using the summary table below you can use Active Share to see that Fund A is a closet tracker fund (i.e you are paying for a fund that is essentially tracking a benchmark). It would therefore be cheaper and more profitable to instead invest in a tracker fund that tracks the benchmark instead.
| Active Share | Type of fund |
| Passive fund | 0-20% |
| Closet tracker fund | 20-60% |
| Actively managed fund | 60-100% |
Unfortunately it is difficult to calculate Active Share for a fund because funds don't often publicise all of their holdings or those of their benchmarks. Also the measure is not widely calculated on investment research sites or platforms, although if you search for a fund on Morningstar and then click on the 'Portfolio' tab you sometimes find an Active Share figure there.
Tracking error
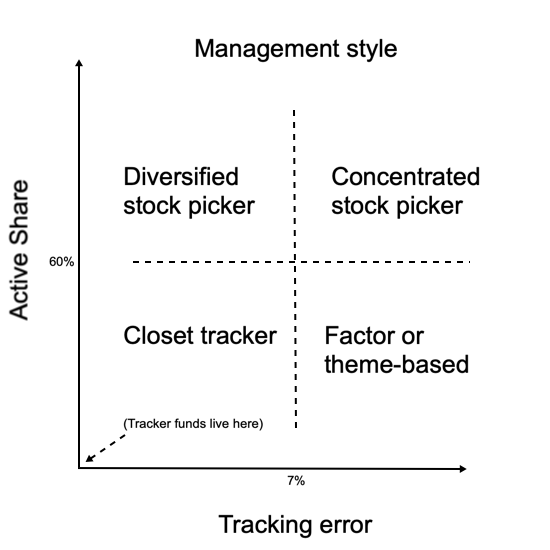
Tracking error is a statistical measure of the difference between a fund's performance and that of its benchmark over a given time period. This can be a simple absolute difference calculation but often involves calculations including standard deviation. The higher a fund's tracking error, the greater the variability in its performance vs its benchmark or peer group average over time. So it can be a useful measure of whether a fund is following the manager's convictions rather than following the herd.
One thing to bear in mind, just because the tracking error is high, it doesn't necessarily mean that the fund manager is actively doing something different. It could mean that the benchmark that they're being compared against is not suitable. Interestingly the tracking error can also be used in conjunction with the Active Share value for a fund to help understand further the fund manager's investment style as shown in the image below. A good example is Fundsmith Equity run by Terry Smith, which has an active share of 86% and a tracking error of over 7% for the last 12 months and the last 3 years. That puts it in the concentrated stock picker group. The fund has outperformed its peers over the longer term because the manager's convictions have been justified, however over the last year the fund has underperformed its peers as the manager's bets on technology stocks have finally proved a drag on performance.
However, r-squared and tracking error (like Active Share) are not often published by funds or available online.
Number of stock holdings
Another piece of information to consider is the number of holdings that a fund has in order to determine whether a fund manager is backing their convictions (i.e a concentrated stock picker). Again, the number of holdings in a fund are not always readily available but I have managed to analyse the data that is out there to produce a median number of stocks held by a typical fund from each of the seven unit trust sectors I've looked at.
| Unit trust sector | Median number companies a fund invests in |
| Asia ex Japan | 60 |
| Europe ex UK | 32 |
| Global | 47 |
| Global Equity Income | 67 |
| North America | 55 |
| UK All Companies | 30 |
| UK Equity Income | 54 |
So if you are able find the number of holdings for a fund that you are researching, if it is significantly lower than the relevant number above relating to its sector then it suggests that the manager is running a concentrated portfolio. Perhaps unsurprisingly, Fundsmith Equity (in the Global sector), mentioned in the previous section, only invests in the shares of 27 companies. The number of holdings for a fund can occasionally be found on the fund's factsheet or possibly via the investment platform you use.
Portfolio concentration
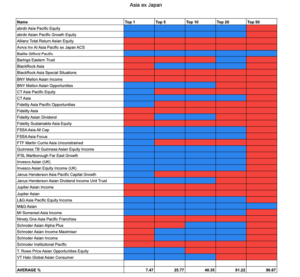
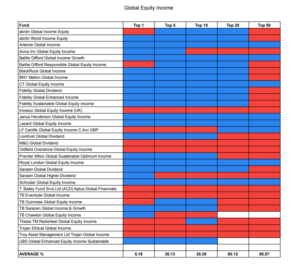
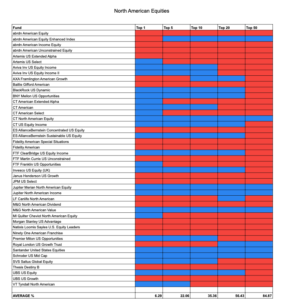
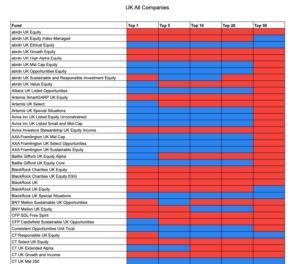
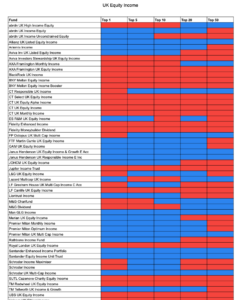
So it is possible to use all the above information to try and discern funds that are doing something different. But, as I've pointed out, obtaining the relevant information mentioned can be tricky. So I have instead produced 7 heatmaps to highlight funds that are running more concentrated portfolios, so backing their manager's convictions. The heatmaps below have been produced for 7 equity fund sectors by removing tracker funds as well as multi-manager/ funds of funds. 'Funds of funds' are funds that invest in other unit trusts. So while they may state they only have 10 holdings, those 10 holdings are in fact other funds that could invest in hundreds of companies.
If you click on any of the images you will download a pdf of the table for that sector. At the foot of the table you will find a summary of what percentage of a fund's total assets the top 1, top 5, top 10, top 20 and top 50 holdings typically account for. Then for each fund, where their top holdings account for more than the average for that type of fund it is coloured red, while a blue box indicates that the fund's top holdings account for less than is typical for this type of fund. So to give an example, on the Asia ex Japan table, the Allianz Total Return Asian Equity fund is red across the board suggesting that the manager is backing their convictions (by investing a larger portion of their assets in few companies) when compared to their peers. This then allows you to go look at the fund on your platform of choice or a site such as Morningstar or the fund factsheet itself to see where the manager is investing their money at a company and sector level. You can also then research some of the earlier statistics (such as Active Share) to confirm your suspicions. In this instance the Active Share is 68% while the number of holdings is 66 (which is close to the peer group median). So from this it would be worth looking at how the fund is invested and its past performance, as while it is more concentrated than its peer group average, it is only marginally so.
If you had started with the global heatmap you would have quickly discerned that Fundsmith Equity looks to be a concentrated portfolio (as it has a lot of red). You could then source the factsheet where you would learn that the fund has only 27 holdings and an Active Share of 86% (as mentioned earlier). You could then look at the fund's sector mix and look at its recent periods of performance and underperformance to discern when the fund is likely to outperform or underperform in the future and what sort of bias it would bring to your portfolio. You will notice that some fund names are coloured in yellow, such as Fundsmith equity as these are funds that I have been able to confirm invest in less than 30 holdings. Just because a fund is not yellow, does not mean that the number of holdings is greater than 30, but just that I have not been able to establish that from the data sources I have used.
Asia ex Japan

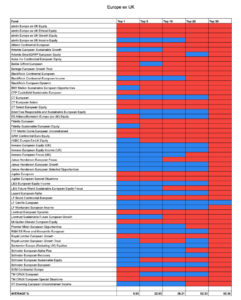
Europe ex UK

Global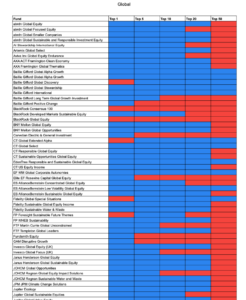

Global Equity Income

North America

UK All Companies

UK Equity Income

£200 Pension Cashback Offer
Make a qualifying deposit or transfer a pension to our partner Interactive Investor.
- Deposit or transfer a pension of at least £20k and you could earn £200 cashback
- Terms and Fees apply, Capital at risk
- New & Existing customers opening a SIPP
- Offer ends 31st July 2026
Before starting your transfer, check you won't lose any valuable benefits (such as guaranteed annuity rates or a lower protected pension age) and find out what exit fees you might have to pay
