

Whenever the stock market hits a new all-time high investors and analysts become increasingly concerned about the increased likelihood of a correction (a 10% fall). But are these fears unfounded? How has the stock market historically behaved at previous all-time highs?
So I decided to carry out extensive research into the subject exclusively for 80-20 Investor members. Right now the US stock market remains the leading bellwether for global stocks, particularly as it continues to test new all-time highs. So for the purposes of this research I analysed every daily move in the S&P 500 since January 1950. That's over 17,500 trading days!
How markets have historical responded to new all-time highs
Since January 1950 the S&P 500 has set 1,260 new all-time highs. So how has the market behaved after it has set one of these all-time highs?
Statistically, the odds that any given day on the S&P 500 will close higher than the previous day (i.e. the chance that tomorrow is higher than today) is not 50-50 as you might expect but 53%. Logically this does make sense because share prices do tend to have an upside bias over time, if only as a result of inflation. But now we can quantify it. Stock markets are evidently inherently optimistic.
But what about after a day when a new all-time high is set? After crunching the numbers the odds of a new all-time high coming a day after a previous new-all time high is 55.4%. From now on I will use the acronym ATH in place of 'all-time high'. 55.4% may not sound significant but it is statistically significant.
We can say with 96% certainty that the market is 5% more likely to close higher the day after a new all-time high than after a normal day. In doing so it will, of course, set another new all-time high.
But conversely, this means that the stock market is also statistically less likely to crash the day after a new ATH than on a normal trading day.
How long does it take the market to set another new all-time high?
To answer this I identified every ATH since January 1950 and then counted the number of trading days between each. The table below summarises the results and shows the number of occasions when the timespan between new ATHs equalled a certain number of trading days.
|
Number of trading days between successive ATHs
|
Number of occurrences
|
| 1 | 698 |
| 2 | 171 |
| 3 | 74 |
| 4 | 49 |
| 5 | 29 |
| 6 | 15 |
| 7 | 18 |
| 8 | 18 |
| 9 | 15 |
| 10 | 10 |
| 11 | 8 |
| 12 | 6 |
| 13 | 9 |
| 14 | 9 |
| 15 | 3 |
| 16 | 8 |
| 17 | 2 |
| 18 | 3 |
| 19 | 6 |
| 20 | 4 |
| 21 | 4 |
| 23 | 2 |
| 24 | 4 |
| 25 | 4 |
| 26 | 1 |
| 27 | 4 |
| 28 | 3 |
| 29 | 4 |
| 30 | 2 |
| 31 | 6 |
| 32 | 2 |
| 33 | 2 |
| 35 | 3 |
| 36 | 2 |
| 38 | 3 |
| 40 | 2 |
| 42 | 1 |
| 43 | 1 |
| 44 | 1 |
| 46 | 1 |
| 47 | 1 |
| 48 | 1 |
| 49 | 4 |
| 50 | 1 |
| 53 | 3 |
| 55 | 2 |
| 56 | 2 |
| 58 | 1 |
| 62 | 1 |
| 63 | 2 |
| 69 | 1 |
| 72 | 1 |
| 75 | 1 |
| 76 | 1 |
| 77 | 2 |
| 80 | 1 |
| 81 | 2 |
| 86 | 1 |
| 90 | 1 |
| 94 | 1 |
| 108 | 1 |
| 113 | 1 |
| 136 | 1 |
| 138 | 1 |
| 146 | 2 |
| 147 | 1 |
| 148 | 1 |
| 160 | 1 |
| 260 | 1 |
| 286 | 1 |
| 297 | 1 |
| 310 | 1 |
| 324 | 1 |
| 375 | 1 |
| 434 | 1 |
| 485 | 1 |
| 488 | 1 |
| 540 | 1 |
| 820 | 1 |
| 1376 | 1 |
| 1803 | 1 |
| 1898 | 1 |
| Grand Total | 1260 |
As you can see you are much more likely to get a new ATH immediately after an existing ATH than any other time period (based on the mode and median). In fact, 55% of all ATHs come the day after a previous ATH. While 80% of new ATHs come within 5 trading days (i.e. a week) of a previous ATH. But...
The average number of trading days between successive all-time highs is 13.89 days.
All-time highs are getting closer over time
The table below shows the average number of trading days between successive ATHs for different time periods.
| Time period | Average number of trading days between ATHs |
| Last 10 years | 13.55 |
| Last 20 years | 20.90 |
| Last 30 years | 14.49 |
| Last 40 years | 16.05 |
| Since 1950 | 13.89 |
As you can see the frequency of new ATHs is not consistent and the flow of cheap money into the stock market, via interest rate cuts and quantitative easing, has increased the frequency of new ATHs.
What are the odds that a 10% correction occurs after an all-time high?
When the market hits a new ATH investment commentators often start talking up the prospect of an imminent correction (a fall of at least 10% from the high point). Some investors become convinced that an overnight crash is on the cards but how likely is that in reality?
To answer these questions I analysed every time the S&P 500 fell 10% from a new ATH and then measured how many days it took to get there.
On only 23 occasions after an ATH did the market then fall by 10% or more, rather than set another new ATH. That means that the chance of the market entering a correctional phase (which could last decades) rather than set another ATH is just 23/1260 = 1.8%. That shows just how bullish a move a new ATH is.
You are 55 times more likely to have another all-time high after a new all-time high than a 10% correction.
How soon does a 10% correction occur after an all-time high?
Again crunching the numbers the average number of trading days it takes a falling market to fall by 10% from an ATH is 65 trading days, just over three months. At the end of 2018 it took 45 trading days for the S&P 500 to break 10% below the ATH set in September. However, it rebounded a day later. Interestingly the real damage was done after the 60th trading day (i.e in December). So it fits the pattern that historically market corrections take longer than you think, they don't happen overnight.
But in 2018 we also saw the shortest ever gap between an ATH and a 10% correction, at just 9 trading days!.
In fact this is actually indicative of a growing trend that corrections after ATHs are becoming much more aggressive, even though they are happening less frequently as shown in the chart below.
| Average number of trading days since ATH for the market to fall 10% or more | Number of post-ATH corrections | |
| Since records began | 65.17 | 23 |
| In last 10 years | 39.67 | 3 |
| In last 20 years | 36.50 | 6 |
| In last 30 years | 35.50 | 10 |
| In last 40 years | 51.50 | 13 |
Again the reason for this unfolding trend most likely lies in the wave of accommodative monetary policy from global central banks that we've seen over the last 10 years. While monetary policy is pushing markets higher it is also increasing the risk of tantrums (with severe corrections), such as the one we saw in 2018 when the market grew concerned that central banks were starting to tighten monetary policy.
When corrections occur how long does it take to set a new all-time high?
As mentioned earlier there have been 23 corrections of 10% or more following a new ATH. But how long did those corrections last? Don't forget after the dotcom bubble burst in the year 2000 the S&P 500 didn't hit another new ATH until May 2007. During that time the index fell by over 45% from the March 2000 high.
The table below shows what happened on each occasion after we saw a 10% correction from a new all-time high.
| New ATH before correction phase | Date market entered 10%+ correction phase | Date rallied back to a new ATH |
Number of days from entering correction until a new ATH
|
| 12-Jun-1950 | 29-Jun-1950 | 22-Sep-1950 | 59 |
| 5-Jan-1953 | 9-Jun-1953 | 11-Mar-1954 | 189 |
| 23-Sep-1955 | 11-Oct-1955 | 14-Nov-1955 | 23 |
| 2-Aug-1956 | 21-Nov-1956 | 24-Sep-1958 | 463 |
| 3-Aug-1959 | 4-Mar-1960 | 27-Jan-1961 | 227 |
| 12-Dec-1961 | 30-Apr-1962 | 3-Sep-1963 | 339 |
| 9-Feb-1966 | 16-May-1966 | 4-May-1967 | 244 |
| 25-Sep-1967 | 5-Mar-1968 | 29-Apr-1968 | 38 |
| 29-Nov-1968 | 19-Jun-1969 | 6-Mar-1972 | 686 |
| 11-Jan-1973 | 27-Apr-1973 | 17-Jul-1980 | 1825 |
| 28-Nov-1980 | 24-Aug-1981 | 3-Nov-1982 | 303 |
| 10-Oct-1983 | 13-Feb-1984 | 21-Jan-1985 | 237 |
| 25-Aug-1987 | 15-Oct-1987 | 26-Jul-1989 | 449 |
| 9-Oct-1989 | 30-Jan-1990 | 29-May-1990 | 82 |
| 16-Jul-1990 | 17-Aug-1990 | 13-Feb-1991 | 124 |
| 7-Oct-1997 | 27-Oct-1997 | 5-Dec-1997 | 29 |
| 17-Jul-1998 | 14-Aug-1998 | 23-Nov-1998 | 70 |
| 16-Jul-1999 | 29-Sep-1999 | 16-Nov-1999 | 34 |
| 24-Mar-2000 | 14-Apr-2000 | 30-May-2007 | 1788 |
| 9-Oct-2007 | 26-Nov-2007 | 28-Mar-2013 | 1343 |
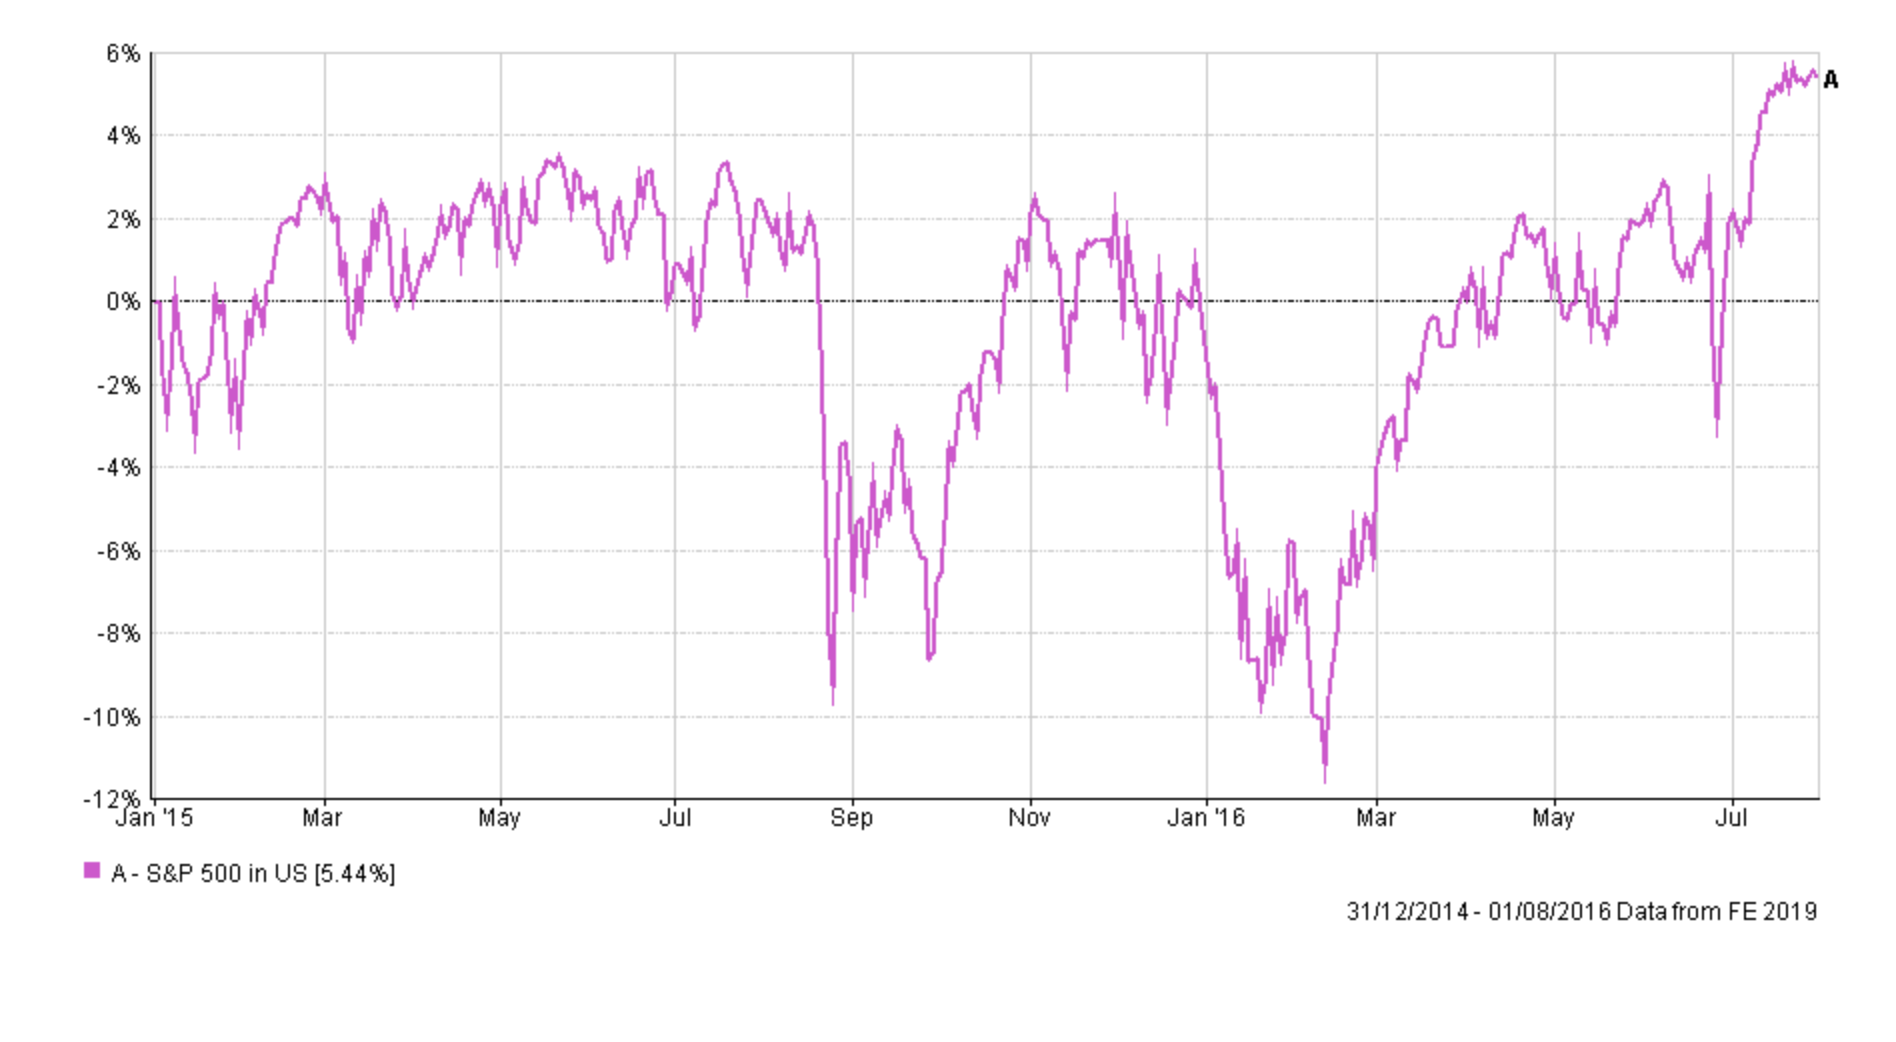
| 21-May-2015 | 24-Aug-2015 | 11-Jul-2016 | 221 |
| 26-Jan-2018 | 8-Feb-2018 | 24-Aug-2018 | 137 |
| 20-Sep-2018 | 23-Nov-2018 | 23-Apr-2019 | 101 |
On average it took the market 391 trading days to set a new ATH. But this figure is heavily skewed by what happened after the dotcom bubble burst and the fall out of the financial crisis. If instead we look at the median, (i.e. the mid point of the range) then the answer is 221 trading days which works out at approximately 11 months. We tend to get a lot of retests and failed breakouts along the way to this new ATH as shown in the chart below.
Summary
So to sum this all up:
- New all-time highs are actually very bullish moves from stock markets (they should be welcomed not feared)
- Failure to set a new all-time high is clearly not a good sign (as seen in the chart above) and explains why technical analysts are obsessed with such moves (i.e double tops)
- 55% of new all-time highs come the day after a previous one
- 80% of new all-time highs occur within a week of a previous one
- after a new all-time high you are over 50 times more likely to see another all-time high than a 10% correction
- 10% corrections after new all-time highs tend to happen over longer time spans with the average time span being 65 trading days (it's as if the market needs convincing that the party is finally over)
- the longer you go without a new ATH the less bullish the sign
- loose central bank policy has massively distorted markets, increasing the frequency of all-time highs, while reducing the number of corrections and their length
- However the severity (the speed at which the corrections play out) has increased
Ultimately this explains why the 'buy the dip' and 'don't fight the Fed' investment mantras have been so successful and prevalent since the financial crisis. History tells us that all-time highs are in fact a good thing, especially from a momentum perspective and especially when central banks seem hellbent on creating more and more of them.

£200 Pension Cashback Offer
Make a qualifying deposit or transfer a pension to our partner Interactive Investor.
- Deposit or transfer a pension of at least £20k and you could earn £200 cashback
- Terms and Fees apply, Capital at risk
- New & Existing customers opening a SIPP
- Offer ends 31st July 2026
Before starting your transfer, check you won't lose any valuable benefits (such as guaranteed annuity rates or a lower protected pension age) and find out what exit fees you might have to pay
