

If you are looking to invest using funds there are broadly two types which you can choose from, namely active funds (those that are run by a manager) and passive funds (those that track indices). As you know, there is a lot of debate around which is the better strategy to adopt. However, every research white paper I've studied which claims that one methodology is better than the other always starts with one flawed assumption. That assumption is that you have to buy and hold a fund almost indefinitely. Investors can boost their returns by regularly reviewing their investments and making changes where appropriate, they certainly should not buy and hold indefinitely. This is a core finding of the research behind 80-20 Investor. Of course both strategies (active or passive) have their place and will outperform one another at different times. In effect every dog has its day.
80-20 Investor doesn't distinguish between active and passive strategies. In short, 80-20 Investor will highlight those funds performing well in the current environment that may continue to perform well in the near future. Whether they are active or passive funds is irrelevant. The 80-20 Investor fund shortlists will often contain both active and passive funds as too does my own £50,000 portfolio.
There is no disputing that very few fund managers consistently outperform over the long term. Yet passive investing advocates (who usually are the providers of passive funds) suggest that if a fund manager does outperform over an extended period of time it is down to pure luck. These claims have received more airtime again following Vanguard's recent platform launch, which sells Vanguard's passive funds directly to consumers.
So is fund manager performance just down to pure luck? I've not seen any evidence to prove this claim either way. So I decided to explore the idea myself.
To do this I decided to look at the investment sector with the largest number of funds, namely the UK All Companies unit trust sector. This also happens to be the sector that has some of the longest running funds. At present there are 231 funds in the UK All Companies sector which is a pretty decent sample size. Of those, 209 have been in existence for at least five years.
So let's assume that we lined all 209 fund managers against a wall. The chance of any one of them outperforming the median of their peers is 50%. Or in other words the chance of them being in the top half of managers based on their one year performance is 1 in 2. That's because we are considering the median which is the middle point. So let's say the median performance of the UK All Companies sector is 2.5%. That would mean half of the managers made more than 2.5% that year while half of them made less than that.
So we are ignoring the actual percentage return each manager makes in a year, we are looking at his/her performance relative to his/her peers. Consistency is what we are after. So let's assume that the 209 fund managers threw darts at a list of shares and invested according to where the darts landed then they would have a 50% chance of appearing in the top half of managers (in terms of performance) at the end of the year. From 209 fund managers 104 would beat the median return based on pure chance.
Now let's say that we repeat the exercise every year for 5 years. If a manager's stock picking was truly random then the chance of a fund manager appearing in the top half of the fund manager league table in all of the 5 years would be 1/2 x 1/2 x 1/2 x 1/2 x 1/2 = 1/32
Or in other words from 209 fund managers the number of managers that you'd expect to achieve this feat of relative outperformance versus their peers (which collectively we assume is the market) is 209 / 32 = 6.5
We will call that 7 for simplicity.
When I analysed every fund's relative performance over the last 5 discrete years 21 funds achieved that feat. I've listed the funds below alongside the fund manager tenure, which I will come back to later.
| Name | Fund Manager Since | OCF (total annual charge %) |
| Aberdeen - UK Mid Cap Equity | 01/02/1982 | 0.86 |
| Artemis - Capital | 01/07/2010 | 0.92 |
| Artemis - UK Select | 31/12/2015 | 0.83 |
| Barclays - UK Lower Cap | 01/10/2013 | 1.35 |
| Barclays - UK Opportunities | 01/10/2013 | 1.2 |
| CFP - SDL UK Buffettology | 28/03/2011 | 1.86 |
| EdenTree - UK Equity Growth | 01/09/2015 | 0.79 |
| Fidelity - Special Situations | 01/01/2014 | 0.94 |
| Franklin - UK Managers' Focus | 01/09/2006 | 0.83 |
| Franklin - UK Mid Cap | 01/02/2006 | 0.82 |
| JPM - UK Dynamic | 31/03/2007 | 1.68 |
| JPM - UK Equity Growth | 01/05/2010 | 1.68 |
| Liontrust - Special Situations | 10/11/2005 | 0.87 |
| Liontrust - Sustainable Future UK Growth | 01/05/2005 | 0.85 |
| Liontrust - UK Ethical | 01/12/2000 | 0.81 |
| Old Mutual - UK Mid Cap | ||
| Premier - Ethical | 23/11/2009 | 0.92 |
| Royal London - Sustainable Leaders Trust | 03/11/2003 | 0.77 |
| Schroder - Charity Equity | 18/05/2010 | 0.62 |
| Standard Life Investments - UK Ethical | 01/06/2004 | 0.9 |
| Wise Investments - Evenlode Income | 19/10/2009 | 0.95 |
The number of funds is statistically signifiant given that we expected to see just 7 funds. Now appearing in the top half in a given year isn't a particularly tough benchmark, but to consistently do it is. I decided to take things one stage further and raised the benchmark. I wanted to see what would happen if rather than finish in the top half of the fund manager league table every year, for five consecutive years, they had to end up in the top third. The odds of doing so on luck alone are 1/3 to the power of 5 = 1/243.
Or in other words from my sample no manager should do it, or at best one fund might. In fact 3 funds managed that feat. They are:
- Barclays - UK Lower Cap
- Premier - Ethical
- Royal London - Sustainable Leaders Trust
Now some might level the argument that outperforming their peers is one thing but if they underperform the market (the FTSE All Share is the typical benchmark for a UK All Companies fund) than all this is irrelevant. However all three funds comfortably beat the FTSE All Share every year. They also beat their own respective benchmarks. Luck alone is unlikely to be the reason.
So what is it that these 'lucky' managers did to outperform?
Let's return to the first list based upon finishing in the top half of fund managers each year. A piece of research I've previously seen published about fund manager performance suggested that fund manager tenure (the length of time a manager has run a fund) is a contributing factor to outperformance. Or in other words the longer a fund manager's tenure the more his/her performance is likely to be down to skill rather than luck.
One thing to note in my table of lucky/skilled managers is that the majority of the fund managers have had a tenure of at least 3 years. But that still means that the fund manager has changed during the period of outperformance.
The other issue is that if tenure was to be of any use at choosing funds to outperform in the future then we'd need to look at the tenure at the start of the 5 year period I've analysed, not at the end of it. In fact only 8 managers who stayed the course had a tenure of over 5 years at the start of the timeframe I've analysed.
What about bad luck?
The other thing to ponder is that if performance was all down to luck then it should follow that consistent underperformers are just unlucky. The chance of a fund consistently being unlucky and finishing in the bottom half of the fund league tables for five consecutive years is again 1 in 32. So we'd expect 7 such unlucky managers. In fact there are 17 of them which I've listed below. Again, a statistically signifiant number.
| Name | Fund Manager Since | OCF (total annual charge %) |
| Architas MM - UK Equity | 01/02/2013 | 1.89 |
| CF - IM UK Growth | 21/04/2011 | 0.89 |
| Family - Asset | 01/05/2012 | 1.06 |
| Family - Charities Ethical | 01/05/2012 | 1.51 |
| FP - Matterley Equity | 01/04/2015 | 1.52 |
| GAM - MP UK Equity | 01/01/2013 | 2.21 |
| Halifax - UK FTSE 100 Index Tracking | 01/04/2005 | 1.05 |
| Halifax - UK FTSE All Share Index Tracker | 01/04/2005 | 1.03 |
| Halifax - UK Growth | 30/09/2007 | 1.38 |
| Henderson Inst - UK Equity Tracker Trust | 14/04/2000 | 1.04 |
| L&G - (A&L) Capital Growth | 30/09/2013 | 1.43 |
| Marks & Spencer - UK 100 Companies | 01/09/2007 | 0.6 |
| Sarasin - Fund for Charities - Thematic UK Equity | 01/01/2015 | 0.94 |
| Sarasin - UK Equity | 01/01/2015 | 0.97 |
| Scottish Widows - UK Growth | 01/11/2012 | 1.61 |
| Standard Life Investments - UK Equity Growth | 01/05/2004 | 0.9 |
| Virgin - UK Index Tracking | 27/06/2006 | 1 |
Interestingly a similar proportion of the unlucky managers had a 5 years or more tenure at the start of the timeframe analysed as for the lucky managers.
So what differentiates the lucky (skilled) from the unlucky (unskilled) managers?
There are so many factors that we could analyse along with an equally mind-boggling combination of them. But if you look at the lucky vs the unlucky funds there are some interesting traits. For example:
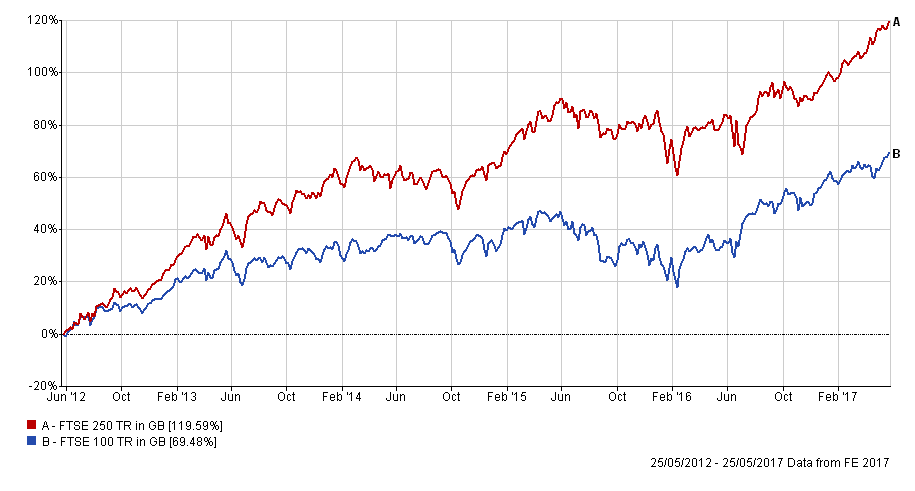
- the lucky have tended to have a small companies bias
- the unlucky include a significant number of passive funds (trackers)
If there was a time to have a small/mid cap bias then it was in the last 5 years, as shown by the chart below. So were those managers just lucky to have things go their way given their mid cap constrained investment mandate?
However, there is one factor which does separate those who make their own luck (the lucky) from those that don't (the unlucky) and that's the total annual fund charge (the OCF). Quite helpfully the median OCF for UK All Companies funds is exactly 1%. Now 71% of the lucky funds charge less than 1% a year. If you look at the unlucky funds then only 33% charge under 1% a year. So it is almost the opposite relationship.
If you pull all this together there are certain lessons to be learned. Firstly:
- 90% of funds (those outside of my lucky list) don't show any level of consistency in returns
- those that outperform normally have a strong conviction (or narrow investment mandate) which whether by luck or judgement the prevailing investment conditions favour
- but while you can't make your own luck you can increase your chances of outperforming by keeping your charges below 1% (the median for UK All Companies)
- you shouldn't get hung up on fund manager tenure or fund manager changes (as the press do)
- the worst investment you can buy is a broad based expensive passive tracker
The last point is fairly logical if you think about it. A tracker fund by definition is going to track the market. However it will always slightly underperform due to the charges it applies. Therefore the more expensive these charges are the higher the level of underperformance. When they get above 1% you are pretty much guaranteed to underperform not only the market but even the worst fund managers.
Investing is like a game of poker. There is clearly an element of skill and plenty of luck. However, the best players stack the odds as much in their favour as possible. It's a case of knowing when to fold and when to stick. Call that skill if you want to. It's the same with investing in funds, know when to fold and when to stick. If you want to stack the odds even more in your favour then keep one eye on costs.

£200 Pension Cashback Offer
Make a qualifying deposit or transfer a pension to our partner Interactive Investor.
- Deposit or transfer a pension of at least £20k and you could earn £200 cashback
- Terms and Fees apply, Capital at risk
- New & Existing customers opening a SIPP
- Offer ends 31st July 2026
Before starting your transfer, check you won't lose any valuable benefits (such as guaranteed annuity rates or a lower protected pension age) and find out what exit fees you might have to pay
