

Unit trusts remain the investment vehicle of choice for DIY investors. The reason why most people favour unit trusts over investment trusts or exchange traded funds (ETFs) is due to their availability and often because of legacy reasons. While investment trusts and ETFs are cheaper than unit trusts and trade instantly like shares not all platforms provide reasonable access to them. In time this will no doubt change and investors will embrace ETFs in greater numbers as and when that becomes possible. While 80-20 Investor provides research on unit trusts, investment trusts and ETFs the BOTB selection and my own £50,000 portfolio are constructed purely using unit trusts. The reason is not because I prefer them as an investment vehicle but because the vast majority of investors have access to them, while having limited access to investment trusts and ETFs. So it's important that I provide research that is not only robust enough to work with unit trusts but also useful to most investors.
The drawbacks of using unit trusts
Of course one of the big drawbacks of using unit trusts is that they are priced and traded daily. As I explained in my recent article 'What’s the best weekday to make a fund switch?', that means all trades or fund switches placed by UK investors are collated and transacted at the same time by fund platforms and fund houses. In addition, because they are forward priced you don’t actually know the price you are buy/selling/switching at when you place the trade. Furthermore because a fund switch does in fact involve a sell instruction and then a buy instruction it can cause a delay leaving you out of the market for a short period of time. When switching unit trust funds there can be a time lag between the point at which you sell one fund and the time at which you invest in the new one. This may be as short as a day but can be longer. Obviously during the time you are out of the market it could move against you or indeed for you.
Theoretically at least there is a 50-50 chance of the market moving against you or for you when you are out of the market. Obviously the shorter the period the better but in the long run it should even out and not impact your returns too much, at least in theory.
A valid question
Understandably there is some scepticism among new 80-20 Investor members whether the indicative returns tracked on the 80-20 Investor homepage could have been achieved in reality. For example I was asked the following valid question in this month's Chatterbox which I will use as the starting point of this research piece:
Hi Damien
In many of your Chatterbox posts you advocate not to switch funds too often to avoid being out of market for too long, yet your monthly newsletter always suggest some changes so, how does this work?
Asking the question as I’m new to this and up until now had religiously mirrored your portfolio and made monthly changes/switches as per every monthly newsletter. This means that I would typically have up to 20-30% of my portfolio out of market every month for up to 5 working days (so since I started 6 months ago I have been out of the market for at least 1.5 month). My performance over the period is much more modest than the 8.89% you have been reporting, so not quite sure how this is achieved? Am I missing something here?
Thank you
The first thing to clarify with this question is that upon inspection although there is reference to my portfolio, the 8.89% in fact relates to the performance of the BOTB Selection for the 6 months from 30 April 2017 to 30th September 2017. For ease of reference I have broken down my answer to the above question into subsections.
The BOTB performance number
The BOTB performance chart provides indicative performance of the BOTB selection. It shows how each month's selection performed as an average. So let's assume that on 1st February 2017 a new BOTB selection is published. Each month thereafter a new BOTB selection is published on 1st of the month. Now the chart on the 80-20 Investor homepage assumes that you buy the funds on 1st February 2017 and then they are immediately switched on the 1st of each subsequent month into the new funds with no switch delay. Of course I understand that is not reality but the assumption is made for a number of valid reasons.
Firstly the BOTB is not a recommendation but simply a shortlist of those funds identified by the 80-20 Investor algorithm that have the most momentum in each of the three risk categories. Think of it like the Chef's Special sheet on a restaurant menu. While you could order everything on the Chef's Special menu there is likely to be a law of diminishing enjoyment (or returns in the case of investing). If you follow how I run my own portfolio I usually pick from the BOTB and typically don't hold more than 10 funds as it concentrates my portfolio and therefore increases my chances of outperforming (or indeed underperforming) the market. If you think about it logically, if I held all 72 US equity funds (instead of just the one that I do) I would simply achieve the sector average for US equities. I am trying to outperform the market not match it as I could do the latter with a simple tracker fund. So the chart on the 80-20 Investor homepage gives an indication of the average return if someone held all 30 funds each month in equal measure, but I don't suggest that you do that. As you can see from my own portfolio you can achieve similar returns and require fewer fund switches if you hold around 10 funds.
By charting the BOTB selection in this way it is also provides a valid comparison for the sector average of the managed funds that also appear in the chart. There are 209 funds within the Mixed Investment 40-85% Shares sector so you couldn't realistically achieve the average return quoted either. Firstly you'd have to hold 209 funds and the index doesn't allows for switch delays at the start of the month either. So I'm comparing apples with apples by charting the 80-20 Investor BOTB in this way.
The other point to bear in mind is that different platforms have different time delays when switching funds. I personally use Fidelity and most fund switches only leave me out of the market for one day. Some overseas funds may take longer but it is rare. There are other fund platforms that take longer (as an 80-20 Investor member warned in this month's Chatterbox). Five working days is far too long so you would be better off either changing your platform or reducing the frequency of your switches (don't forget 80-20 Investor's research accommodates for funds to be held for up to 6 months at a time if you wish to).
The third point to highlight is that if I decided to include the fund switch delays in the indicative chart on the 80-20 Investor homepage it would not solve the problem. Why would I assume that everyone switches funds on the 1st of the month? Most people probably don't. I certainly don't with my £50,000 portfolio. So the best thing to do is to provide an indicative chart, as I do currently, to show people how well the 80-20 Investor shortlist has fared.
So this raises the interesting question of how does reality (including fund switch delays) differ from this indicative chart? I will come on to this later in this piece but for now I want to look at the six month period highlighted in the above question.
An initial look at the implications of switching
The table below shows the performance of the 80-20 Investor BOTB, my £50k portfolio, the 80-20 Investor BOTB with a 2 day fund switch delay and the average managed fund performance for the Mixed Investment 40-85% Shares sector. For the BOTB selection with delay I decided to assume that someone invested in every fund and placed a switch instruction on the 1st of the month. They were then out of the market for two whole days until the switch was complete. As I said before, a 2 day wait is not my experience of a typical fund switch delay.
| Portfolio | % return May to Nov |
| 80-20 BOTB selection | 8.3 |
| Damien's 50k portfolio | 7.25 |
| 80-20 BOTB with a two day delay | 6.77 |
| Mixed Investment 40-85% Shares average | 4.71 |
The first thing to note is that the BOTB outperformed and the figure quoted is only different to that in the original question due to the timeframe being a day or two different. My portfolio slightly underperforms the BOTB selection, and this is down to the different allocation rather than any delay when switching as the chart below shows. Meanwhile the average managed fund brings up the rear. On the face of it it looks like that a delay of two days does hurt returns but if you look at the chart below you can see that the damage was done during the last fund switch when the market rocketed (look at the red line - the dots represent fund switches). Up until that point there wasn't too much to choose between them.
So to answer the original question, no you are not missing anything. If the person was following my portfolio then they would have achieved 7.25%, which isn't 'modest'. If they were following the BOTB then the difference between their result and the BOTB will be down to market timing and delays on their switches. However like I said, I typically only experience delays of 1 working day so my test case with a two day delay is certainly on the tough side. My portfolio return highlights the benefit of running a concentrated portfolio, minimising fund switches and using a platform that doesn't excessively delay fund switches.

I would also add that in the long run things should even themselves out if the fund switch delay is small, after all the odds of the market moving for or against should be 50-50. But does this actually bear out in reality?
80-20 Investor BOTB selection with 2 day fund switch delays over 3 years
To answer the above question I painstakingly reproduced what would have happened assuming that someone invested for the first three years that 80-20 Investor existed (August 2014 to August 2017)
- made a fund switch request when each new BOTB selection was published on the 1st of each month
- spent 2 days out of the market each time until the fund switch was complete
The chart below shows that over the three year period the difference in returns is 3.69% in total. Yet the delay portfolio clearly still outperforms all the other benchmarks I use on the 80-20 Investor homepage.

However if you dig deeper into the numbers the chart below shows the comparative performance from August 2014 until 1st January 2017 and the figures are almost identical. Which is quite incredible.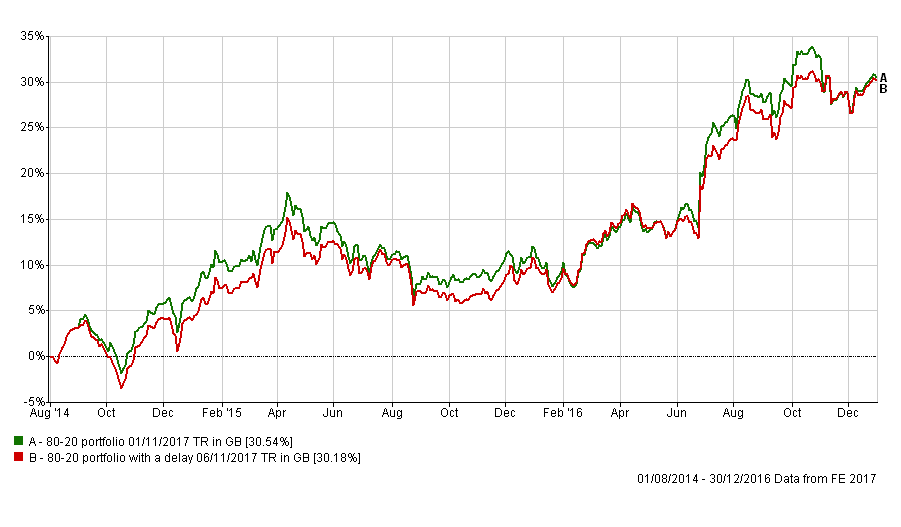
If we now look at the chart below, which shows the performance of the two portfolios from 1st January 2017 to 1st August 2017, then you can see there is a difference. Or in other words the difference in performance for the three years (shown in the first chart) is a result on what happened in 2017. Drilling down even further, the chart below shows that the outperformance was a result of two coincidental jumps in the stock market when the January and February switches were made. From 8th Feb 2017 until 1st August 2017 the performance of both portfolio was identical
Summary
In summary, history suggests that fund switch delays (up to two days long) doesn't impact your performance when using 80-20 Investor and momentum, to any significant degree, because things eventually even themselves out i.e. markets move for you sometimes and against you at other times. In fact any difference in performance can normally be put down to one or two switches where you were either lucky or unlucky, but luck seems to eventually even itself out as long as the market moves when you were out of the market were not extreme in nature. The second chart above is evidence of this. It is also adds weight to my view that you should try and avoid volatile periods when making fund switches if possible (I cover this in detail via the link below).
The findings emphasise the benefit of minimising fund switch delays by running a concentrated portfolio with fewer fund switches and using a platform that keeps delays to a minimum, as I try to do when investing my own £50,000 portfolio. Ultimately all you can do is try and stack the odds in your favour when making fund switches as I explain in my article 'What’s the best weekday to make a fund switch?' and avoid any unnecessary charges such as fund switch charges or bid/offer spreads.

£200 Pension Cashback Offer
Make a qualifying deposit or transfer a pension to our partner Interactive Investor.
- Deposit or transfer a pension of at least £20k and you could earn £200 cashback
- Terms and Fees apply, Capital at risk
- New & Existing customers opening a SIPP
- Offer ends 31st July 2026
Before starting your transfer, check you won't lose any valuable benefits (such as guaranteed annuity rates or a lower protected pension age) and find out what exit fees you might have to pay
