

One of the key investing trends of 2022 has been the bond market's collapse as inflation fears have risen. When inflation fears increase then the likelihood that central banks raise interest rates also increases. Both make the fixed income typically produced by bonds less attractive to investors, causing their value to fall (and yields to rise) as investors look for inflation-proof returns elsewhere. This is known as interest rate risk.
The current environment has been made even more tricky for investors by the fear of slowing economic growth rising alongside inflation (known as stagflation) which also makes equities less attractive. That's because company profits are often closely linked to the growth of the wider economy.
This is why in 2022 we've seen the unusual scenario of bonds and equities falling in tandem which has caused a headache for investors and ultimately requires a different approach. It is worth reading my research article "The diversification dilemma - when bonds and equities fall together".
However, as I've noted in my recent weekly newsletters - titled "Has the global growth scare arrived" and "The two bond charts I'm watching" there is always a chance that the positive correlation between bonds and equities could change.
In these newsletters I suggested that "stagflation is now the market obsession and there’s a sense that investors are waiting for a sign that inflation has peaked before they pile back into bonds. When that happens they will be less concerned with inflation and more with slowing growth. Then the fortunes of bonds and equities will likely diverge again and no longer move in tandem". In recent weeks we've seen early signs of this trend materialising and we've also seen "bonds behaving how they did pre-2022 whenever equity markets slumped. That means we saw money rush into government bonds, pushing their prices up, so that they began acting as portfolio diversifiers once again".
It raises the question that if we do see a rapid repricing of bond markets, if investors think inflation has peaked and economic growth is slowing, which funds could take advantage of this. It's at this stage that it is important to understand something called bond duration.
Duration
When you invest in a bond you receive a fixed series of income payments and a final return of capital (at the end), in exchange for your initial investment. It is essentially a loan from you to a company or government. Now in a simple case where you don't receive interest payments (called coupons) on the loan (bond) and instead just receive your capital amount back at the end of the agreed term, let's say 10 years, it's pretty easy to work out when you will be repaid your money. In this example the amount you are repaid will equal the amount you initially invested (loaned) when the bond matures in 10 years time.
Yet with most bonds you do in fact receive regular coupons (interest payments) periodically until the end of the bond term when you then receive the lump sum. These coupons compensate you for the investment risk you are taking. Now the point at which you have recouped the initial amount you paid for the bond is not 10 years but somewhere much earlier. The point in time depends on the amount of interest (coupons) you receive.
That length of time is actually called a bond's duration and obviously differs from the bond's ultimate maturity date. Now if a bond has a low duration it means that the income stream for the bond is front-loaded so you get back your money much sooner than the final capital repayment at the bond's maturity date. By contrast a bond with a long duration makes you wait until much later to get to the break-even point.
The other key thing to remember about a bond is that the coupon is usually fixed. So if you have a bond that lasts 20 years then the annual payment you receive will be the same for each of those 20 years. Of course that means that as interest rates rise in the economy, or inflation increases, the real purchasing power of your future coupons becomes a lot less. Therefore if you wanted to sell the bond on you are going to get a lower price for it as it's less attractive to any potential investor. So that is why rising interest rates and inflation are bad for bonds and bond funds.
What dictates how much the value of your bond fund falls or rises in value is where duration comes in. The scale of the fall or rise is influenced by a bond's (or bond fund's) duration. If it looks like interest rates won't stay low forever and central banks will start pushing them up then bonds with a longer duration will see the real value of their income stream hit the hardest. By contrast if you had a short dated bond that matured in six months then a rise in interest rates will have little impact on the spending power of any income you've yet to receive or the final repayment. So bond duration is a measure of interest rate risk
So you can now see why for every 1% increase or decrease in interest rates, a bond's price will change by roughly 1% in the opposite direction for every year of duration it has. So if a bond has a duration of 5 years then if the interest rate rises 1% the bond price will fall 5%. Bond funds own hundreds of bonds which when combined give the fund an overall duration which fund managers will look to control.
This helps explain why during the sell-off in bonds during much of 2022 some bond funds have taken more of a hammering than others. Equally, if the bond market was to suddenly rally then the reverse would be true.
Methodology
So let's focus on how to pick bond funds that might outperform if bond markets were to suddenly rally, if investors repriced the outlook for central bank monetary tightening or indeed the central banks became more dovish.
Assuming you have read the previous section on bond duration, you would understandably conclude that you would want to identify and invest in bond funds that have a duration longer than their peers. However, this is easier said than done as I've yet to come across duration data available either publicly or via a paid subscription. The reason is that fund managers don't always release this data.
So how else can we go about finding such funds. First of all, remember that when bond prices rally it means that their yields fall and of course the opposite is true. Therefore if we want to look for bond funds that could perform well in a strong and extended bond market rally, we can look at a recent time in history when bond yields have tumbled. A good example is the period between 6th May 2022 and 12th May 2022 when government bond yields crashed as markets began to worry more about the prospect of a recession, rather than high inflation. We could of course then look at the return from bond fund unit trusts and attempt to draw a conclusion as to which might fare better in a bond market rally.
This wouldn't be unreasonable because the rally in bonds during this period was largely driven by the markets scaling back their bets on how aggressive central banks would be when it came to raising interest rates. Therefore, logically those funds with a longer duration should have outperformed those with a shorter duration.
However, the fly in the ointment is that duration isn't the only driver of bond returns. Others include supply and demand, credit risk (i.e the risk that the bond issuer may go bust) and even currency moves. It's this latter one in particular that clouds the issue for global bond funds. Between the 6th May and 12th May the pound fell 3% against the US dollar. This is a significant move and would have boosted the performance of any fund holding US treasuries irrespective of whether the underlying holdings rose in value or not.
So I looked for another recent pullback in bond yields that permeated government bond markets, where currency moves were less significant. This second period was between 16th February 2022 and 1st of March 2022 and was partly caused by the invasion of Ukraine and investors' flight to safety and reassessment of the global economic outlook. During this period the pound only fell 0.8% against the US dollar.
The charts below show how the pullback in bond yields occurred during both periods, both in the UK and the US, as signified by the red arrows.
10 year US treasury yield

10 year UK gilt yield
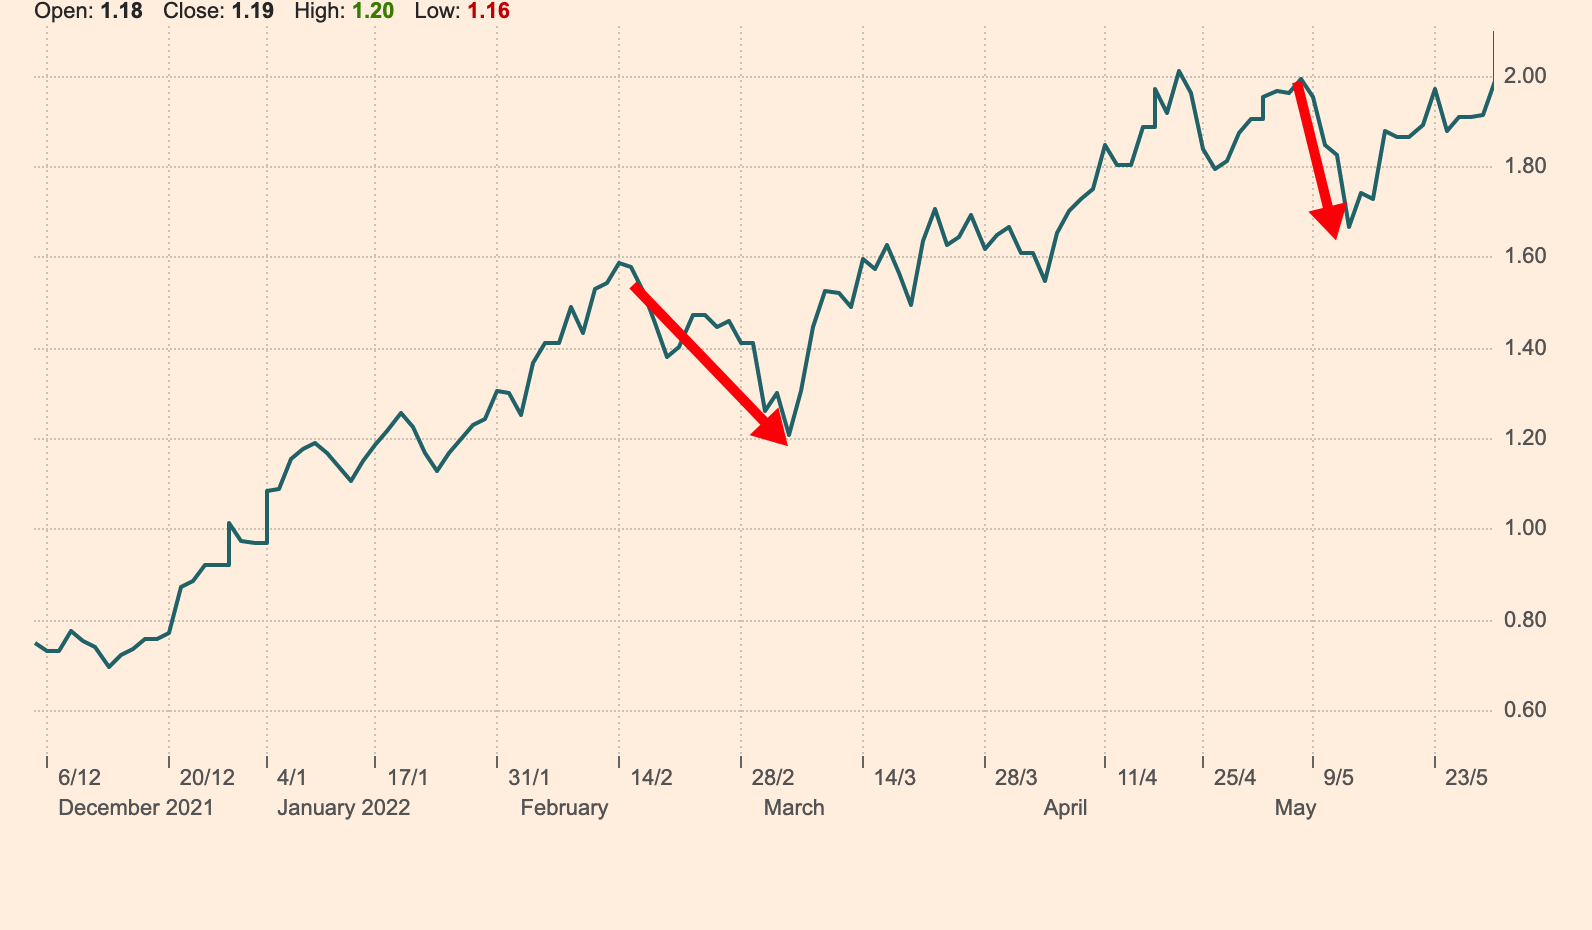
By comparing bond fund performances during both periods it gives a better indication of a bond fund's duration and it's easier to identify those funds that could outperform their peers if bond markets rally, if interest rate rise expectations are tempered.
Using these two timeframes I analysed all the unit trusts in the following sectors (all of which have significant exposure to bonds).
- Mixed Investment 0-35% Shares
- Global Bonds
- Sterling Strategic Bond
- Sterling Corporate Bond
- Sterling High Yield
- UK Gilts
- UK Index Linked Gilts
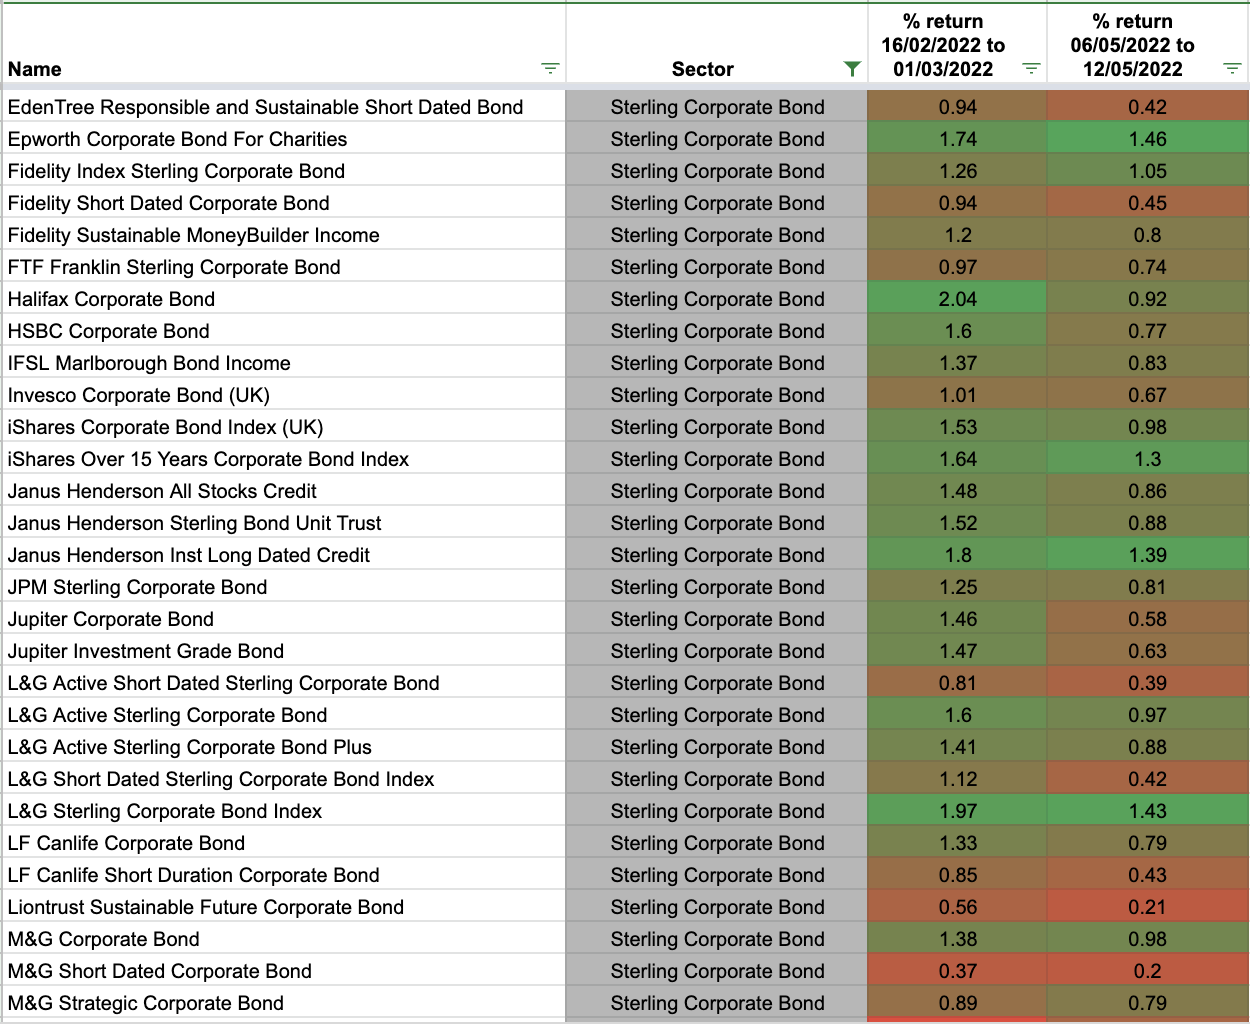
I then produced a heatmap of the performance of each fund relative to its sector peers. There is a column for each time period I have analysed and these are colour-coded. The top performers during a time period are coloured green, while the worst are red. I have also produced a heatmap that combines all of the charts heatmaps into a single sheet for ease of comparison. Remember, a fund's colouring is relative to its sector peers during the stated time period at the top of the column.
Heatmaps - and how to use them
If you click on each link you can download the heatmap for each sector. If you want to see which funds may outperform during a bond market rally, then look for those that are greener in colour in both columns. You will notice that one or two of the best performers will have names that include words such as "long duration" which therefore validates my methodology. Likewise, some of those in red have names which include words such as "short duration". But of course, there are exceptions plus most funds have neither term in their name.
Another thing you may notice is that most index-linked funds have performed very well during the bond market rallies, and again that is because index-linked bonds tend to have longer maturity dates and longer durations.
Here is a list of the heatmaps:
- Mixed Investment 0-35% Shares heatmap
- Global Bonds heatmap
- Sterling Strategic Bond heatmap
- Sterling Corporate Bond heatmap
- Sterling High Yield heatmap
- UK Gilts heatmap
- UK Index Linked Gilts heatmap
Click on the image below to download the combined list of funds.

What if bond markets continue to crash?
If we see bond markets continue to tumble as a result of fears over central bank tightening then funds with shorter duration (i.e. those in red for both time periods) should fare better. Conversely, those in green (with longer duration) should fare worse.

£200 Pension Cashback Offer
Make a qualifying deposit or transfer a pension to our partner Interactive Investor.
- Deposit or transfer a pension of at least £20k and you could earn £200 cashback
- Terms and Fees apply, Capital at risk
- New & Existing customers opening a SIPP
- Offer ends 31st July 2026
Before starting your transfer, check you won't lose any valuable benefits (such as guaranteed annuity rates or a lower protected pension age) and find out what exit fees you might have to pay
