

In this month' Chatterbox I was asked the following question:
Hi Damien
Do you think that carefully selected absolute return funds can be a bond substitute/diversifier and risk reducer in portfolios? My emphasis would be on “carefully selected”! There is some evidence that some of them have done better in preserving capital this calendar year.
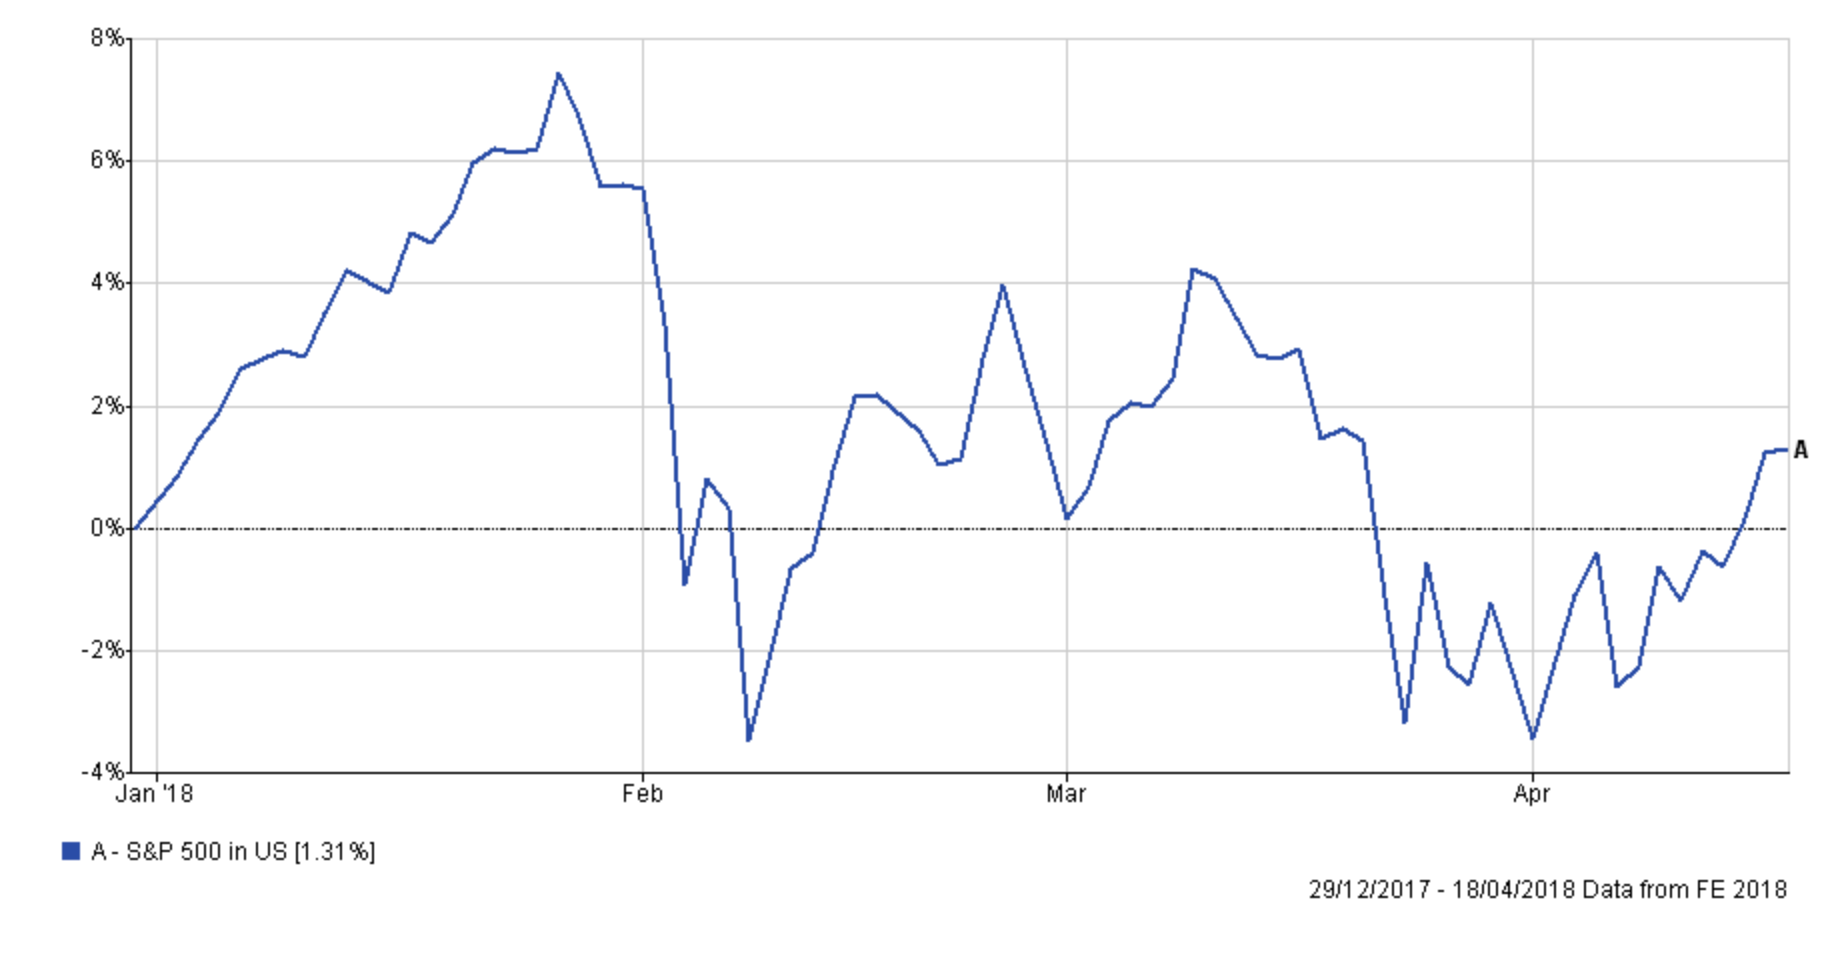
I think it is an excellent question and one which warrants further investigation to see if such funds exist. It also gives me a chance to illustrate how I might research such funds. So how do I go about it? Firstly it is worth looking at how markets have performed year to date. The chart below shows the performance of the S&P 500 since the start of the year (click to enlarge).
The second chart shows the performance of the average Strategic bond fund and the average Global bond fund over the same period.
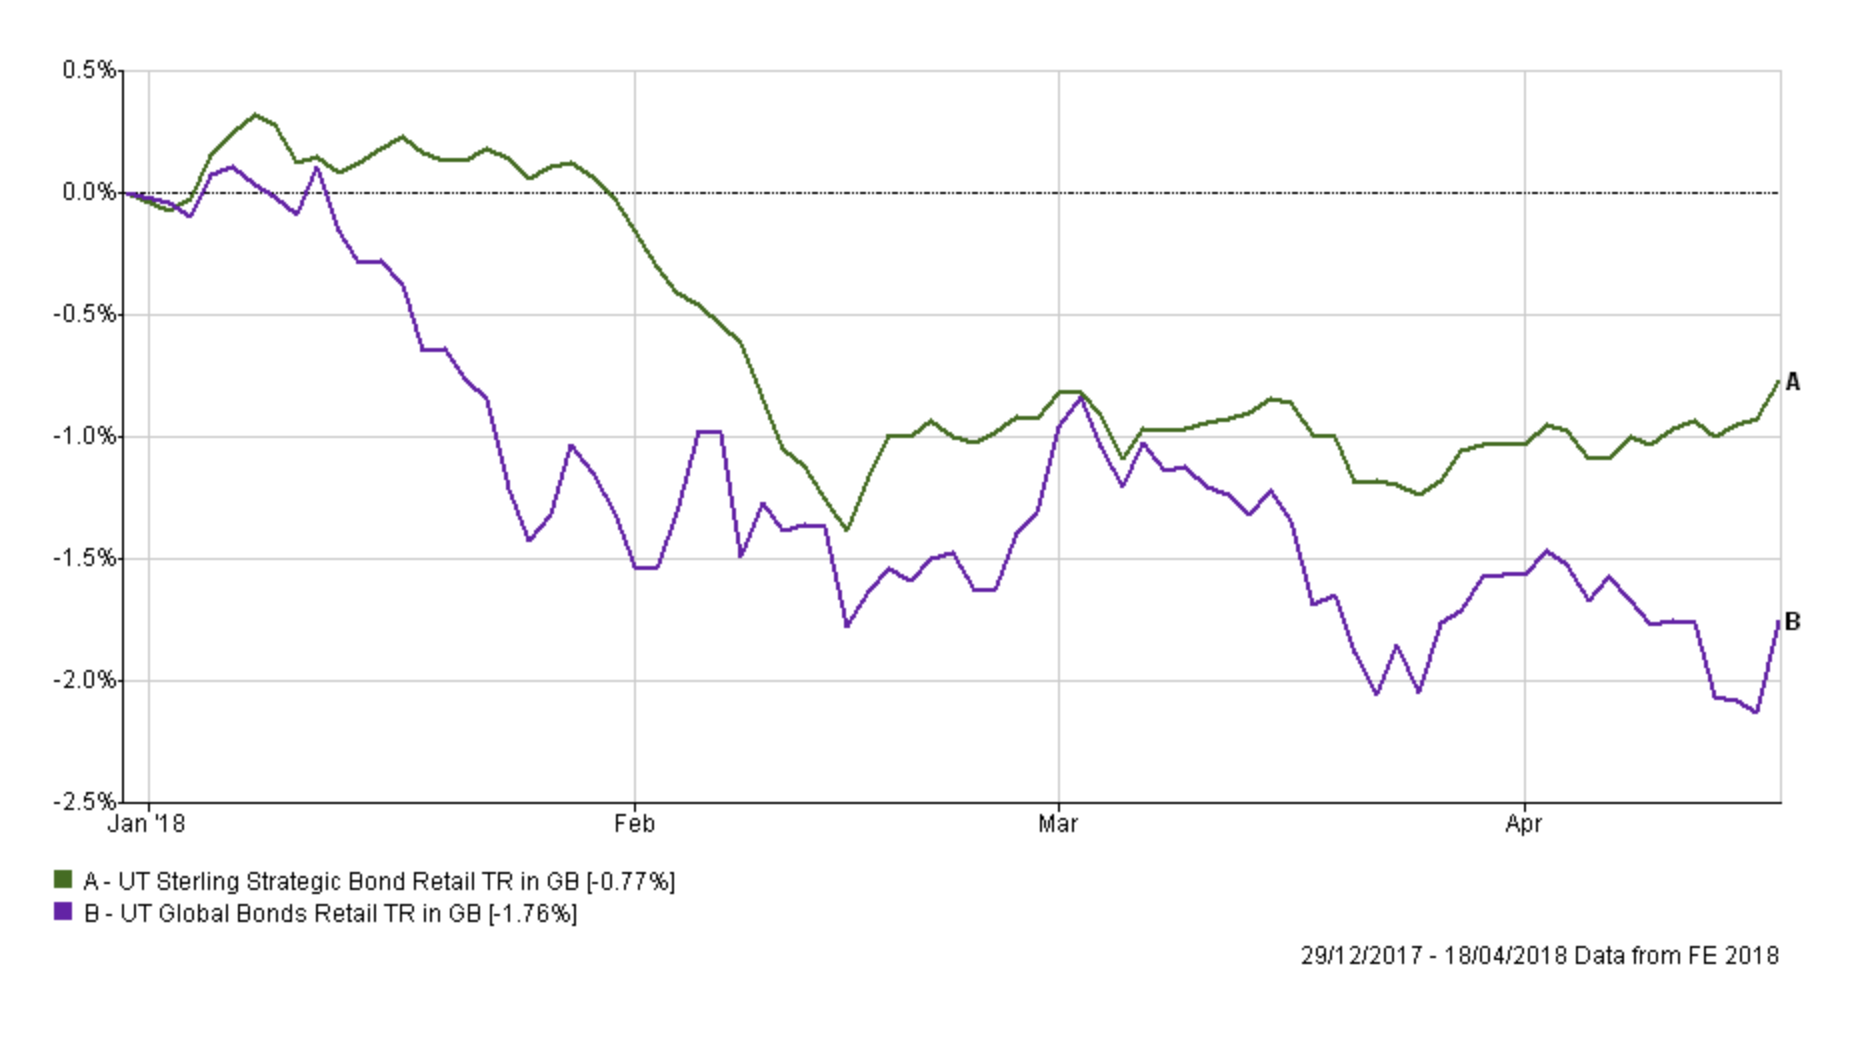
The key takeaway is that February's sell-off in equities matched a sell-off in bonds. If you recall it was the falling price (i.e the rising yield) of 10 year US Treasuries that sparked the equity market correction. Bonds have continued to struggle while equities have attempted to rebound but still remain some way from their recent highs. March's sell-off in equities was triggered primarily by a slump in technology stocks, and bonds were largely unaffected.
The most profitable funds year to date
To give the above charts some context the year to date (YTD) performance of the average Targeted Absolute Return fund is -0.43%. Digging deeper, the table below shows the top 10 funds from within the sector that have made the most money YTD.
| Name | % return YTD |
| Natixis H2O MultiReturns | 9.04 |
| Thesis TM Sanditon UK Select | 4.44 |
| Argonaut FP Argonaut Absolute Return | 4.05 |
| BlackRock Emerging Markets Absolute Alpha | 3.79 |
| JPM Global Macro Opportunities | 3.17 |
| LF Odey Absolute Return | 2.82 |
| L&G Multi-Asset Target Return | 1.8 |
| Schroder European Equity Absolute Return | 1.65 |
| Schroder UK Dynamic Absolute Return | 1.63 |
| VT Tcam Absolute Return Portfolio | 1.57 |
| M&G Global Target Return | 1.28 |
| Schroder Absolute Return Bond | 1.27 |
| VT Woodhill UK Equity Strategic | 1.1 |
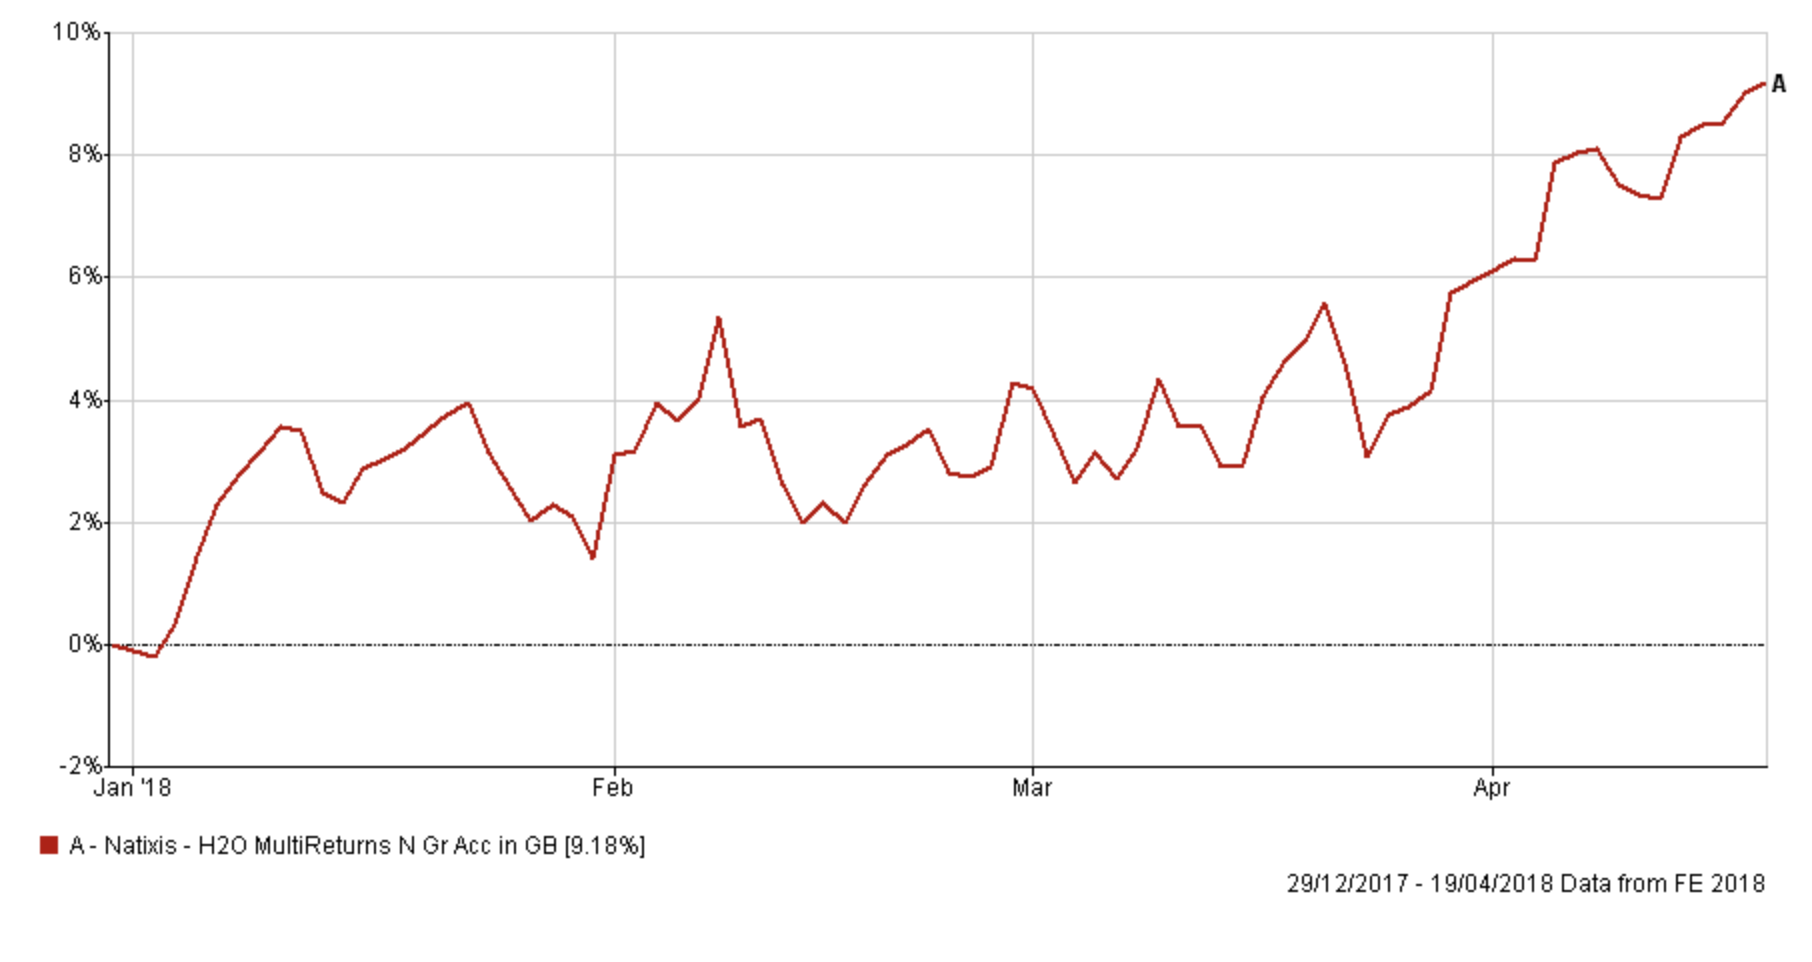
Most of the other 60 Targeted Absolute return funds made a loss YTD. The average loss was -1.63% (so worse than most bond funds over the same period) with the worst performing Targeted Absolute Return fund down almost 8%. It is interesting to see that the top fund in the table above is in this month's BOTB selection and the fund has made 3.64% during the 17 days since it was highlighted as shown in the chart below:
The trouble is that some Targeted Absolute Return funds have a lot of equity exposure while others don't. If a Targeted Absolute Return fund has significant equity exposure there is a good chance that it may have fallen significantly during the stock market sell-offs in February and March but rebounded to still be in profit for the YTD. If you look at the S&P 500 chart earlier it shows that the index has done just that. So if I truly wanted to preserve capital then I would want to see a fund perform well during both sell-offs as well as YTD. If you just focus on the YTD performance then you could end up with a quasi-equity fund, which won't have been good at preserving capital in reality.
Therefore the table below shows the YTD performance of the funds mentioned earlier plus their percentage return during February's bond (and equity) rout and March's stock focussed sell-off. In addition, I show the performance since the equity market weakness began back in January. Or in other words, the performance across both market wobbles up to today. I've colour-coded the chart to show profits in green and losses in red.
You can see that of all the funds only Thesis TM Sanditon UK Select fund made a positive return across all periods. However, the most impressive performance overall came from the Natixis fund. It is also interesting to see that there are a number of funds that have made a profit since the stock market weakness first began back in January (column 5). So even though equity markets still remain down the funds in green are in profit.
| Name | % YTD | % return during Feb dip | % return during March dip | % return since sell-off started on 26th Jan |
| Natixis H2O MultiReturns | 9.04 | 3 | -1.2 | 6.59 |
| Thesis TM Sanditon UK Select | 4.44 | 0.77 | 1.69 | 5.74 |
| Argonaut FP Argonaut Absolute Return | 4.05 | -3.96 | -1.45 | -3.34 |
| BlackRock Emerging Markets Absolute Alpha | 3.79 | -1.18 | -0.25 | -1.15 |
| JPM Global Macro Opportunities | 3.17 | -1.02 | -0.82 | -1.8 |
| LF Odey Absolute Return | 2.82 | -0.36 | -0.72 | 2.43 |
| L&G Multi-Asset Target Return | 1.8 | -1.9 | -0.12 | 0.5 |
| Schroder European Equity Absolute Return | 1.65 | -0.17 | 0.52 | 0.86 |
| Schroder UK Dynamic Absolute Return | 1.63 | -0.34 | 0.62 | 1.18 |
| VT Tcam Absolute Return Portfolio | 1.57 | -0.19 | 0.1 | -0.14 |
| M&G Global Target Return | 1.28 | -0.42 | -0.49 | -0.78 |
| Schroder Absolute Return Bond | 1.27 | 0.16 | -0.18 | 0.04 |
| VT Woodhill UK Equity Strategic | 1.1 | -0.11 | -0.52 | 1.43 |
If I was to look at the chart above and I was looking for a bond alternative I'd pay particular attention to columns 2 and 3 as February's sell-off (column 3) was bad for bonds.
Now the reason why I have included column 5, which shows the performance across both market sell-offs up to today, is that it gives you an idea of how the fund has performed even when the market has recovered. It's not just what a fund does that is important but the way that it does it. To illustrate this if you restarted this research article but just focused solely on how a fund had performed YTD and during the periods when markets were falling then City Financial Absolute Equity fund would stand out. The fund has returned -0.32% year to date (just missing out on being in the table above) but during February's sell-off it made an impressive 1.37% and during March's sell-off it made 1.38%. The trouble is that despite this it has lost 1.4% since the market weakness started in January. That may seem a little odd given that it made money when the stock market was falling. The chart below shows how the fund performed versus the UK stock market and an interesting pattern emerges.
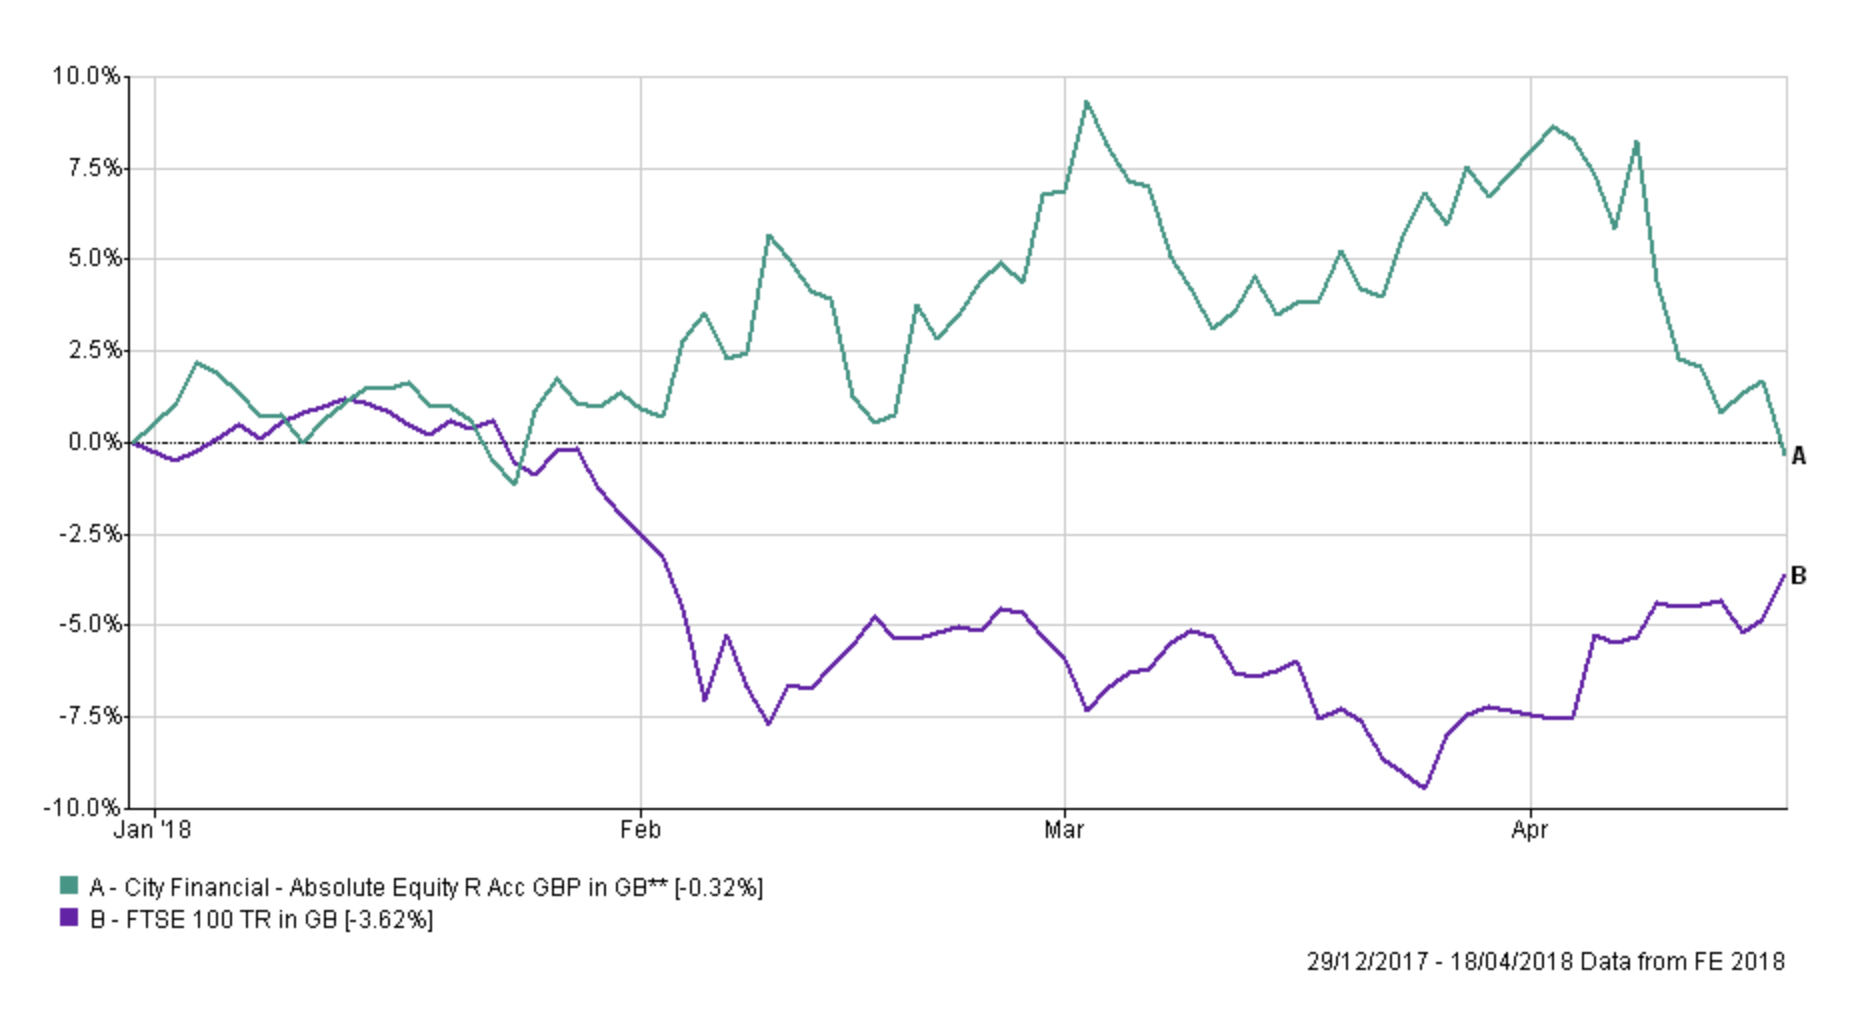
The City Financial Absolute Equity fund moves inversely to the FTSE 100. Clearly, the fund is shorting the stock market. So that's why it has made money when the market has fallen yet lost money when equity markets rebounded to finish flat for the YTD. As part of a portfolio, the fund would reduce the impact of a severe equity market correction but it also limits the portfolio's upside should markets rally. So this takes the whole idea of capital preservation in a falling market in a different direction. It is possible, using the technique above to identify funds that are potentially shorting the market (so they make money when stocks fall), without having to go through the fund factsheets for every Targeted Absolute Return fund.
Can you short the market?
So does that meant that the funds that have performed well during 2018 have been employing similar shorting techniques? One way to test this was to use the 6-week max weekly fall figures we publish in the 80-20 Investor tables. Prior to January's correction equity markets rallied very strongly. So if a fund was shorting the market, pre-empting an impending crash, then as equity markets rallied into the end of 2017 the fund would have suffered some strong losses. So I analysed the max weekly fall in the six months prior to 31st December 2017 for all Targeted Absolute Return funds. The list shows the top ten funds with the biggest max fall figures at the top (the number in brackets). The average max weekly fall figure for the sector was -1.66%. The overlap with the earlier top performers tables above is startling:
- LF Odey Absolute Return (-8.64%)
- Natixis H2O MultiReturns (-5.81%)
- Argonaut FP Argonaut Absolute Return (-4.68%)
- JPM Global Macro Opportunities (-4.43%)
- BlackRock Emerging Markets Absolute Alpha (-4.23%)
- Thesis TM Sanditon European Select (-3.94%)
- VT iFunds Absolute Return Orange (-3.92%)
- TM Fulcrum Diversified Absolute Return (-3.89%)
- TM Fulcrum Diversified Core Absolute Return (-3.89%)
- Schroder European Equity Absolute Return (-3.1%)
- VT iFunds Absolute Return Green (-2.95%)
- Thesis TM Sanditon UK Select (-2.85%)
- City Financial Absolute Equity (-2.7%)
- Schroder UK Dynamic Absolute Return (-2.42%)
- VT Woodhill UK Equity Strategic (-2.38%)
Just like the City Financial Absolute Equity fund many of the funds listed clearly have large short positions (i.e are betting that an asset price will fall). Often the short position is in equities but sometimes it is in bonds. It also helps to explain some of the results we see in the colour coded table earlier. Take the Thesis TM Sanditon UK Select fund for example, it has aggressive short positions which is why it made money in both sell-offs (columns 3 & 4). By contrast, the Natixis H2O MultiReturns fund made a lot of money during February's bond rout because it has been betting that bonds (US Treasuries in particular) will fall. Unsurprisingly during March's equity sell-off bonds did fairly well as investors dashed to safer assets. It follows then that the Natixis fund lost money when bond prices rose. The LF Odey Absolute Return fund also has some short equity position (which are hedged against a rise in sterling). Both strategies boosted returns and helped the fund outperform its peers as well as equity and bond funds.
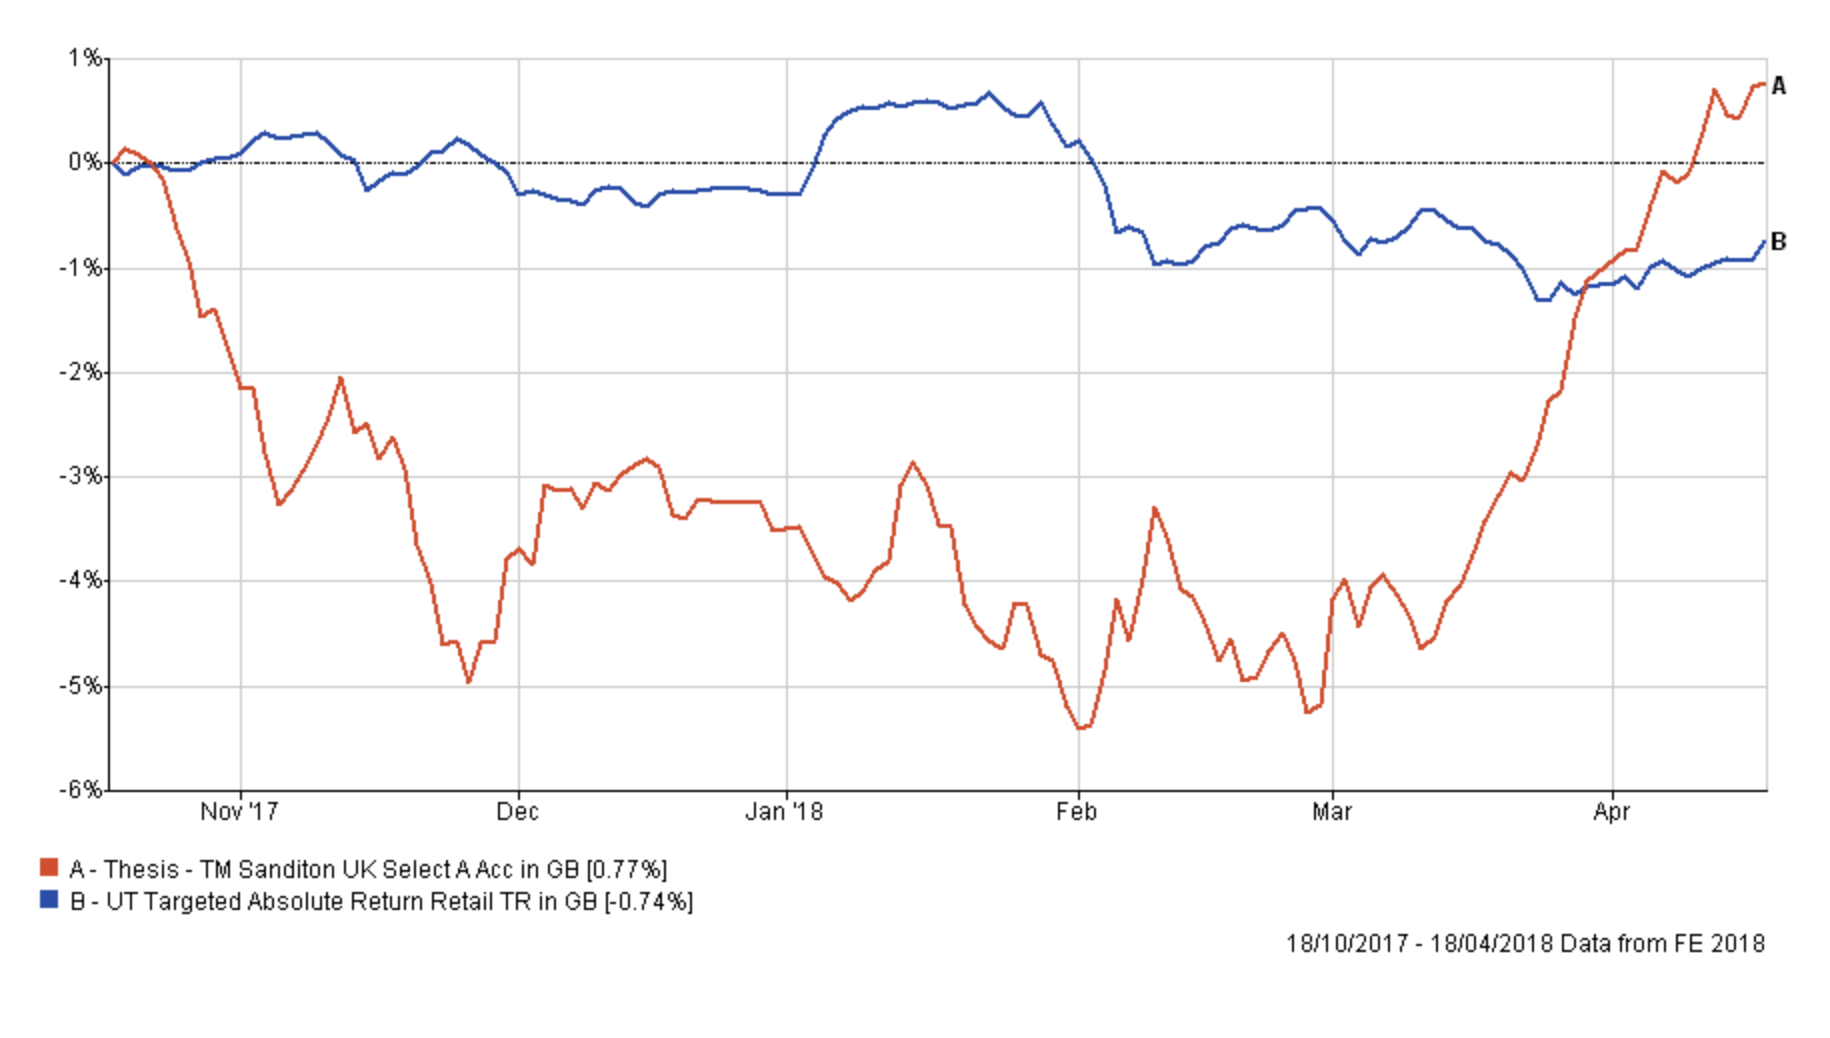
So it is possible, even with unit trusts to essentially short the market if you choose the right fund. It can reduce the risk on your portfolio but it also carries its own risks. The chart below shows how Thesis TM Sanditon UK Select performed over the last six months. You can see that the fund was losing money all the time the stock market rallied but as soon as equity markets entered a correction they jumped in value.
Key takeaways
- It is unusual to have a bond sell-off and an equity sell-off in such quick succession but it means that just by looking at the performance of the funds during and across each wobble you can work out how a fund is positioned.
- it is possible to take short positions if you are worried about a severe market correction
- it's not just what a fund returns that is important but how it does it as illustrated by the LF Odey Absolute Return fund
- the Targeted Absolute Return sector is a mixed bag of funds and it's almost impossible to compare apples with apples.
- it is not usually easy to know how a fund is positioned without the benefit of hindsight
- many absolute return funds are just as volatile as equity markets
- few absolute return funds did what consumers expected them to do, which was to give an absolute return in all market conditions.
Capital Preservation - the boring way
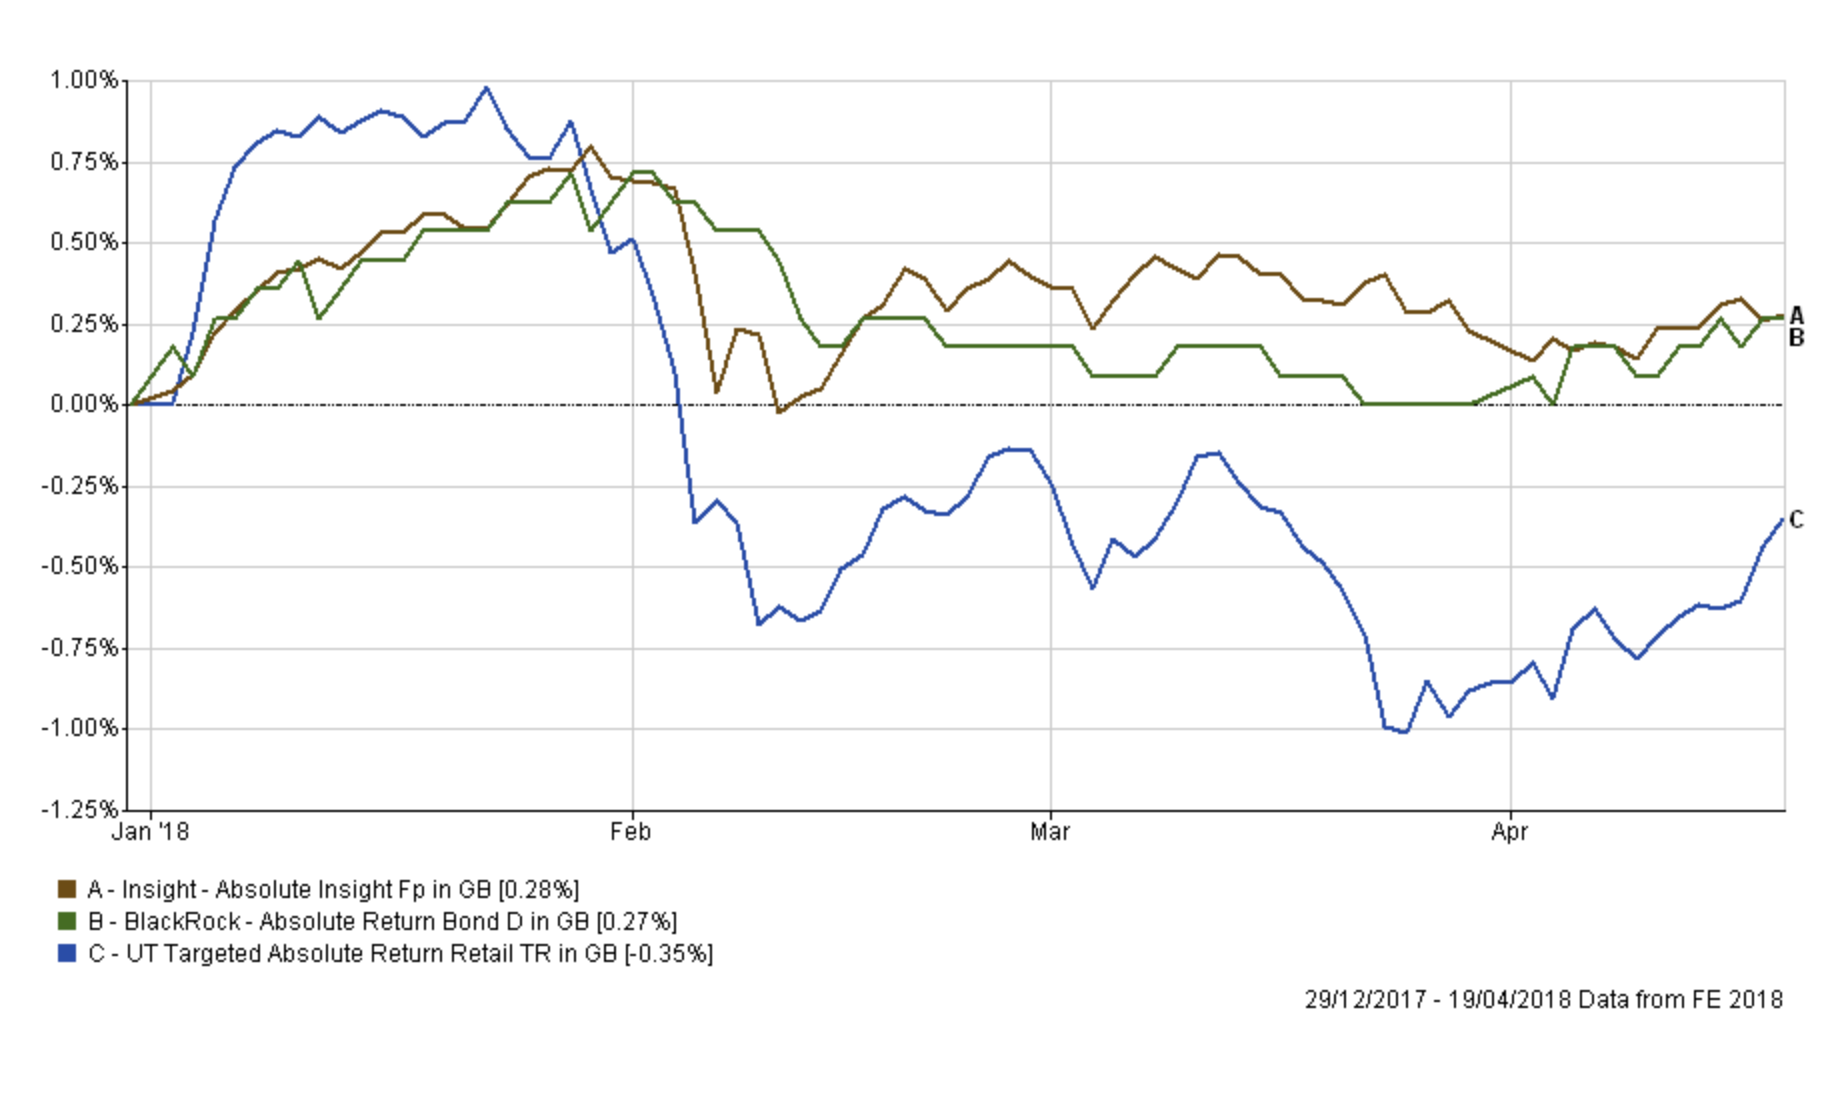
So, what about if you just want to preserve capital (i.e not lose money), rather than try to make money in a falling market by essentially betting against it. Well, cash is always King as the recent Heatmaps have shown. Focusing just on YTD returns has its limitations as shown above, especially when we get severe corrections. Therefore if you want to find a fund that doesn't tend to lose money (i.e preserves capital) it pays to look for funds with low volatility too, that had a low max fall figure prior to the start of 2018 and that had a positive return YTD (beating cash and an average bond fund). The result would be boring funds that preserve capital by not betting against the market, that offer a better return than cash. Two potential funds leap out straight away. Interestingly one of them was Insight Absolute Insight which I held in my £50k portfolio, somewhat ironically, until January when I then sold it. I compare the performance for both funds in the chart below against the average Targeted Absolute Return fund (click to enlarge). Sometimes being boring works.
All performance figures are net of fund charges. The material in any email, the MoneytotheMasses.com website, associated pages / channels / accounts and any other correspondence are for general information only and do not constitute investment, tax, legal or other form of advice. You should not rely on this information to make (or refrain from making) any decisions. Always obtain independent, professional advice for your own particular situation. See full Terms & Conditions, Privacy Policy and Disclaimer.
Neither MoneytotheMasses.com or 80-20 Investor nor its content providers are responsible for any damages or losses arising from any use of this information. Past performance is no guarantee of future results.
Funds invest in shares, bonds, and other financial instruments and are by their nature speculative and can be volatile. You should never invest more than you can safely afford to lose. The value of your investment can go down as well as up so you may get back less than you originally invested. Tax rules can change and benefits depend on individual circumstances.
Information provided by MoneytotheMasses.com or 80-20 Investor is for general information only and not intended to be relied upon by readers in making (or not making) specific investment decisions.
Appropriate independent advice should be obtained before making any such decisions. Leadenhall Learning (owner of MoneytotheMasses.com or 80-20 Investor) and its staff do not accept liability for any loss suffered by readers as a result of any such decisions.
The tables and graphs are derived from data supplied by Trustnet. All rights Reserved.

£200 Pension Cashback Offer
Make a qualifying deposit or transfer a pension to our partner Interactive Investor.
- Deposit or transfer a pension of at least £20k and you could earn £200 cashback
- Terms and Fees apply, Capital at risk
- New & Existing customers opening a SIPP
- Offer ends 31st July 2026
Before starting your transfer, check you won't lose any valuable benefits (such as guaranteed annuity rates or a lower protected pension age) and find out what exit fees you might have to pay
