

In recent newsletters I've written extensively about the important role that the US dollar plays in determining price moves across a range of assets. I summarised this succinctly in my newsletter titled "Don't fight the US dollar". Just to reiterate...
"A strong dollar not only tends to hit US stocks but also commodities (especially gold) as well as proving a headwind for Asian and emerging markets. In contrast, a strong dollar versus the Japanese yen tends to be positive for the Nikkei 225, while a weaker pound versus the stronger US dollar can provide some support for the FTSE 100.
The US dollar index [which measures the strength of the dollar against a basket of currencies] goes a long way to explaining many of the market moves we've seen this year, especially since mid-June. [During the first week of September] the US dollar index began to fall, as a result of a more hawkish ECB. The prospect of more interest rate hikes in the eurozone pushed up the value of the euro against the dollar, causing the dollar index to fall. Investment markets responded in kind, as you'd expect but... a change in the value of the US dollar index will not always immediately result in a textbook move in another asset's price, say for example gold or Japanese equities, at least not until the dollar's new trend becomes established.
But with markets hanging on every move central banks make, or might possibly make, much of this is being reflected in the movement of the US dollar index. Where the US dollar goes the rest of the market listens it seems. Rather than "don't fight the Fed", perhaps the investment mantra should become "don't fight the US dollar".
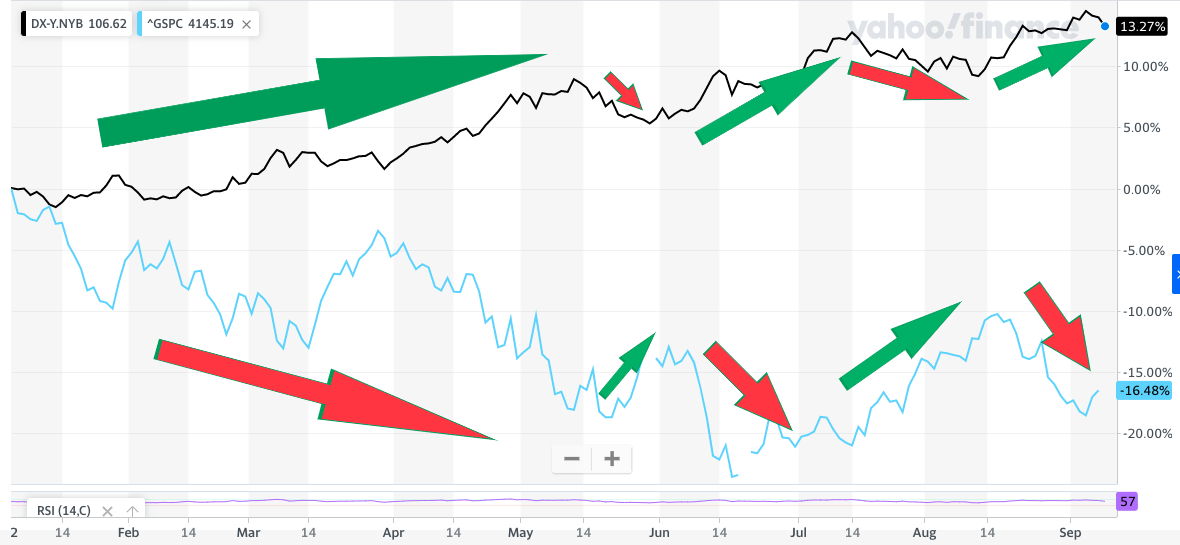
It is, therefore, prudent for investors to keep an eye on the value of the US dollar index. In the same newsletter I demonstrated the influence that the US dollar index had on the S&P 500 throughout 2022 using the chart below. You can see that when the dollar weakened (the black line) the US stock market (the blue line) rallied. Whenever the dollar strengthened, the US stock market fell.
So it raises the question - how can you find funds to benefit from the continuation of the US dollar rally or, conversely, funds that will benefit from a collapse in the US dollar index?
Methodology on finding funds to play the US dollar
If you want to play the US dollar then it is possible to do so directly via currency ETFs which appear in the BFBS tables and on your chosen investment platform. Of course this is very high risk and unsuitable for most investors. But it is also possible to gain some exposure to movements in the US dollar index via unit trust funds that invest in a diversified range of assets including bonds and equities.
While the strength of the US dollar undoubtedly drives market and asset price behaviour it is by no means the only influencing factor. For example, the US dollar may rally through fear, given its haven status among investors, as a result of geopolitical events but at the same time the price of commodities (such as oil) might spike. Russia's invasion of Ukraine caused such an unusual combination of asset price moves. Similarly today we've seen the US dollar index rise modestly, but as a result of a collapse in the pound as investors pull their money out of the UK in the aftermath of the mini-Budget. It means that analysing just one period of time when the dollar strengthened or weakened can be misleading.
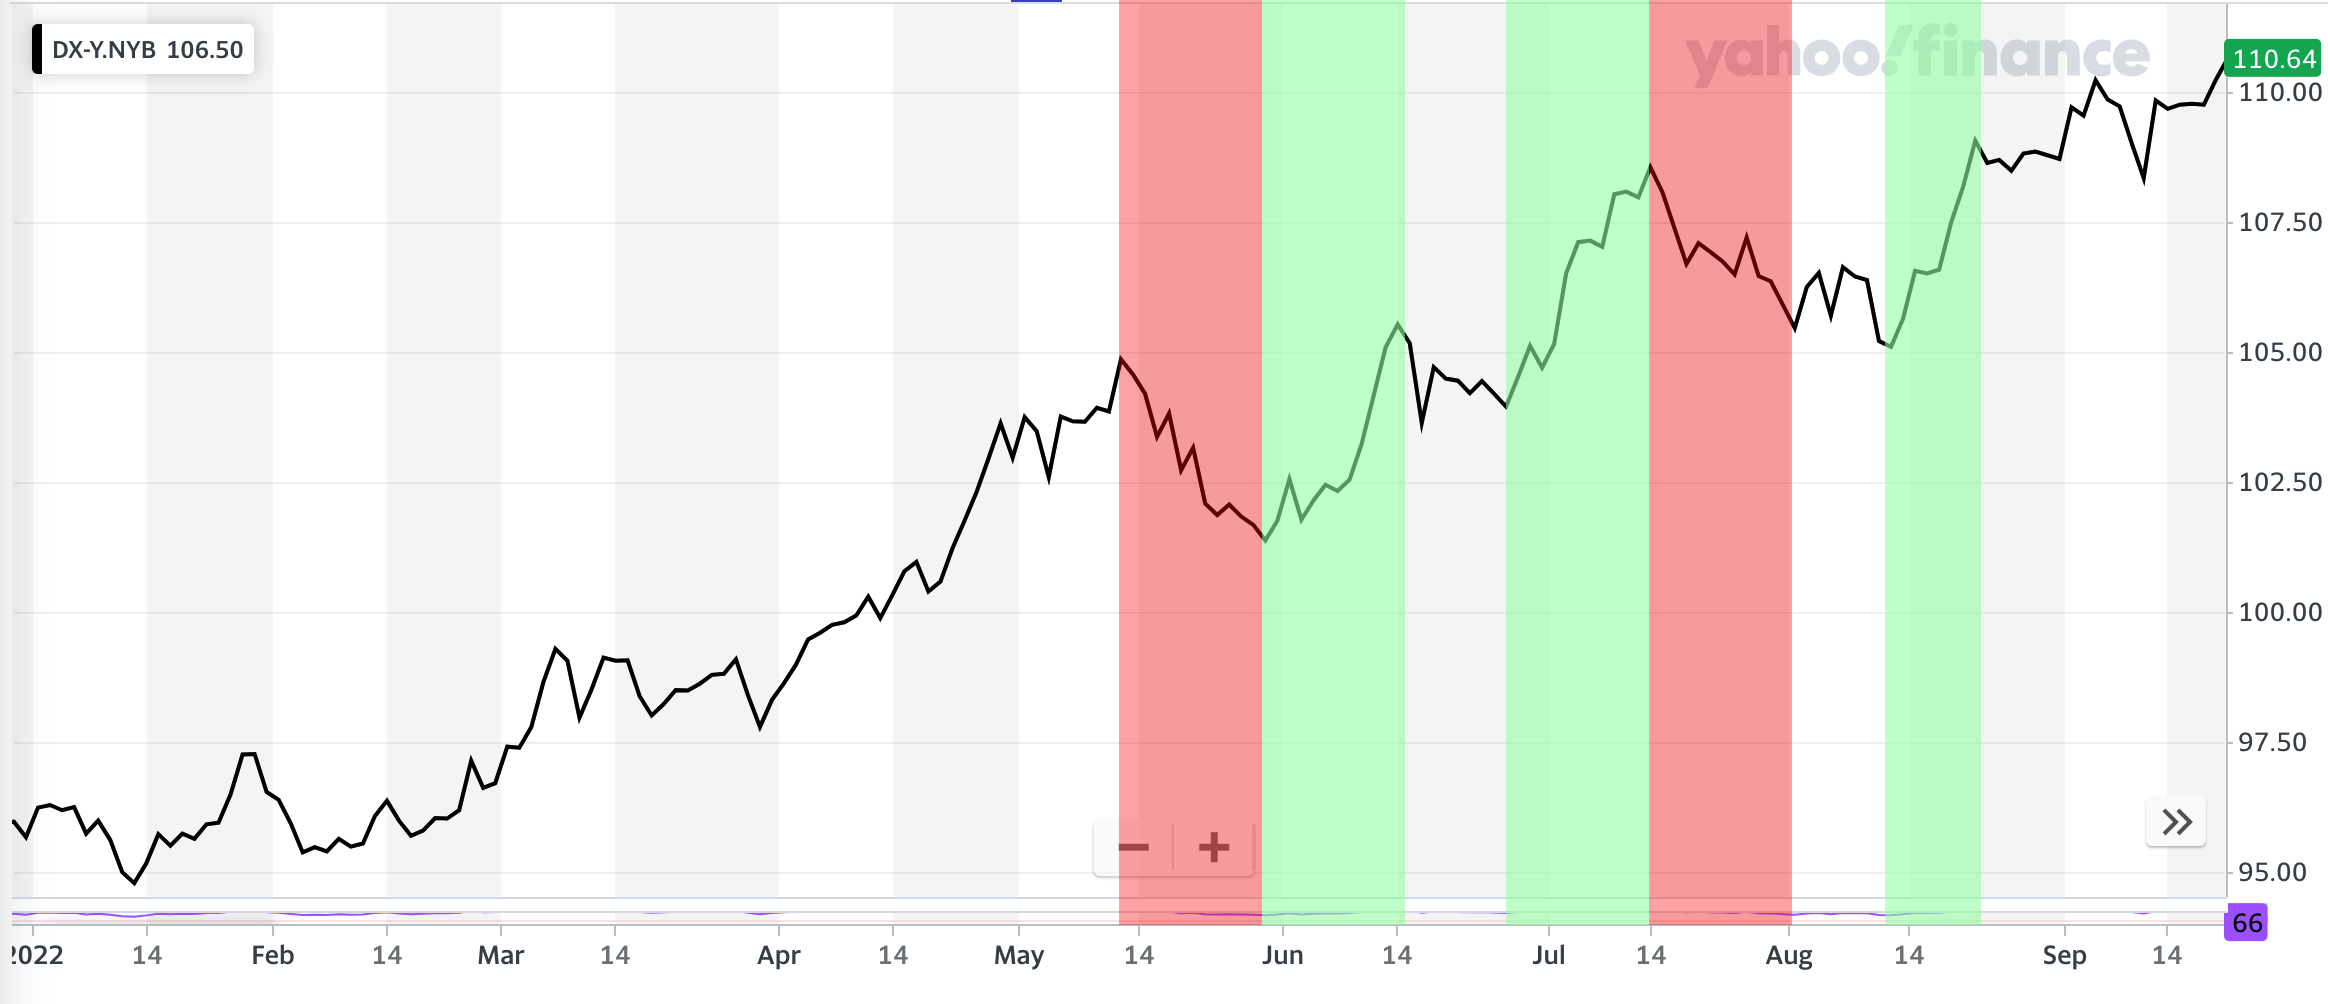
To get around this I identified a series of strong moves in the US dollar index (both higher and lower) over the course of 2022 as shown in the chart below. Green indicates that the US dollar index strengthened significantly while red indicates a period of time when the US dollar index fell sharply. You can see that each period is almost identical in terms of duration, only the latter rally period is marginally shorter.
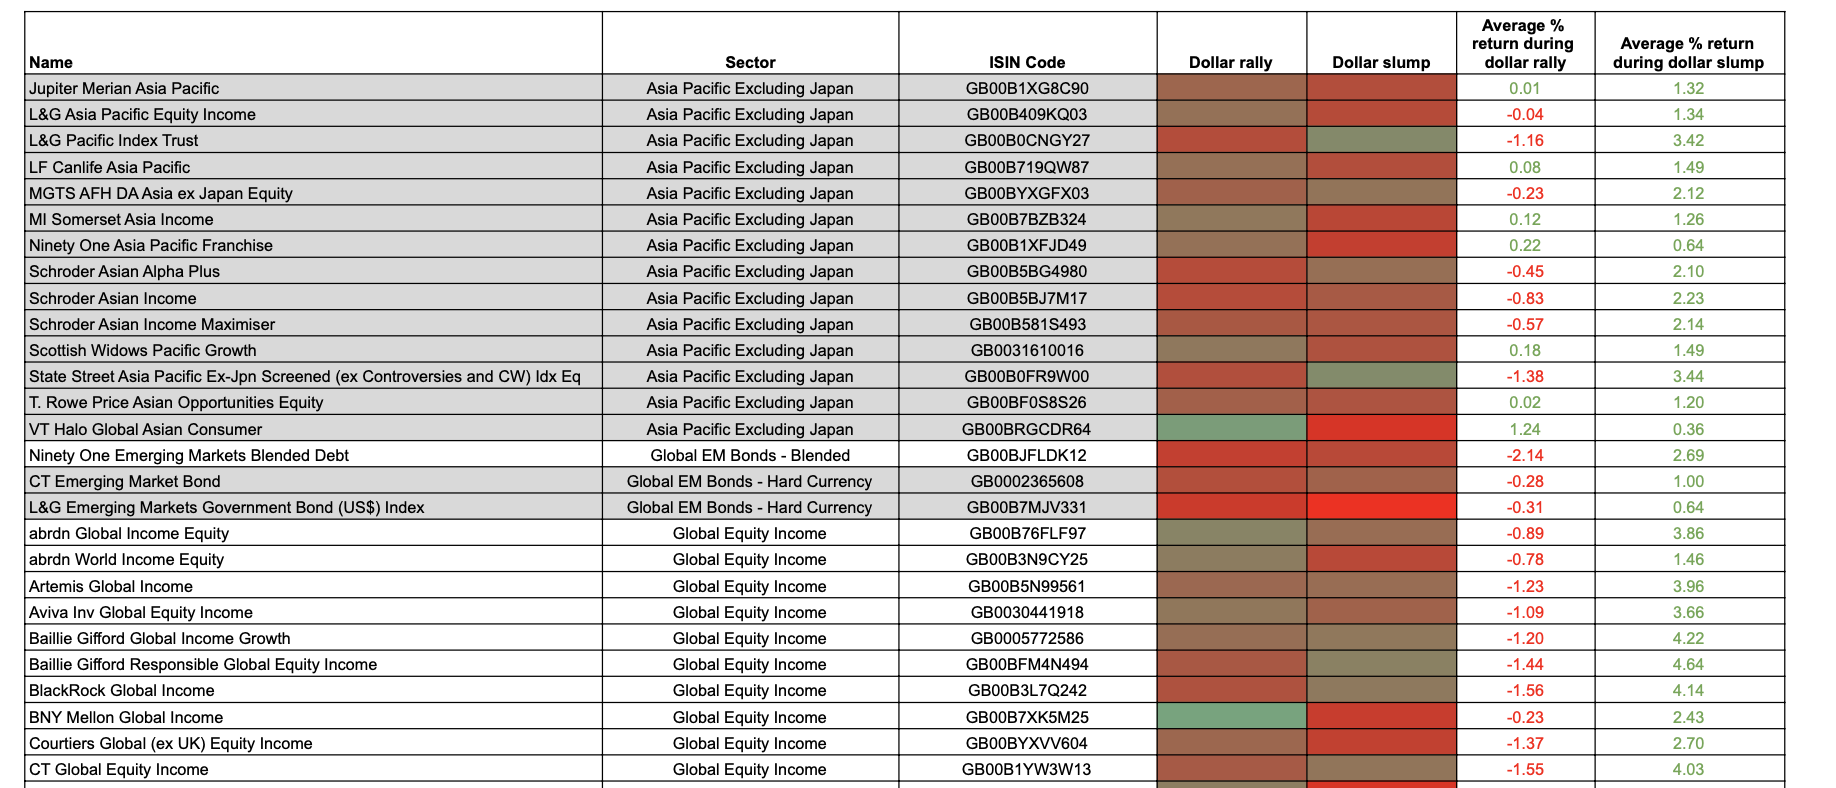
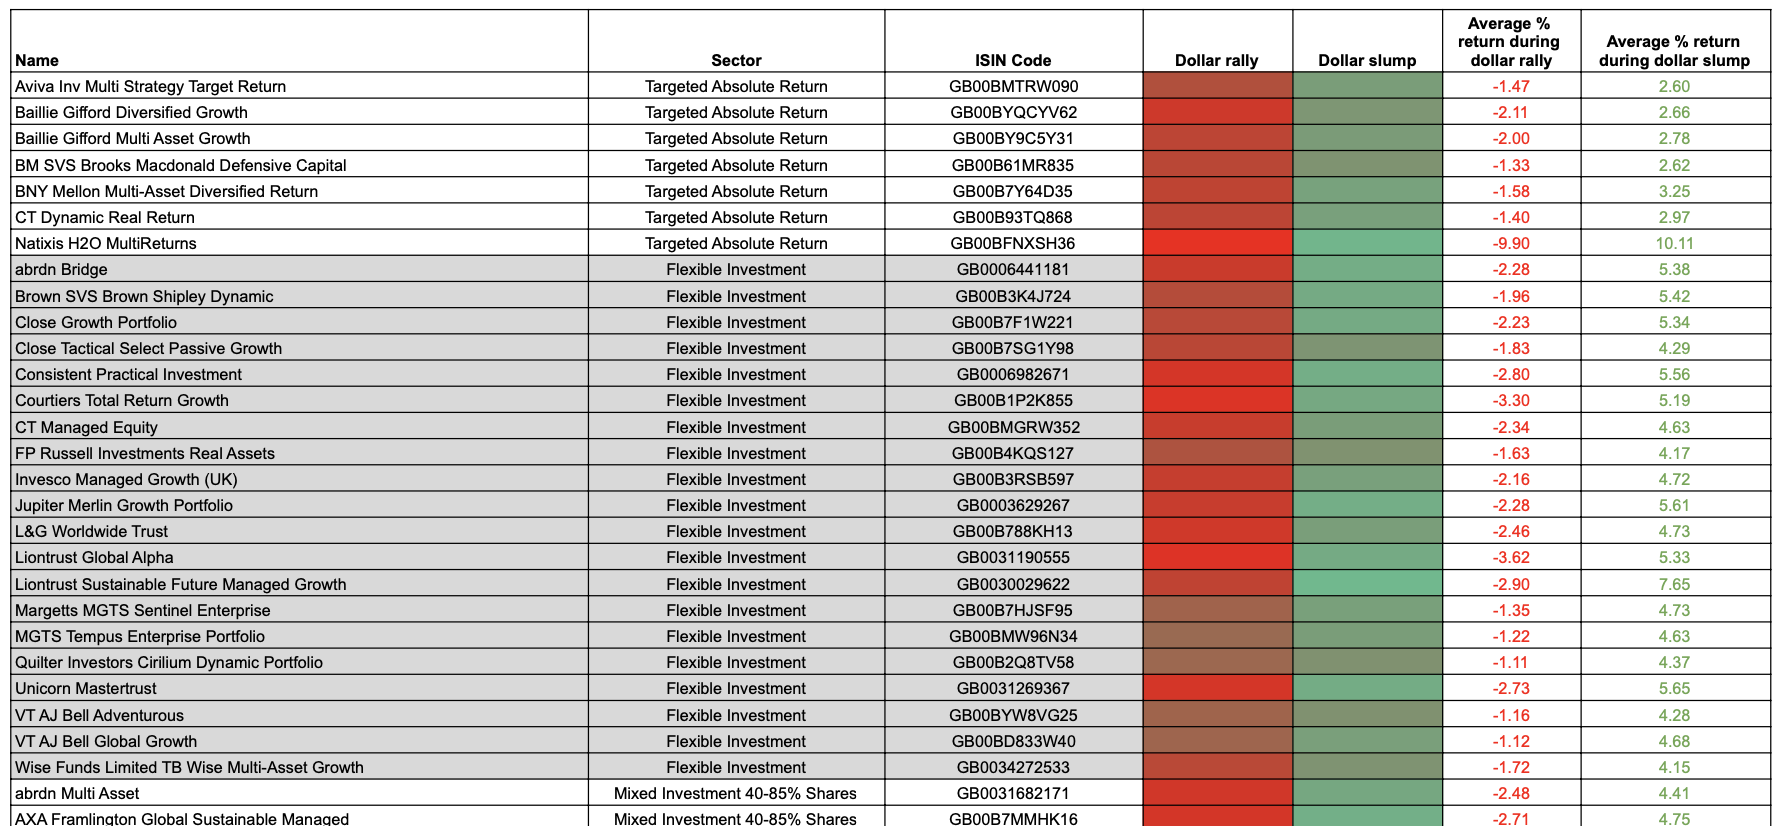
I then analysed the performance of the most popular unit trusts available to investors across over 20 different sectors to show how they are influenced by the US dollar index. The result was the three heatmaps shown below.
How to use the US dollar heatmaps
The first heatmap includes all the funds analysed. The colour-coded columns show the relative performance of a fund, versus its sector peers, during a period when the dollar rallies and a period when the dollar slumps. Green indicates that a fund outperformed its sector peers during the period (i.e. dollar rally or a dollar slump) while red signifies underperformance. The final two columns show the average performance during the periods of sharp dollar strength and weakness which typically lasted 2 weeks.
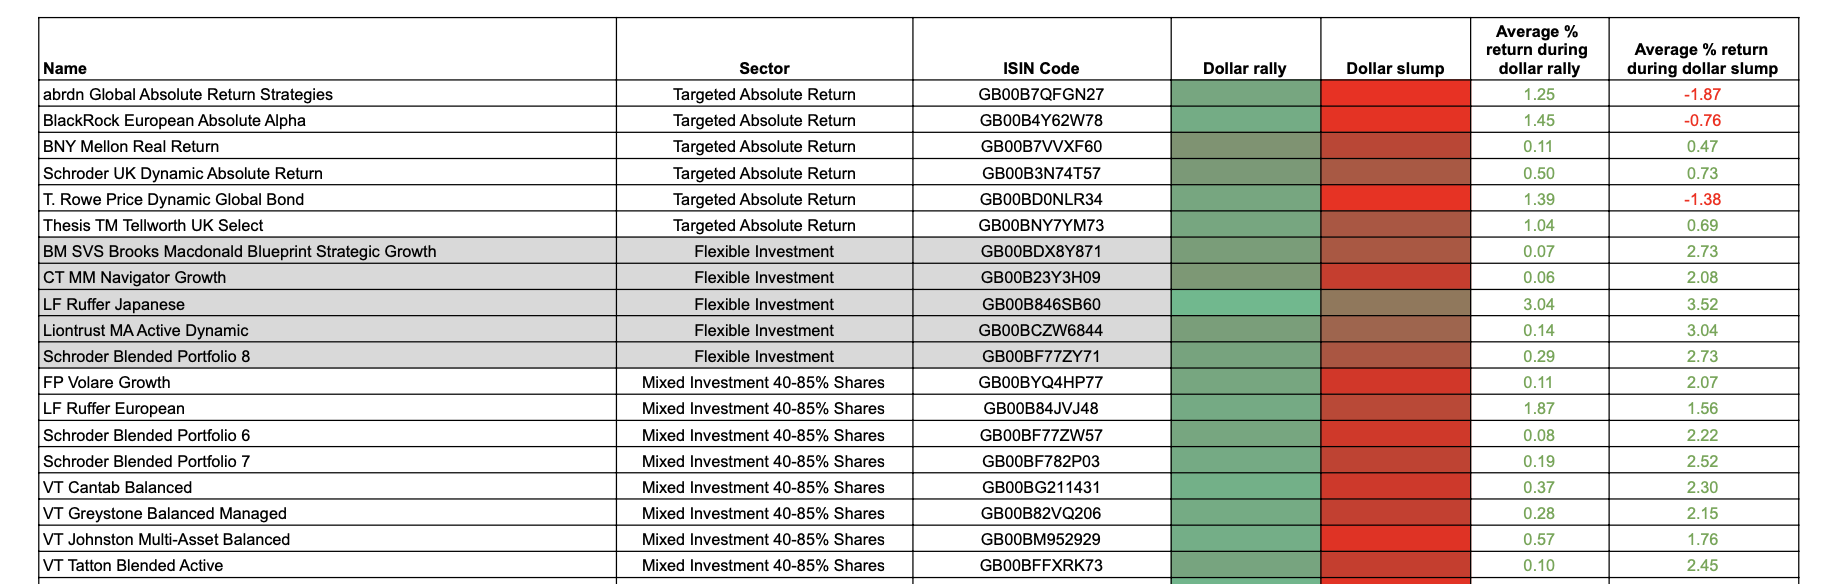
The second chart is a subset of the first chart highlighting those funds that performed well during a rally in the US dollar index. You can see that each has a strong green colour during a dollar rally, but a strong red colour during a period of dollar weakness. That shows the positive correlation these funds have with the US dollar index. Also, each of these funds made a positive return during periods of dollar strength.
The final chart is, again, a subset of the first but highlights those funds that performed well during a slump in the US dollar index. You can see that each has a strong green colour during a period of dollar weakness, but a strong red colour during a period of dollar strength. That shows the negative correlation these funds have with the US dollar index. Also each of these funds made a positive return during periods of dollar weakness.
These heatmaps can help you identify how funds within your portfolio behave in relation to the US dollar index, but also help you find funds that may benefit from a dollar rally or slump. Again it is worth reiterating that this is not about taking advantage of day-to-day moves in the US dollar index, but taking advantage of more established trends in the strength of the dollar.
Fund to play the US dollar
(click on the image to open the full table)

Funds to play a US dollar rally
(click on the image to open the full table)

Funds to play a US dollar slump
(click on the image to open the full table)


£200 Pension Cashback Offer
Make a qualifying deposit or transfer a pension to our partner Interactive Investor.
- Deposit or transfer a pension of at least £20k and you could earn £200 cashback
- Terms and Fees apply, Capital at risk
- New & Existing customers opening a SIPP
- Offer ends 31st July 2026
Before starting your transfer, check you won't lose any valuable benefits (such as guaranteed annuity rates or a lower protected pension age) and find out what exit fees you might have to pay
