

The 80-20 Investor stress test tool was designed to provide insight into how individual funds performed during past periods of equity market stress, typically when equity markets fell by 10% or more. Using these insights you can attempt to ascertain how funds may perform in a future market sell-off caused by similar macro headwinds.
The 80-20 Investor stress test tool allows you to analyse over 2,000 unit trust funds which makes it incredibly powerful. But a recent chatterbox question inspired this piece of research off the back of the latest stress test tool update.
An abridged version of the question is as follows:
"I’m noticing increasing thoughtful media attention to actual inflationary indicators and growing scepticisms that Central Banks may find themselves ‘ambulance chasing’ if markets generate inflationary heat which cannot be soothed by calming words. Rather than waiting for a storm to possibly break would it be sensible to offer a range of investment areas/funds etc that not only would be a ‘safe haven’ but could actually benefit from a period of inflation that may last longer than 1-2 years?"
Of course, I don't have a definitive answer to this question as I don't have a crystal ball that can determine which funds will perform the best. But the good news is that the stress test tool was updated to include the reflation scenario mentioned in the member's question. However, one limitation in using the tool to answer the above question is that you would have to analyse all 2,000 funds with the tool, in order to come up with the required insights. That just isn't feasible.
In addition, the ratings that the tool provides are sector-specific. So a 5-star fund from one sector, as determined by the stress test tool, could in theory underperform a 3-star fund from another sector. That's because the ratings are based upon relative performance. Or in other words the star ratings don't give you an idea of the actual percentage return you will get and whether investing in a particular sector is even a good idea.
In order to provide the necessary insight that the member's question requires I had to take a different approach. By applying the stress test tool methodology to the sector averages of all the major unit trust fund sectors and some additional asset types too (such as gold) I can answer the question. The result is the heatmap below (click to enlarge).
How to use the stress test heatmap
The five different scenarios are identical to those described in the stress test tool summary. At the foot of this article, I have included the full descriptions of each scenario for ease.
The heatmap below (click to enlarge) is ordered by the average return achieved by each asset class (sector average) across each of the five scenarios. So those assets that fared the best on average across all scenarios are at the top of the table. The last column tells you what that average return was during the periods of equity market stress.
Each column represents a given scenario. In each column the top performing asset is coloured bright green, while the worst performing asset is dark red. In the case of the best and worst performing assets the percentage return is also shown. It means that you can quickly see which asset types perform badly or strongly in each scenario.
So to answer the member question above, you would need to focus on the second-to-last column first of all, to ascertain the best performing assets for the reflation scenario, before reading across (and looking at the final average column) to determine which assets might also provide some element of safety in other scenarios.
Then you could look up funds from your chosen sector (either by using your fund platform's search function or the BFBS tables) and then put them through the stress test tool individually for comparison purposes.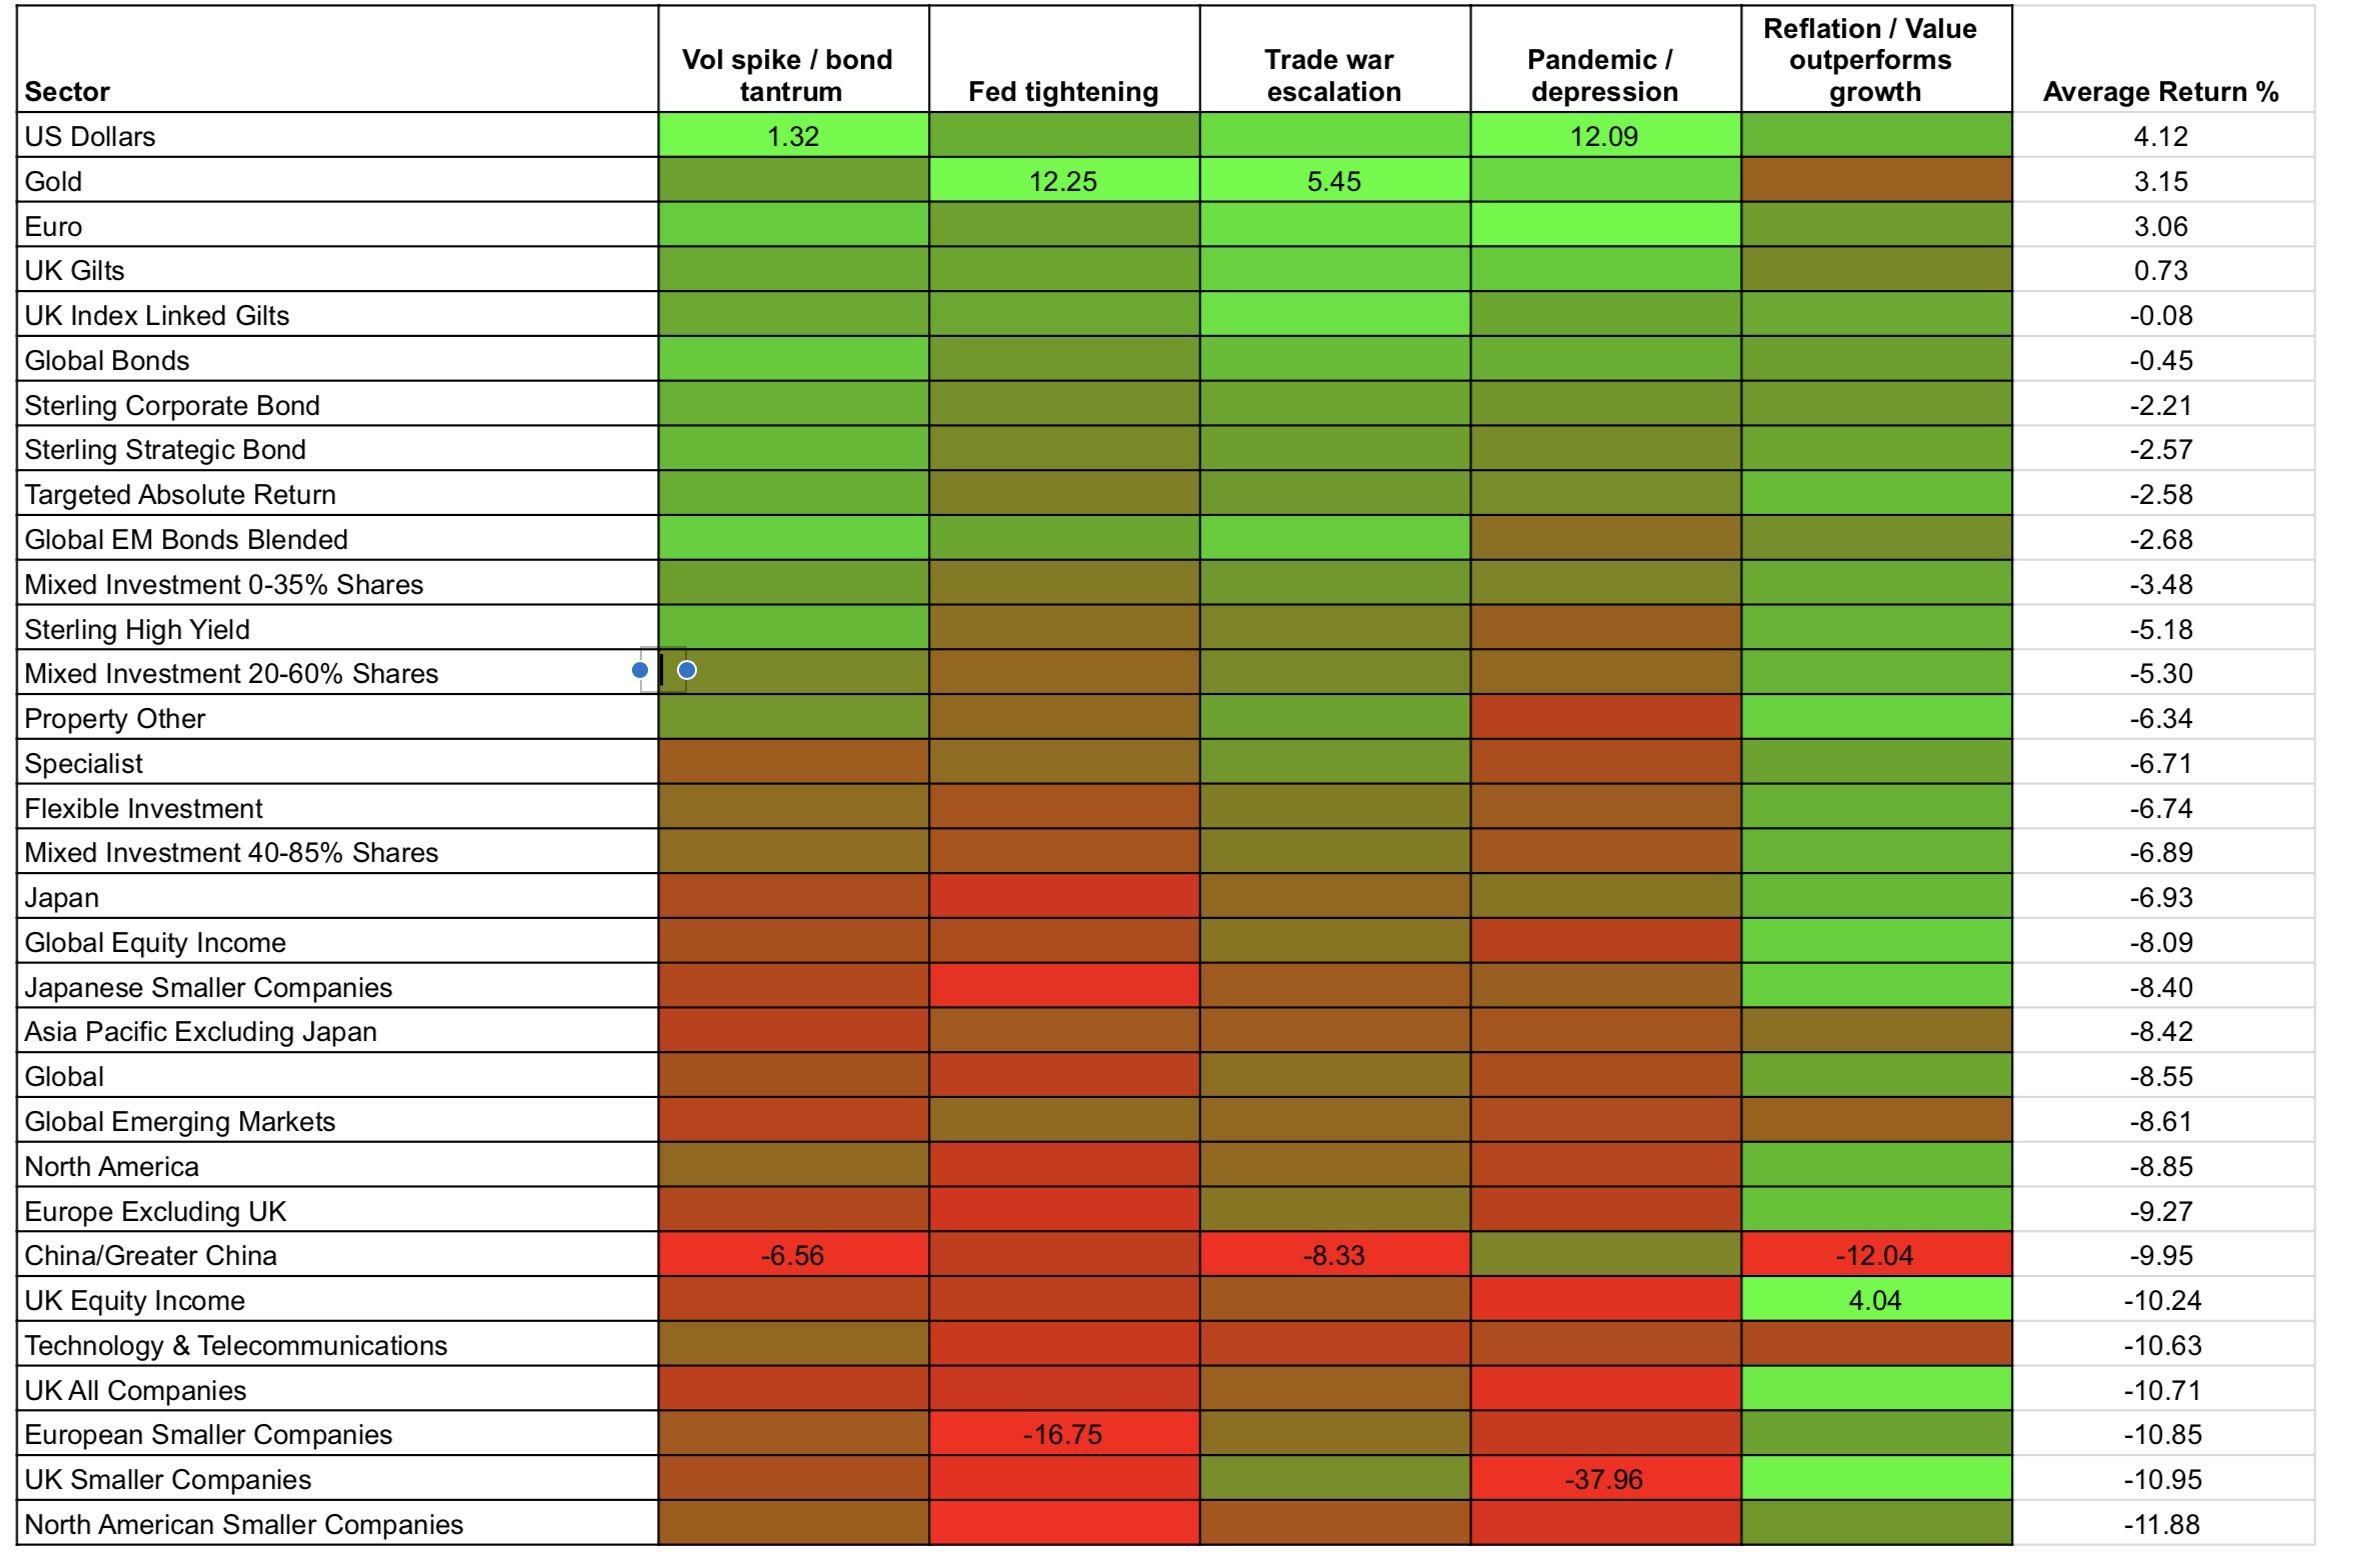
Observations
There are a number of interesting observations to be made from the above chart:
- The ordered list gives a more realistic "real world" assessment of investment risk for each asset type.
- Smaller Companies stocks are the worst performers in stressed markets.
- UK All Companies are also among the worst performers meaning that avoiding global equity exposure is a headwind in a stock market crash.
- The US Dollar is the best performing asset and is clearly a haven that investors rush to in times of crisis. Similarly, the euro performed well against the pound in all scenarios.
- Income funds (i.e. Global equity income funds) tend to outperform their non-income peers (i.e. Global funds), likely due to their focus on strong dividend-paying stocks which often come from defensive sectors.
- Japanese equities tend to fare better (although still fall significantly) than other global equity markets in a crash. This is likely due to the currency moves (stronger US dollar vs yen) which provides a tailwind for the more export-focused Japanese stock market.
- High yield bonds are the highest risk bond sector with their fortunes more aligned with equity markets than bond markets.
- Strategic bonds don't fare much better, a result of the fact that most strategic bond funds are quasi-high yield bond funds themselves.
- Global bonds almost break even, likely boosted by the strong dollar and their underlying US treasury holdings.
- UK gilts are one of the best diversifiers (something that has been backed up by my previous Perfect ISA portfolio research and the Summer portfolio research).
- Finally gold has lived up to its traditional haven asset label.
Scenarios tested
Volatility spike and bond wobble
Equity markets hit an all-time high in January 2018 at the same time that market volatility (or fear) hit historic lows. A sudden panic over rising inflation sent bond yields spiking higher amid fears that the bond bull market was about to collapse. This sparked a bond sell-off which in turn sparked an equity market correction across the globe. Stock markets globally fell by at least 10% and it represented the first stock market correction in 2 years in the developed world. This stress test looks at how a fund might outperform or underperform its peers from within the same sector if we see another spike in bond yields and equity volatility like we saw in the spring of 2018.
Fed tightening
In late 2018 global stock markets became rattled when the US Federal Reserve was intent on tightening monetary policy. By raising interest rates and talking up the prospect of unwinding its Quantitative Easing programme the Fed caused stock markets to slump globally, producing one of the worst Decembers on record. The market was ultimately saved when the Fed began loosening monetary policy again. This stress test looks at how a fund might underperform or outperform its peers from the same sector if central banks start tightening monetary policy.
Trade war escalation
With the US and China embroiled in an on/off trade war the impact on global economic growth continues to make investment markets nervous. With the tit-for-tat nature of the trade war threats there are clear winners and losers from an investment perspective (both on a sector level and an asset level). This stress test focuses on May 2019 when Donald Trump unexpectedly escalated the trade war which shook investment markets. This stress test looks at how a fund might underperform or outperform its peers from the same sector if the US-China trade war reignites/escalates.
Pandemic / depression
The coronavirus pandemic of 2020 abruptly brought to a halt one of the longest bull markets in history. The pandemic sparked the fastest bear market on record with most major stock market indices falling 30-40% in a matter of weeks. Investment markets and investors' portfolios were placed under the greatest strain in decades. But it is the impact on economic growth and corporate profits as well as the possibility of a recession turning into a depression that this scenario also stress tests. This stress test looks at how a fund might underperform or outperform its peers from the same sector if a pandemic hits, or if we encounter an unexpected slump in economic growth, be it a recession or depression.
Reflation / Value outperforms
Following the creation of a COVID-19 vaccine and the implementation of a vaccination programme in Europe, the US and the UK, economic growth rebounded strongly. The US Federal Reserve and other central banks were initially cautious about raising interest rates and removing the monetary stimulus that supported economic growth during the pandemic. Early signs of rising prices, and a lack of central bank intervention, caused investment markets to rapidly price in a significant rise in future inflation resulting in a large disparity in performance between different asset classes and investment funds. We saw a significant rotation out of growth stocks into value/cyclical stocks. That was the biggest difference between this scenario and the "Volatility Spike / Bond Wobble". In the reflation trade the market was pricing in further economic growth and stock markets remained at all-time highs, while bond yields stabilised after an initial rally. Volatility was also contained in 2021. If equity market volatility picked up and inflation spiked, along with bond yields then we might likely move into the "Volatility Spike / Bond Wobble" scenario and possibly the "Fed Tightening" scenario. This scenario is a good test of what would happen during a period of strong economic growth and rising inflation, but also which funds would fare better in an environment where value outperforms growth.

£200 Pension Cashback Offer
Make a qualifying deposit or transfer a pension to our partner Interactive Investor.
- Deposit or transfer a pension of at least £20k and you could earn £200 cashback
- Terms and Fees apply, Capital at risk
- New & Existing customers opening a SIPP
- Offer ends 31st July 2026
Before starting your transfer, check you won't lose any valuable benefits (such as guaranteed annuity rates or a lower protected pension age) and find out what exit fees you might have to pay
