

As humans, we are inherently bad investors. We are prone to emotional decision making and find it hard to stick to a process. Back in September, I wrote a piece explaining that if we want to improve our chances of making better investment decisions we need to understand how and why we make decisions, especially those concerning money. In a way, we need to be a little less human.
Loss aversion & anchoring
We all have behavioural biases which can cause us to make the wrong or illogical decisions, even if we are presented with perfect information. One way to improve our chances of outperforming the market is to accept our biases and try to counter them.
One of the behavioural biases I discussed in a recent note was loss aversion. Loss aversion describes investors' preference to avoid losses over making gains of an equivalent size. In fact, it's claimed that the pain from losses is twice as powerful as the joy from making gains. It means that if investors see their portfolio fall in value they are prone to making knee-jerk investment decisions, rather than objectively assessing the situation.
Another behavioural bias is anchoring. Anchoring is when our exposure to a number ahead of a question being asked influences our answers. In terms of investing that number can be the price at which you bought a fund or share. Or it could be the previous valuation of a fund or portfolio the last time you checked. That number then takes on increased importance and will often influence when you come to decide whether to sell or keep an investment. Behavioural biases can work together to cloud our judgement, and not just in isolation. Our bias towards loss aversion when combined with anchoring is particularly powerful.
It is, for this reason, that I suggest that long-term investors don't check their portfolio performance constantly, agonising over every minor move that markets make. But is there evidence to back up the view that obsessively checking your portfolio valuation, aside from giving you sleepless nights, can increase your chances of making a poor investment decision?
Can obsessively checking your portfolio valuation increase the chances of bad investment decisions?
I wanted to look at whether how frequently you checked your portfolio valuation, irrespective of the market conditions, actually influenced your perception, away from reality, of how well your investments were doing.
To do this I assumed that an investor had a well-diversified portfolio that has outperformed the market over the long-term. A good starting point is a fund with a mix of bond and equities. As I only wanted to backtest the impact of the frequency of valuation checks and not the influence of asset allocation the backtested portfolio had to have a constant asset allocation. The Vanguard Lifestrategy 60% Equity fund would have been an ideal candidate for this research piece but unfortunately it is not possible to obtain the historic fund prices for every day since the fund launched.
Fortunately, Vanguard has an equivalent fund in the US called the Lifestrategy Conservative Growth Fund where it is possible to get the price of the fund for every trading day since 1993. That is over 6,000 trading days. The fund has a similar asset mix to the UK version but with more focus on the US, understandably. However, that has no detrimental impact on this piece of research.
Firstly I wanted to find out what, on average, is the chance of this portfolio falling in value from one day to the next? Or in other words, what is the chance of the portfolio being down in value one day compared to when it was checked the day before. To do this I looked at every daily comparison that an investor investing in that fund could have made between 1993 and today.
Interestingly the chance of being up or down on a given day is not a 50-50 split as you would have expected. In fact, typically for a portfolio split 60% equity/40% bonds you have a 57% of your portfolio being up versus a 43% chance of it being down from one day to the next.
However, as the table below shows, the more exposed you are to equities (i.e the less diversified your portfolio is) the greater the chance of being down from one day to the next. To produce the table I used US equivalent Vanguard funds with 80% equity exposure and 40% equity exposure too.
| % Chance being up from a previous day | % Chance being down from a previous day | |
| 80% equity - 20% bond | 56 | 44 |
| 60% equity - 40% bond | 57 | 43 |
| 40% equity - 60% bond | 58.5 | 41.5 |
Clearly, while investing in equities increases your chances of greater returns in the long-term, it actually increases your chances of losing money in the short term. The above statistics are an average from 1993 and so take account of both bull and bear market scenarios. Clearly, diversification helps protect against the downside in the short-term.
If we focus on the balanced portfolio (60% equity and 40% bonds) how do these odds change if instead of checking every day we only looked at the value of our portfolio every week, for example? What about once a month?
I crunched the numbers for every time frame for checking the value of a portfolio, from every day up to every 365 days. That took an incredible 6.6 million calculations. Don't forget we are talking trading days (i.e Monday to Friday). The sheer volume of data is too much to put here but the table below provides a summary of the impact for the 60% equity/40% bond portfolio.
| Trading days since last checked portfolio value | % chance of being up | % chance of being down |
| 1 | 57.00% | 43.0% |
| 5 | 57.50% | 42.50% |
| 10 | 59.10% | 40.90% |
| 20 | 60.70% | 39.30% |
| 40 | 62.90% | 37.10% |
| 60 | 66.30% | 33.70% |
| 120 | 72.20% | 27.80% |
| 188 | 76.00% | 24.00% |
| 240 | 74.30% | 25.70% |
| 300 | 74.70% | 25.30% |
| 360 | 74.60% | 25.40% |
Now imagine there are two people, person A and person B. Person A invested in the 60% equity fund above as did Person B. Both held onto the fund for the same period of time (indefinitely). At any given moment both will have achieved the exact same return as they have held the exact same investment.
But imagine that Person A checks his portfolio every day while Person B checks his every six months (120 trading days). For person A, 42% of the time when he checks his portfolio it will be down from the last time he checked it. Yet for Person B it will only be down 27% of the time compared to the last time he checked. Person A is much more likely to make an irrational decision, due to loss aversion and anchoring, versus Person B despite them receiving exactly the same return over the period. They hold the same fund remember.
A picture paints 6.6 million calculations
Below I chart the chances of subsequent portfolio valuations being higher in value than the previous valuation against the frequency at which the valuation is checked (ranging from every day to every 365 trading days between valuation comparisons). I have charted this for each of the three portfolios mentioned earlier. The blue line is the portfolio with 40% equity exposure, the red line has 60% equity exposure while the yellow line has 80% equity exposure. To produce this chart required an incredible 6.6million data calculations!
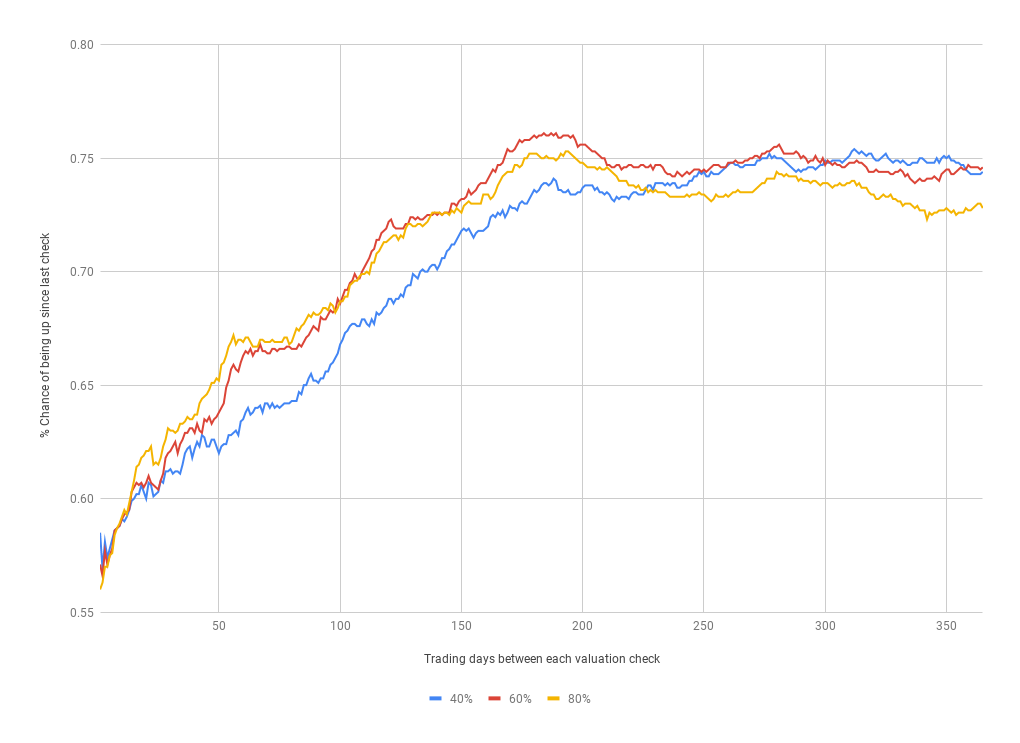
The shape of the chart isn't quite what I had expected. I would have imagined an almost diagonal line from the bottom left to the top right, based on the fact that assets tend to rise over time, in part due to inflation, so the more infrequent the valuation comparisons the more likely that the latter valuation is higher than the prior one.
The chart shows that the odds of your subsequent valuations being higher than the previous one rise rapidly as we approach the 60-day lookback (i.e comparing valuations every three months - each month has 20 trading days). The rate of increase is even more marked when you have a higher equity allocation in your portfolio. The curve then flattens before steepening again between 90 days and approximately 120 days (i.e. comparing portfolio valuations every 6 months).
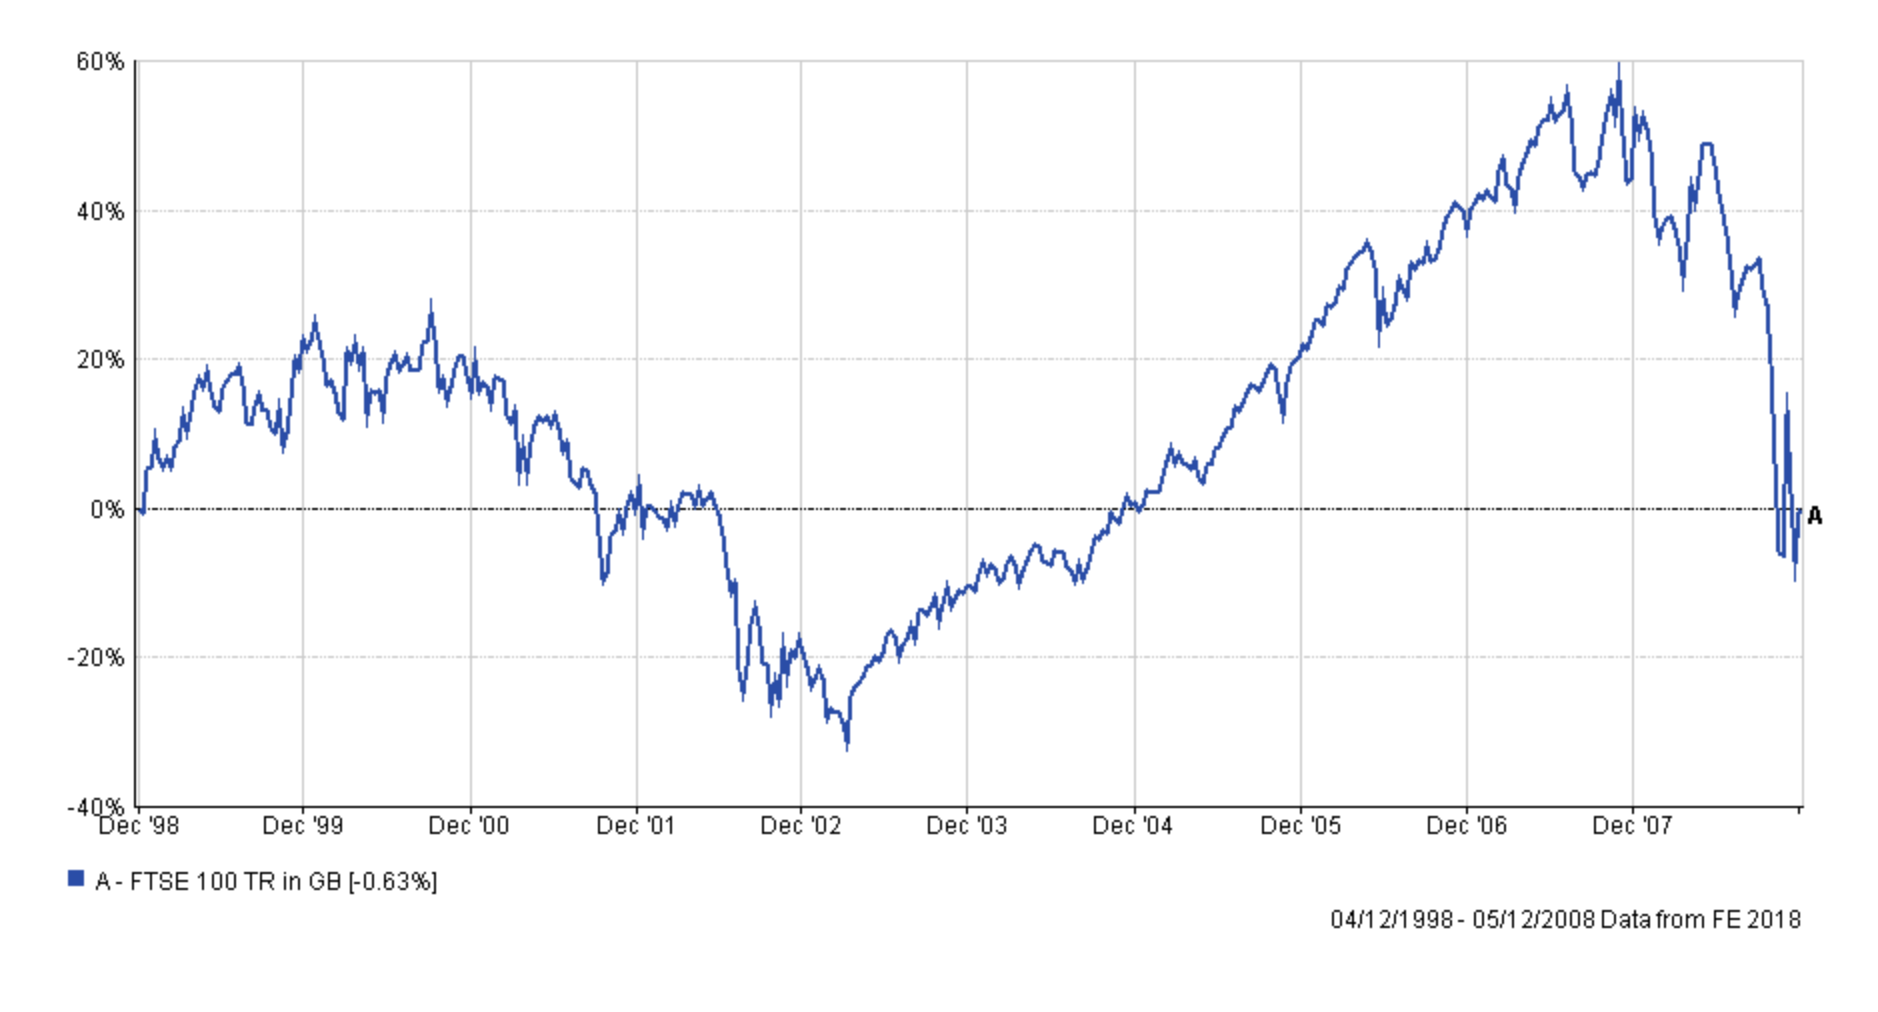
Interestingly beyond 180 trading days (i.e checking your portfolio value every 9 months) the odds of your valuation being higher than the previous one start to reduce, and certainly don't improve. That seems somewhat counterintuitive but the facts don't lie. Perhaps the reason is that as the time between valuations increases so too does the likelihood of changes in underlying investment trends or economic cycles. By way of example, the chart below shows the total return on the FTSE 100 from 1998 to 2008 (just after the financial crisis lows). It is an extreme example but in this instance, if an investor only checked the value of their portfolio every 10 years (i.e. at the start and at the end of this chart) then they would have only seen the loss of -0.63% and been totally unaware of the huge profits they had made at one point and the size of their paper loss. However, during the period shown in the graph we had the dotcom bubble burst, a bear market, a bull market, the financial crisis and the ensuing recession. The investment backdrop and economic cycles had fundamentally changed.
By contrast, if you check your valuations every 9 months or more frequently the chances are far higher that both valuations will have been made within the same market phase and economic cycle. By contrast evaluating your portfolio too frequently (i.e monthly or weekly) means that pure chance plays a larger role in determining whether your portfolio is up or down since the previous time that you checked (the odds are much closer to 50-50).
Interestingly the earlier chart suggests that the 'multi-year cycle' effect is reduced the more diversified your portfolio (look at how the blue line in the earlier chart doesn't eventually dip, like the red and yellow lines. In other words if between December 1998 and December 2008 (the time period shown in the chart immediately above) you had invested in a mix of bonds and equities (and not just equities) you would have had a greater chance of finishing in profit.
The lessons learned
First the lesson for financial advisers is don't send out valuations to clients more frequently than every year. If valuations are only sent out every year, then depending on the portfolio mix, you have around a 75% chance that what you present to them will be higher than last year by doing nothing (i.e just buying and holding the same funds). Perhaps it's no coincidence that financial advisers seldom send valuations more frequently than once a year.
From a long-term DIY investors the key takeaways are that if you check your portfolio too frequently (daily or weekly) then chance plays a significant part in determining whether you are up or down. This combined with the human tendency toward risk aversion and anchoring actually increases your chances of making an emotional decision influenced mostly by chance. That is a bad investment decision.
Also the longer the time frame between each time you check your portfolio's value, your perception of market volatility is reduced. For someone checking their portfolio every day then by the time they get to day 5 (their 5th check) the chances are they will have noted 2-3 down days. By the time someone who checks their portfolio valuation every 188 days finally gets to their 5th check (after two and half years) they will only likely have experienced one valuation where the value is below that of a previous one (there is just a 24% chance of it). In both scenarios, the investors would have achieved the same return as they have the same portfolio (as we've assumed) for the same period of time (indefinitely). But their perceptions of how well they are doing will have differed.
So how does this all fit in with regularly reviewing a portfolio in view of making changes? Sticking to a process that regularly reviews the worthiness of a fund's inclusion is different to constantly checking its value, the latter encourages anchoring.
One way to counter anchoring and loss aversion is rather than focusing on the price you bought at (i.e. the profit/loss) or the current valuation instead focus on whether, given the current information available, the investment represents a better or worse option than an alternative. This will mean that you will make the decision of whether to keep the investment without the emotional pulls from loss aversion and anchoring. You will notice that when I review my own £50,000 portfolio I never reference the starting price at which I bought a fund. I never focus on the profit/loss when making a decision. Occasionally I may show a chart highlighting whether a fund choice was profitable or not but principally I do this to demonstrate that I do sell funds at a loss as well as a profit. The point is that any choice of whether to change a fund is not triggered by me checking the value of my portfolio. Of course it does mean that I will sometimes sell a fund at a loss. Selling a fund at a loss is not ideal but it is important to accept that you won't get every investment decision right. Be humble. The aim is to get more right than you get wrong.
I review my portfolio monthly as I have to as part of my transparency with 80-20 Investor. However, I regularly hold funds for months at a time and seldom chop and change from month to month. Also, I base my investment choices on the 80-20 Investor algorithm which has a look back period of at least 6 months. So it is not based upon daily or weekly valuation changes.
In summary, obsessively checking portfolio moves, especially on a daily basis, statistically increases your chances of making bad investment decisions. because of our inbuilt behavioural biases. It's not about burying your head in the sand. It's about sticking to an objective review process that reduces the emotional influence of anchoring and loss aversion. Also if market volatility makes you nervous you should reduce your investment risk or (assuming you are happy with your portfolio) check the value of your portfolio less often.

£200 Pension Cashback Offer
Make a qualifying deposit or transfer a pension to our partner Interactive Investor.
- Deposit or transfer a pension of at least £20k and you could earn £200 cashback
- Terms and Fees apply, Capital at risk
- New & Existing customers opening a SIPP
- Offer ends 31st July 2026
Before starting your transfer, check you won't lose any valuable benefits (such as guaranteed annuity rates or a lower protected pension age) and find out what exit fees you might have to pay
