

It's the start of the month so I once again updated the 80-20 Investor Best of the Best fund selection using our unique algorithm. In this article I will:
- show you how the Best of the Best Selection fared in March
- highlight the Best of the Best funds from March that have once again made the grade to appear in April's Best of the Best fund selection
- show you by how much the Best of the Best Selection has outperformed the market since inception in August 2014.
80-20 Investor Best of the Best fund performance - March 2015
Periodically I update subscribers on how they might have fared if they had bought the Best of the Best funds versus the average managed fund as well a the FTSE 100.
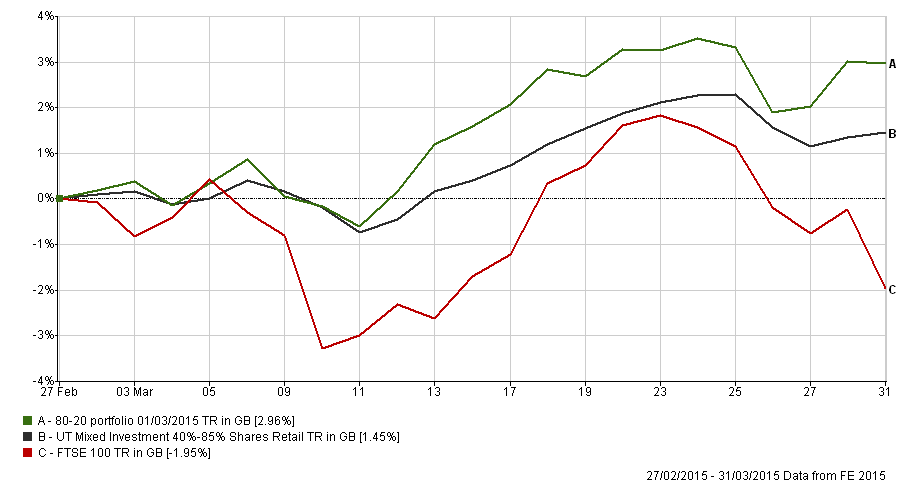
March was a good month for the Best of the Best fund selection as shown by the chart below (click image to enlarge).
The Best of the Best fund selection (the green line) is up almost 3%, twice that of the average managed fund (the black line) while the FTSE 100 fell almost 2% (the red line).
In fact every single fund within the Best of the Best selection made money last month as shown in the table below - in part because yet again the selection had no exposure to the UK. The top performers were those funds invested in Japanese and Chinese equities.
| Fund | Total return in March |
| Henderson - Japan Opportunities | 6.9 |
| Threadneedle - China Opportunities | 6.54 |
| Henderson - China Opportunities | 6.07 |
| Schroder - Global Healthcare | 5.65 |
| VT - De Lisle America | 5.55 |
| M&G - Japan | 5.1 |
| M&G - Global Real Estate Securities | 4.6 |
| Artemis - Global Select | 4.32 |
| Threadneedle - European Select | 4.17 |
| M&G - Episode Macro | 4.15 |
| Jupiter - European | 4.06 |
| Fidelity - American Special Situations | 3.81 |
| AXA - Framlington Global Technology | 3.08 |
| 7IM - Unconstrained | 2.46 |
| Cavendish - Technology | 2.12 |
| Aberdeen - Property Share | 1.99 |
| JPM - Cautious Managed | 1.9 |
| 7IM - Sustainable Balance | 1.85 |
| Thesis - TM New Court | 1.8 |
| Fidelity - Multi Asset Strategic | 1.66 |
| Fidelity - Multi Asset Defensive | 1.53 |
| Aberdeen - European Property Share | 1.53 |
| L&G - Global Technology Index | 1.14 |
| Close - Select Fixed Income | 0.97 |
| Premier - Pan European Property | 0.93 |
| Fundsmith - Equity | 0.92 |
| HC KB - Enterprise Fixed Income | 0.66 |
| Ignis - High Income Bond | 0.35 |
| Jupiter - Distribution | 0.12 |
So which have made the grade and remain in April's 80-20 Best of the Best selection?
17 funds from last month's selection of 30 make it into April's top selection, namely:
- 7IM - Sustainable Balance
- 7IM - Unconstrained
- Aberdeen - European Property Share
- Artemis - Global Select
- Fidelity - American Special Situations
- Fidelity - Multi Asset Defensive
- Fundsmith - Equity
- Henderson - China Opportunities
- Henderson - Japan Capital Growth
- Ignis - High Income Bond
- JPM - Cautious Managed
- Jupiter - European
- M&G - Global Real Estate Securities
- M&G - Japan
- Premier - Pan European Property
- Schroder - Global Healthcare
- Threadneedle - China Opportunities
Interestingly Jupiter European has been downgraded to a medium risk fund from high risk by our algorithm. It is a brilliant example of how our classifications take into account how a fund's returns are made and the current market conditions. No other fund classification system out there does this.
80-20 Investor Best of the Best fund performance - since inception August 2014
To make the comparison I have assumed that an investor bought all of the 80-20 Best of the Best funds in equal measure and switched them every month. The chart shows the level of outperformance since we began tracking the 80-20 Investor Best of the Best selection back in August 2014. The 80-20 selection is up 13.83% (green line) versus 9.53% for the average managed fund (black line) and 3.95% for the FTSE 100 (red line).
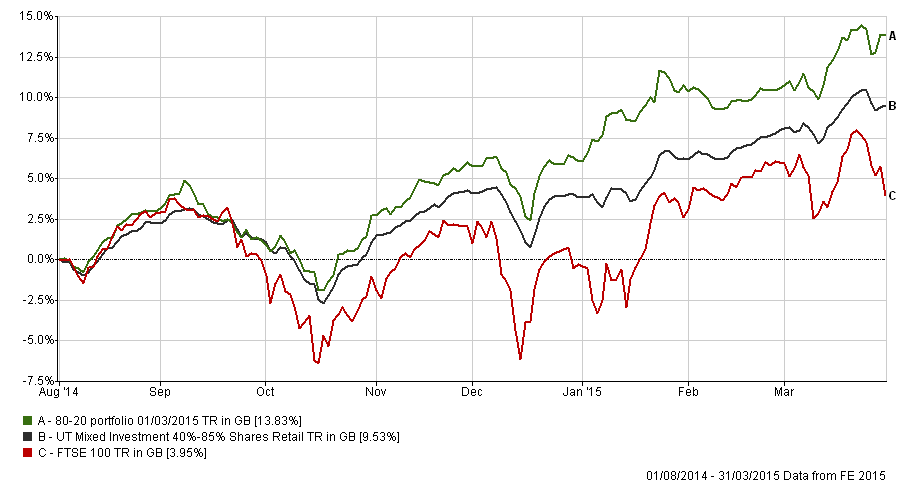
That is a huge outperformance in just 8 months.
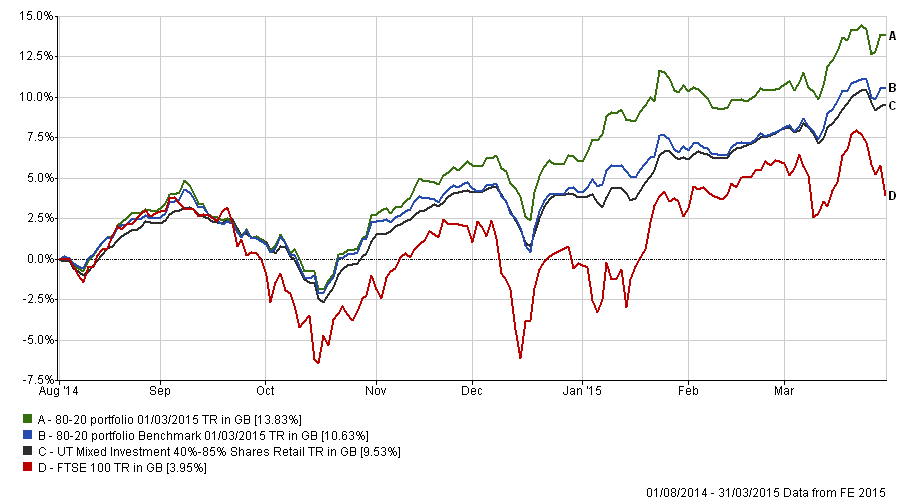
However, some may claim that the average managed fund may not invest in the same assets as the 80-20 fund selection and that the comparison might be unfair. So below I have replicated the chart above and this time added in another benchmark, the blue line. This is the return you would have got just simply by following the asset allocation of the 80-20 Investor selection (i.e buying the same proportion of Japan funds, US funds etc). It uses the returns from the average fund in each of the relevant sectors. What it shows is that it marginally outperforms the average managed fund. Yet more importantly it shows the power and importance of picking the right funds within each sector, demonstrated by how much the 80-20 portfolio line is above this benchmark.
Long may this outperformance continue!
All performance figures are net of fund charges. The material in any email, the MonetotheMasses.com website, associated pages / channels / accounts and any other correspondence are for general information only and do not constitute investment, tax, legal or other form of advice. You should not rely on this information to make (or refrain from making) any decisions. Always obtain independent, professional advice for your own particular situation. See full Terms & Conditions and Privacy Policy
Neither MoneytotheMasses.com/80-20 Investor nor its content providers are responsible for any damages or losses arising from any use of this information. Past performance is no guarantee of future results.
Funds invest in shares, bonds, and other financial instruments and are by their nature speculative and can be volatile. You should never invest more than you can safely afford to lose. The value of your investment can go down as well as up so you may get back less than you originally invested.
Information provided by MoneytotheMasses.com/80-20 Investor is for general information only and not intended to be relied upon by readers in making (or not making) specific investment decisions.
Appropriate independent advice should be obtained before making any such decisions. Leadenhall Learning (owner of MoneytotheMasses.com/80-20 Investor) and its staff do not accept liability for any loss suffered by readers as a result of any such decisions.
The tables and graphs are derived from data supplied by Trustnet. All rights Reserved.

£200 Pension Cashback Offer
Make a qualifying deposit or transfer a pension to our partner Interactive Investor.
- Deposit or transfer a pension of at least £20k and you could earn £200 cashback
- Terms and Fees apply, Capital at risk
- New & Existing customers opening a SIPP
- Offer ends 31st July 2026
Before starting your transfer, check you won't lose any valuable benefits (such as guaranteed annuity rates or a lower protected pension age) and find out what exit fees you might have to pay
