

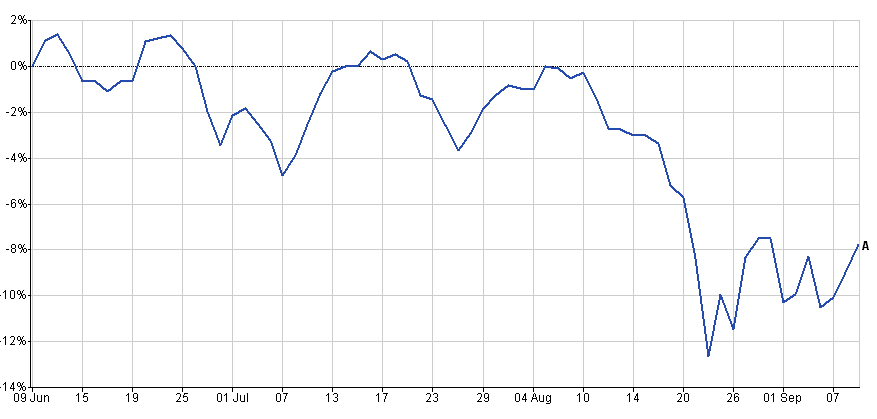
In recent weeks we've seen an incredible amount of volatility in stock markets. When I say volatility I am talking about the wild market swings up and down. The chart below shows just how much the FTSE 100 plummeted last month (click to enlarge).
We've not seen levels of volatility like this since the dark days of the financial crisis back in 2008. As a DIY investor it certainly hasn't been a comfortable ride. The harsh reality is that increased volatility is here to stay, for a while at least. After last month's sell-off stock markets stabilised, albeit at much lower levels, yet the underlying causes for the sell-off remain. A slowing Chinese economy and an impending interest rate hike in the US are still giving stock markets the jitters.
But you don't have to accept volatility. There are measures that you can take to protect your portfolio from the increased levels of volatility.
Hedging out volatility from your portfolio
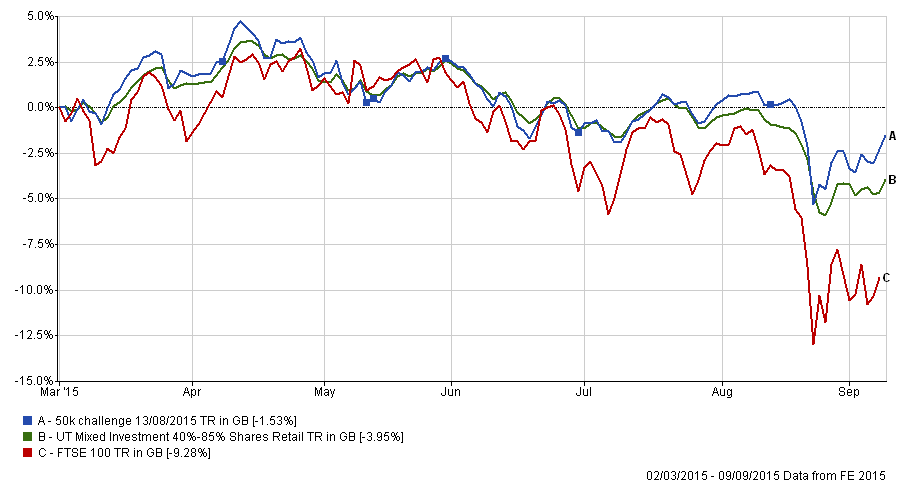
Personally I am sanguine about volatility in investment markets. 80-20 Investor has a momentum strategy at its core. That means that it surfs the wave of the latest trends. Markets don't just go up in a straight line. Trying to make money in a flat market is like trying to surf in a calm sea. I previously explained the power of investment process in turbulent stock markets and the chart below shows how well my £50,000 portfolio (blue line) has fared versus the average managed fund (green line) and the FTSE 100 (red line)
Volatility creates opportunity and it is important to look beyond short term volatility by sticking with a proven investment process such as 80-20 Investor. Yet extreme volatility isn't helpful especially as it is unpredictable. So below I highlight ways in which you can attempt to immunise your portfolio from volatility, from the very simple methods to the more advanced.
Hold cash & rebalance
Having less money in the game will clearly reduce the volatility of your portfolio. For example lets say your portfolio is completely invested in a FTSE 100 tracker. If you want to halve the volatility of your portfolio then moving 50% of your portfolio into cash will achieve that in the very short term. Yet the problem is that beyond the short term, in extremely volatile markets, you would need to keep rebalancing your portfolio to ensure that volatility remains where you want it to be. As equity markets bounce up and down their share of your portfolio changes.
Diversify in the right way
By investing in different types of assets and different markets within each asset class you can diversify your portfolio and reduce volatility. The theory is that not all assets will move in the same direction. When investors sell one type of asset, perhaps through fear, they will buy another, perhaps for safety. There will always be winners and losers so some assets will move in opposite directions to others.
Of course reality doesn't always behave in the way you would like. For example after the financial crisis assets generally became more correlated. That meant previous conventional wisdoms no longer hold true in the same way they had previously. So what should you actually invest in to diversify your portfolio?
Well interestingly the answer lies within a previous piece of 80-20 Investor research that I published called 'The Perfect ISA portfolio revealed'. In that particular piece of research I built a portfolio that:
- made money every tax year since the last market peak back in 2000
- and did not lose money
- It had outperformed a FTSE 100 Index tracker even though
- the asset allocation had remained constant throughout that time
I tested every combination of assets from a wide range of sectors including:
- Asia Pacific Excluding Japan
- China/Greater China
- Europe Excluding UK
- European Smaller Companies
- Flexible Investment
- Global Bonds
- Global Emerging Market Bond
- Global Emerging Markets
- Global Equity Income
- Global
- Japan
- Mixed Investment 0%-35% Shares
- Mixed Investment 20%-60% Shares
- Mixed Investment 40%-85% Shares
- Cash
- North America
- North American Smaller Companies
- Property
- Sterling Corporate Bond
- Sterling High Yield
- Sterling Strategic Bond
- Technology & Telecoms
- UK All Companies
- UK Equity Income
- UK Gilts
- UK Index - Linked Gilts
- UK Smaller Companies
The number of possible combinations of the above is almost mind-blowing. In fact it took me two full days to analyse and find the optimum asset mix.
The optimum asset mix turned out to be:
- 9% cash
- 71% UK Gilts
- 20% UK Equity Income
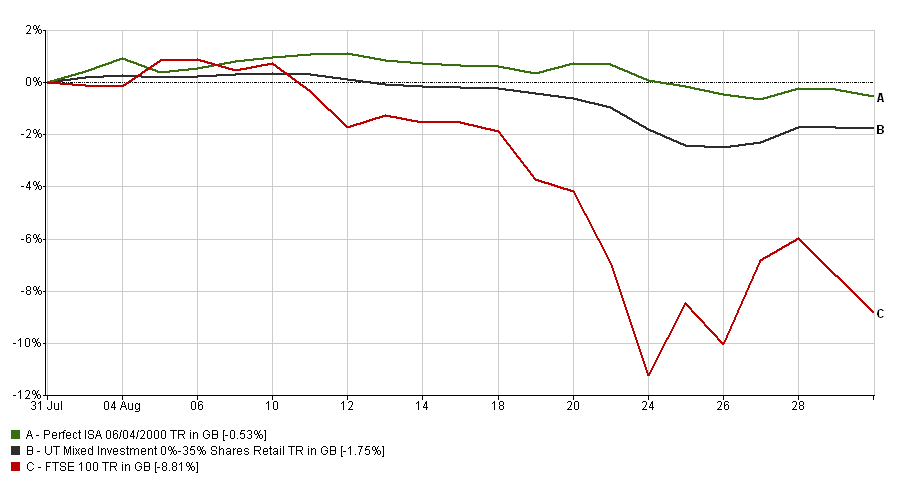
The fact that I focused on tax years is irrelevant. The chart below shows the volatility of such a portfolio (the green line) during the market sell-off in August vs the market (red line). I have also included the equivalent average performance of a managed fund which has a similar bond/equity allocation as my perfect portfolio.
The actual volatility figure for the FTSE 100 was 3.23 while for the volatility figure of the Perfect Portfolio was only 0.50.
The reason why the the volatility figure is much lower than you'd expect given it's 20% exposure to equities is because a) gilts rallied in the sell-off as investors sought safety and b) equity income funds tend to be more defensive. You can see the Perfect Portfolio was actually making money during the sell-off. That is quite incredible. It was only as the market panic settled that these gains were pared.
Buy gold?
There is a conventional wisdom that you should buy gold in times of market turmoil. This is a topic I covered in depth in my 80-20 Investor research piece titled 'Should you ever invest in gold? If so how much?'.
The key point to take from the research is that:
Gold it is not a fool-proof hedge against market falls. Neither is it a complete hedge against volatility as if you hold more than 25% of your portfolio in gold you actually increase a typical portfolio's volatility.
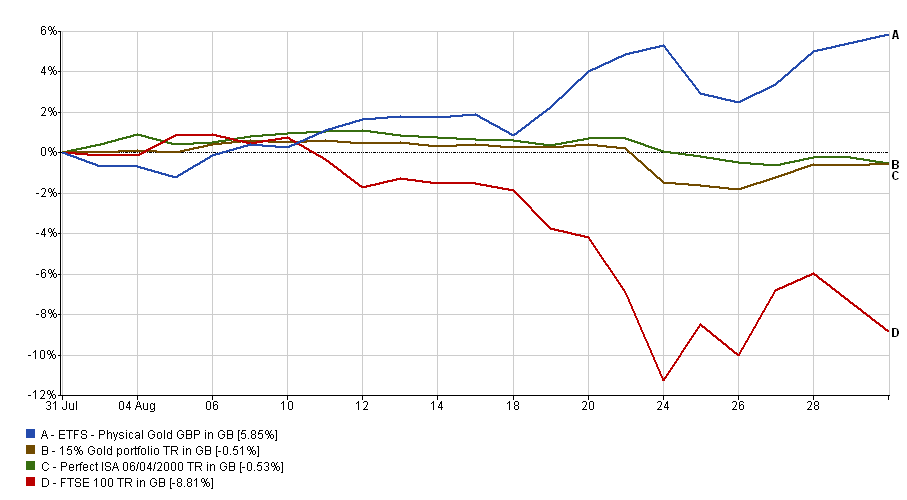
However gold does well when everyone is in complete disarray and in fear of complete financial meltdown - as it was in August. The chart below shows how physical gold performed during the August sell-off.
Holding gold in a market that is not in the grip of fear is painful. Based on my research you should only buy gold to protect yourself from Armageddon but then don't hold more than 5-10% if you plan to hold it for the long term. The key point to remember is that if you hold more than 25% of your portfolio in gold you will end up increasing your portfolio's volatility.
Interestingly if you'd replaced the cash in my Perfect Portfolio with gold then the performance over the last months of both portfolios would have been:
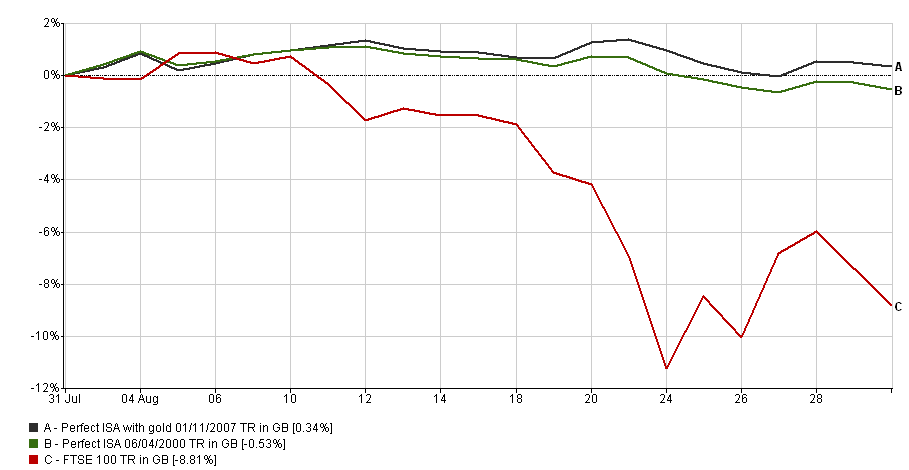
Yet the portfolio with gold is statistically more volatile over the long term (going back to 2007 which is as far as we have data for the gold ETF I've used) . So if you really want to reduce volatility stick with cash. But perhaps if you don't mind a touch more volatility then a small gold weighting (less than 10%) instead of cash will do the trick. To gain gold exposure use an ETF that physically holds gold such as the ETFS Metal Securities Ltd Physical Gold.
Of course the above Perfect Portfolio is based on the average performance of the all the funds within the UK Equity Income sector and the UK Gilt sector. If instead you used 80-20 Investor to select the very best funds within those sectors you would increase the chances of greater outperformance even further.
Ditch the trackers?
The use of cheap tracker funds has exploded. Investors are often told that actively managed funds (i.e non-tracker funds) don't outperform the market over the long term. The truth is that sometimes trackers outperform and sometimes actively managed funds outperform.
Yet this hasn't stopped DIY investors buying cheap trackers en masse with a view to holding them indefinitely. Those with significant holdings in FTSE 100 trackers would have seen their wealth fall by over 10% last month. Of course 80-20 Investor is the very antithesis of using a buy and hold strategy which is why it outperforms.
The problem with using a buy and hold strategy with trackers is that you are at the whim of the index you track. However I realise that some people will still like to use a buy and hold strategy based around index trackers within a portion of their portfolio.
If you are looking for a buy and hold tracker fund for the long term then you need one that will weather the market sell-offs and volatility as well as provide upside potential. The standout fund for those wanting upside potential while limiting the downside is Vanguard - LifeStrategy 20% Equity as I highlighted back in December 2014 in my 80-20 Investor research piece 'Funds to ‘buy & forget’ in 2015 & the Perfect Portfolio'. A sign of good research is when it stands the test of time as per this piece. The fund has shown an incredible lack of volatility and consistency of return during unpredictable market conditions. For example, during last month's market rout which saw the FTSE 100 tumble over 12% the Vanguard fund fell by around 2%. The fund is passively run and packed full of index trackers with around 20% exposure to equities with the rest in fixed interest. The fund benefits from being globally diversified as well.
Interestingly it also backs up the previous section about diversifying as the asset allocation of 20% equities to 80% fixed interest reflects that of my Perfect Portfolio.
Go low beta
As an 80-20 Investor member you will have read my explanations about looking at correlations between assets and funds. The correlation analysis that I do is easy to understand yet very complex to carry out. That is because I have to calculate the statistical correlation between the funds that I am looking at.
However there is a statistic which is published by fund managers which tells you how correlated their returns are to the index they have chosen to use as their benchmark, All funds within the sector don't have to use the same benchmark. This is a bit of an irritation for me because it means that funds managers can theoretically pick any benchmark they like in order to make themselves look good. They can even change it.
In reality most funds within the same sector, especially those investing in equities, tend to use the same standard benchmarks such as the FTSE All Share.
Beta measures a fund’s sensitivity to the general market in which it operates. The market always has a beta of 1 by definition. So if a fund also has a beta of 1 that would mean that if the market rose by 5% then so should the fund. If the fund has a beta of -1 then as the market rises so the fund falls. A well-managed index fund will have a beta of exactly 1. Funds that outperform the market when it does well but do even worse when the market is going down will have a beta above 1.
So if during volatile markets you chose funds with low a beta score then you will reduce the volatility of your portfolio while still being invested in the market. The table below contains a list of funds with lower than usual beta scores from 5 key equity sectors.
The first thing you will notice is that a a large number either are in (or recently have been in) the 80-20 Investor Best of the Best or Best by Sector sections.
This makes sense because the 80-20 Investor algorithm screens out volatility and looks for good risk adjusted returns (i.e. steady upward trends). As markets become increasingly volatile so these low beta funds come to the fore. So it is great to see that the 80-20 Investor algorithm is automatically reducing volatility as it was designed to do.
| Fund | Beta | Sector | Benchmark used |
| Artemis - European Growth | 0.62 | Europe Excluding UK | FTSE World Europe EX UK |
| Argonaut - FP Argonaut European Income | 0.65 | Europe Excluding UK | MSCI Europe ex UK |
| Invesco Perpetual - European Opportunities | 0.67 | Europe Excluding UK | IA Europe (ex UK) Sector |
| Argonaut - FP Argonaut European Enhanced Income | 0.7 | Europe Excluding UK | MSCI Europe ex UK |
| Neptune - Japan Opportunities | 0.62 | Japan | Topix |
| AXA - Framlington Japan | 0.79 | Japan | FTSE World Japan |
| CF Canlife - North American | 0.74 | North America | MSCI North America |
| FP - Miton Undervalued Assets | 0.5 | UK All Companies | FTSE All Share |
| Fidelity - UK Opportunities | 0.62 | UK All Companies | FTSE AllSh |
| L&G - UK Alpha | 0.62 | UK All Companies | FTSE All Share TR |
| Artemis - UK Special Situations | 0.66 | UK All Companies | FTSE All Share |
| Henderson - UK Equity Income & Growth | 0.66 | UK All Companies | FTSE All Share |
| SVM - UK Opportunities | 0.68 | UK All Companies | FTSE All Share |
| Artemis - UK Growth | 0.69 | UK All Companies | FTSE All Share |
| MFM - Slater Growth | 0.69 | UK All Companies | IA UK All Companies Sector |
| Man GLG - Undervalued Assets | 0.71 | UK All Companies | FTSE All Share Index |
| Old Mutual - UK Mid Cap | 0.72 | UK All Companies | FTSE 250 Index (ex ITs) |
| Artemis - UK Smaller Companies | 0.56 | UK Smaller Companies | Numis Smaller Companies (ex ITs) |
| Aviva Inv - UK Smaller Companies | 0.71 | UK Smaller Companies | FTSE Small Cap ex ITs |
| R&M - UK Equity Smaller Companies | 0.73 | UK Smaller Companies | Numis Smaller Companies AIM (ex IT) Index |
| Old Mutual - UK Smaller Companies | 0.74 | UK Smaller Companies | Numis Smaller Companies (ex ITs) |
| L&G - UK Smaller Companies | 0.77 | UK Smaller Companies | Numis Smaller Companies Extended ( InvTrust) TR |
| Unicorn - UK Smaller Companies | 0.77 | UK Smaller Companies | Numis Smaller Companies (ex ITs) |
| Schroder - UK Dynamic Smaller Companies | 0.8 | UK Smaller Companies | FTSE Small Cap ex ITs |
Absolute return funds
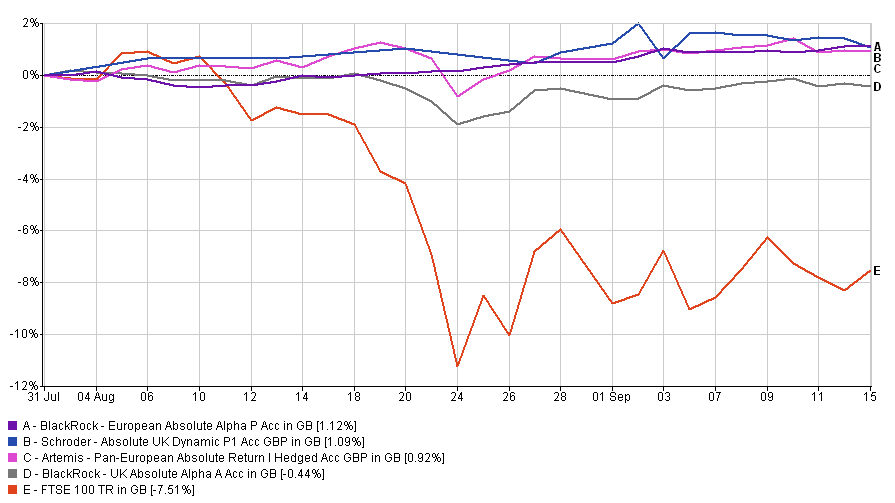
Absolute return funds have had a lot of bad press and quite rightly so. They are marketed as being able to provide positive returns in all market conditions yet most fail to achieve this. Interestingly there are a number of absolute return funds in this month's Best of the Best Selection, namely:
- Artemis - Pan-European Absolute Return
- BlackRock - European Absolute Alpha
- BlackRock - UK Absolute Alpha
- Schroder - Absolute UK Dynamic
These funds are listed below and have clearly demonstrated an ability to reduce volatility and produce positive returns. How have they done this? All of them have a low beta score versus the stock market and have extremely low volatility metrics. The chart below shows how these absolute return funds performed during the recent market sell-off. All but one of them made money!
Buy a volatility hedging ETP
The most extreme way to completely hedge out volatility from your portfolio without selling out of the market is to buy a volatility exchange traded product.
The most quoted measure of volatility is the Chicago Board Options Exchange's Volatility Index in the US, known as the VIX. The VIX is often referred to as the fear gauge for investor sentiment. For example last month the VIX jumped to a level not seen since the depths of the financial crisis.
So traders will buy or sell futures contracts in order to make money when the VIX jumps. Now DIY investors can do a similar thing and bet that that VIX will rise by buying the iPath S&P500 VIX Short Term Futures ETN. An ETN is a type of exchange traded product (ETP). While the VIX tracks US equity volatility it is still relevant for UK investors. One word of warning though, this is something only to hold for the very short term and only for the brave. Because the ETP tracks futures contracts and not the VIX itself these have to be renewed every month which incurs significant trading costs. So if you keep hold of it for more than a few months you will start to see any gains eroded even if the VIX goes up.

£200 Pension Cashback Offer
Make a qualifying deposit or transfer a pension to our partner Interactive Investor.
- Deposit or transfer a pension of at least £20k and you could earn £200 cashback
- Terms and Fees apply, Capital at risk
- New & Existing customers opening a SIPP
- Offer ends 31st July 2026
Before starting your transfer, check you won't lose any valuable benefits (such as guaranteed annuity rates or a lower protected pension age) and find out what exit fees you might have to pay
