

As long-term investors we shouldn't check our portfolios every day. However, there is nothing wrong with trying to understand what is driving markets. Understanding the current trends, or new developing trends, can be insightful and help inform investment decisions. Of course, the market rhetoric changes daily and if you were to respond to every change you would be speculating rather than investing.
The trouble is that reading the required books and daily articles to understand how markets work and what might be driving them would be a full-time job. 80-20 Investor is all about making investing easier and optimising the time you spend managing your investments. The aim of my latest article is to show you how I gain an insight, within seconds, as to what might be driving markets before I've even looked at the latest investment headlines. It also allows me to find the key news stories, amongst the noise, that are the most important to digest.
The way I do this is via the Stocks app on my iphone (other types of phone will have equivalent apps). It is an app that is on the phone by default which most people don't even use. The purpose of the app is to allow the user to track stock and index prices. It is possible to track a few fund prices using the app but often this functionality seems to fall down. However, even as a fund investor there are a number of key indices and stocks which I have placed on my watchlist which prove useful in understanding what's driving markets and how my portfolio might respond. I list these below alongside their codes which you can use to find them within the app and add them to your watchlist:
- Pound/dollar exchange rate (GBPUSD=X)
- Pound/euro exchange rate (GBPEUR=X)
- Pound/yen (GBPJPY=X)
- Yen/dollar (JPY=X)
- VIX (^VIX)
- 10 Year US Treasury yield (^TNX)
- FTSE 100 (FTSE 100)
- FTSE All Share (^FTAS)
- FTSE 250 Ex Investment Trusts (^FTMX)
- S&P 500 (S&P 500)
- Dow Jones (DOW J)
- NASDAQ (NASDAQ)
- German Dax (^GDAXI)
- Euro Stoxx 50 (^STOXX50E)
- CSI 100 Index Shanghai (000903.SS)
- Han Seng Index (^HSI)
- Nikkei 225 (Nikkei 225)
- Facebook (FB)
- Apple (APPL)
- The Boeing Company (BA)
- S&P 500 futures (ES=F)
- Dow Futures (YM=F)
- Nasdaq 100 (NQ=F)
Some of the indices which I follow may be understandable (such as the FTSE 100) but others less so. For that reason, I will run through each in turn to explain their inclusion.
Pound/dollar exchange rate - the value of the pound versus the dollar has a significant impact on the value of your investments. First and foremost overseas assets held in the US (such as US equity funds) will rise in value (in sterling terms) if the pound falls against the dollar. In addition, a weak pound versus the dollar tends to push the FTSE 100 higher as many of its constituents have dollar-denominated earnings which become more valuable in sterling terms.
Pound/euro and the pound/yen exchange rates - again the currency movements can give you an insight into how the value of your overseas assets will be faring. However, all three exchange rates in combination offer an insight into what is influencing the market. If the pound falls against the euro but not against other currencies then it suggests that perhaps news has broken that centres around Europe (and most likely the European Central Bank) which is moving the market. For example, it could be that the ECB has decided to extend its QE programme which would weaken the euro against the pound. If the pound falls against all three currencies it might suggest that news surrounding UK interest rates, Brexit or the UK economy has broken.
Yen/dollar - is a good indicator of risk aversion. Historically in times of panic, the yen has tended to be seen as a haven currency and rallied against the dollar. In addition, a strong yen versus the dollar tends to be negative for the export-dependent Japanese stock market. So typically when the yen strengthens the Nikkei 225 falls and vice versa.
VIX - This is also known as market's fear gauge and has a historic average of around 20. Currently, it has fallen back towards 12.5. The VIX hit a low of 9.14 in November 2017 but spiked to over 40 during the stock market collapse in February. When the market becomes fearful the VIX will likely rise. This makes it a good indicator of how fearful markets really are.
FTSE 100, FTSE All Share and the FTSE 250 - the first and last of these give you a good insight into how UK large caps and small caps are performing. When looking at them both together it can give you an insight into what might be driving markets or news headlines. Often the FTSE 100 will move inversely to the pound/dollar exchange rate. Occasionally that doesn't happen which is when it is interesting to see how the FTSE 250 is performing. The FTSE 100 has a significant exposure to oil companies so sometimes a rally in energy stocks or commodities can push the FTSE 100 higher. This is less pronounced in the FTSE 250 and you will notice the lack of correlation between the two. Also, the FTSE 250 is much more domestically focused and as such it means that it is much more sensitive to headlines surrounding the outlook for the UK economy. If the FTSE 100 has fallen but the FTSE 250 has risen it could be that there has been positive news surrounding the UK economy.
German Dax & Euro Stoxx 50 - the latter gives an overview of how European stocks are doing generally while the Dax shows how German equities are faring. The DAX is also sensitive around news headlines concerning Chinese economic growth given that China is one of Germany's biggest export markets. So if the DAX massively underperforms the Euro Stoxx 50 it could be a sign that concern is building over China, assuming that there is no specific German risk unfolding (i.e geopolitics).
S&P 500, Dow Jones & NASDAQ - the three main US equity indices. The first is the broadest index while the Dow Jones is 30 of the biggest US companies which also happen to include those that are likely to fare badly in the unfolding US-China trade war. The NASDAQ is more tech-focused. Given that the S&P 500 has around a 25% exposure to tech stocks how all three perform can give some good insight into what is driving the markets. At the foot of the list above you will see the futures for each of the three indices. These give you an idea of where the US stock market might open on a given day. It is important because UK and European traders often look towards US stock futures to get a steer of how/what to trade.
CSI 100 Index Shanghai - this is a broad index giving you an insight into how mainland Chinese stocks are doing.
Han Seng Index - this gives a good steer on how Asian markets are performing.
Nikkei 225 - this is the main Japanese stock market index.
Facebook, Apple, The Boeing Company - I like to keep an eye on Apple's share price because often 'as goes Apple so goes the market'. Facebook and Boeing are two stocks I started following in 2018 as both were at the centre of two market moving events this year, namely the potential regulation of US tech giants and the US/China trade war.
Real scenarios
Below I run through some real scenarios and screenshots to show you how I might try and gain an insight quickly into what is moving markets.
Scenario 1
On Wednesday morning last week I was greeted with this view on my Stocks app.
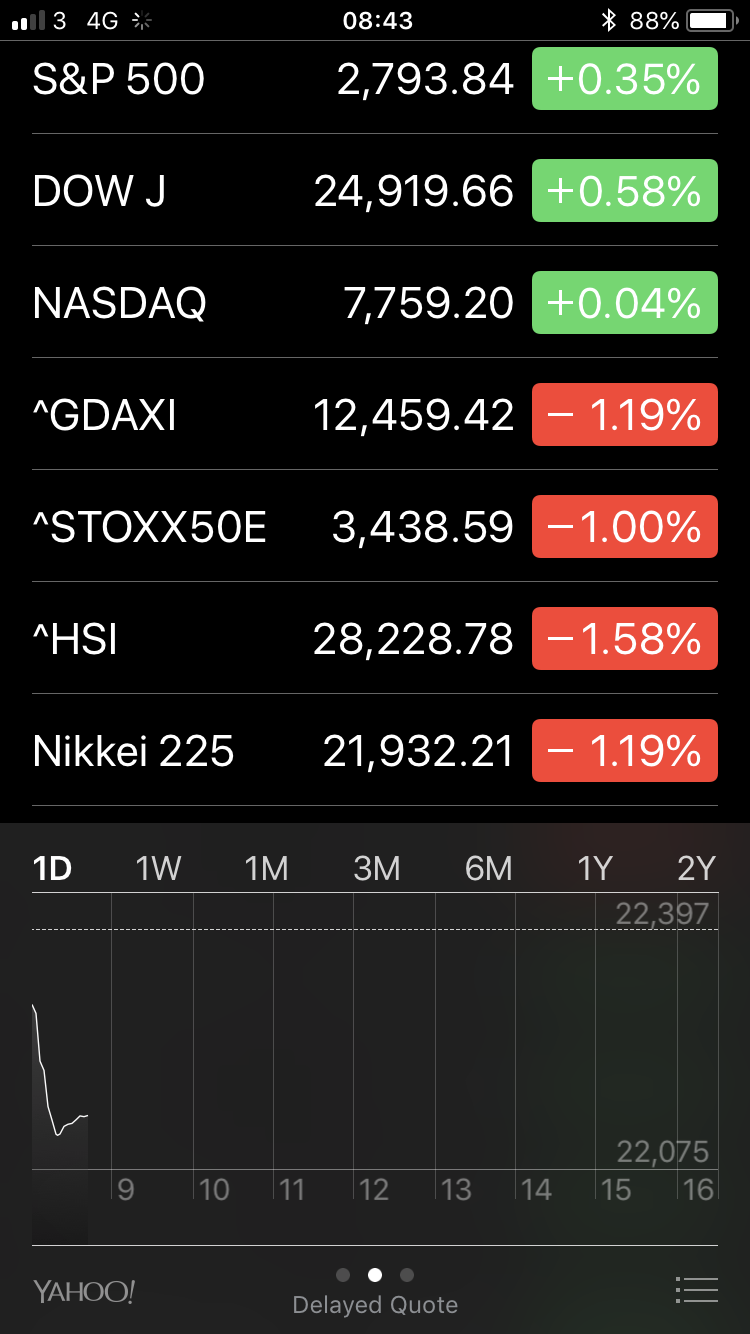
The first thing to note is that the US stock market (in green) closed at 9pm the previous night due to the time zone difference. At the end of the trading day in America, the S&P 500 was up with tech stocks just about breaking even. Given that tech stocks account for around 25% of the S&P 500 they tend to influence the index's performance. However, at the close of play on Tuesday it clearly wasn't tech stocks that had driven the S&P 500 but the more trade war sensitive stocks. You can see that the Dow Jones, which contains companies like Nike and Boeing that are sensitive to the US-China trade war, outperformed. So by Tuesday night (before Asian markets opened) markets were clearly becoming more positive about the trade war.
However, overnight in Asia (look at the HSI and Nikkei 225) markets tumbled to finish in the red. This then immediately followed through into Wednesday's European markets as shown (the time of the screenshots was 8.43am) with the Dax underperforming the rest of Europe. My first thought was that something must have triggered renewed trade war angst. Especially as Asia was hit the hardest.
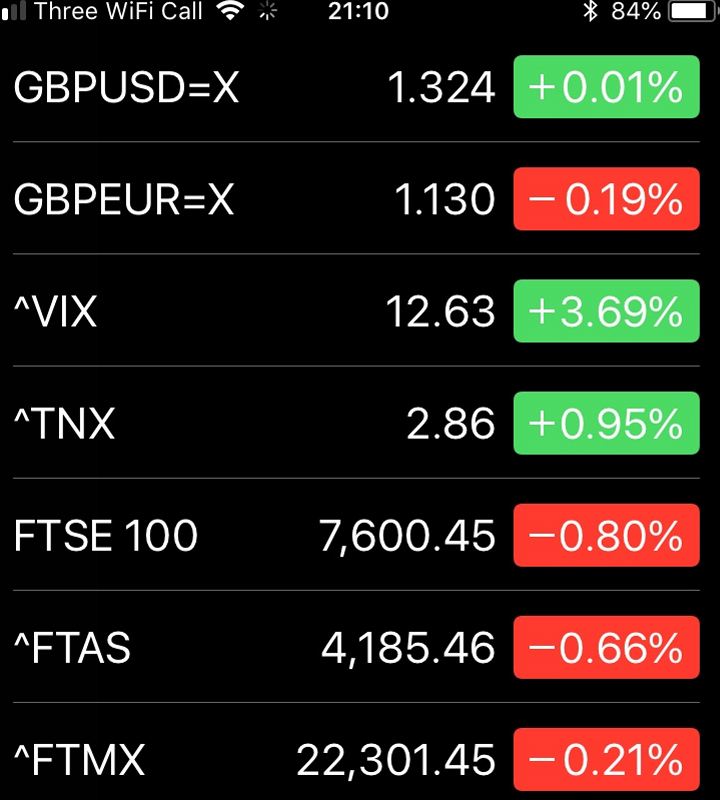
Similar falls to those experienced in Europe were also being experienced in the UK stock market with the economically sensitive FTSE 250 bearing the brunt as shown below. You can also see that the pound had barely moved against the dollar or the euro so the market moves were unlikely to be from a story that emanated from the UK. The VIX had also jumped suggesting an increase in fear in the US. At the time my guess was that something had been announced relating to the China/US trade war. I didn't have to look far to see that my guess was right as Trump had announced new tariffs to be potentially imposed on $200bn worth of Chinese goods.
The sentiment became very much risk-off and the only reason that the 10 year US Treasury yield hadn't fallen was that the market was closed until the afternoon UK-time.

Scenario 2
The screenshots below were taken from on Monday 16th July at 9.20pm. That meant all markets globally were closed already and Asian markets were due to open in a few hours.
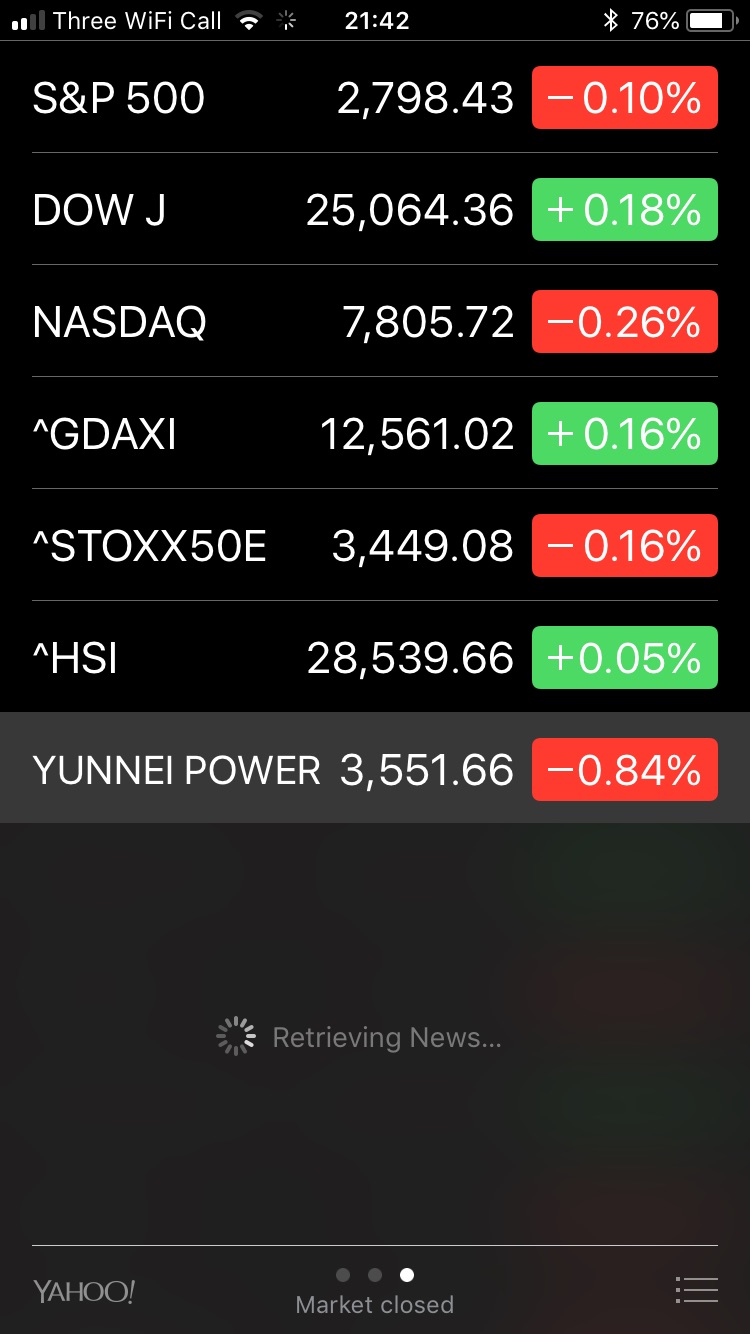

There wasn't a lot to be gleaned from Asian markets as the Japanese stock market had been closed for a holiday. So the figure shown for the Nikkei 225 was from the previous day's trading. However, the Hang Seng struggled to finish in positive territory while the CSI 100 index (shown above as Yunnai power) was down over 0.8%. It suggested that a China-specific event had perhaps triggered some anxiety in Asian markets. It turned out that this had in fact been the case as new economic data showing that China's economy was slowing had been released overnight.
I would, therefore, have expected to see equity markets show some signs of weakness generally but especially in Germany given its sensitivity to the health of the Chinese economy. Yet at the close of play the Dax was actually up while the Euro Stoxx 50 was down. That wasn't at all expected so a quick search showed that the positive close for the DAX was a result of Deutsche Banks shares surging after reporting stronger than expected results. This masked the concerns over China. Sometimes you don't even have to Google the news headlines as the app does contain news below the figures for the major stock market indices.
Looking at UK equities the FTSE 100 had tumbled yet the move couldn't be blamed on the pound/dollar exchange rate as it had barely moved. Given that the FTSE 250 fared much better it suggested perhaps an oil-related development. That is because the FTSE 100 has a significant exposure to oil companies as I mentioned earlier. Upon scanning the news headlines it turned out that there was a 4% fall in the price of crude oil as a result of a change in stance over Iran by the US. This dragged down oil stocks and therefore the FTSE 100.
Interestingly the VIX also crept up and despite a mixed US equity session, US tech futures (so where the market might open the next day) were massively down. It is very unusual for the futures to be so much different from how the actual market closed just 20 minutes earlier. Given that the Dow Jones futures were positive and also that the Boeing share price had enjoyed a stellar day it didn't seem likely that Trump had been shooting his mouth off again about China. Again scanning the news headlines and it quickly became apparent that Netflix (one of the FAANG stocks) had announced its latest earnings figures after the US stock market had closed and it had missed analysts expectations spectacularly. In fact in after-hours trading Netflix shares fell by 14% following the announcement. Given the FAANGs influence on the NASDAQ it dragged down the futures.
So you can see that in this example just by glancing at the moves in the key shares and indices that I got a sense that the trade war hadn't escalated. Worryingly concerns over Chinese economic growth were starting to rumble. Bank stocks were rising and I also discovered that the oil price was tumbling (a commodity which I don't track) which is often a drag on stocks and something to keep an eye on. The US earnings season was in full swing but Netflix's miss was a major drag and its impact on the market mood in the coming days would be interesting. All of these have the possibility of moving markets in the future depending on how they develop.
Scenario 3
The final scenario again happened this week. The two screenshots were taken first thing in the morning UK time. If you look at the second screenshot you can see that US markets closed the previous day higher with the NASDAQ in particular finishing strongly. However Chinese stocks finished lower while Japanese stocks finished higher.


European markets had just opened and as you can see they jumped higher. While a falling pound helped buoy the FTSE 100 you can see there was a general risk-on mood with European equity markets appearing to take their lead from the US. Also, the VIX had fallen dramatically while the US Treasury yield had risen (which means their price fell). A falling fear gauge alongside falling bond prices confirms the general risk-on sentiment, especially in America. Don't forget that bonds tend to fall if economic growth picks up. That's because it means that central banks are likely to raise interest rates, as inflation rises, which makes the fixed income bonds produce less attractive.
The fact that the pound rose against the euro and fell against the dollar shows that it was the dollar that had gained strength rather than the pound falling. This was confirmed by the fact that the yen fell against the dollar (not shown) which helps explain why the Nikkei 225 rose while Chinese stocks fell. A weak yen vs the dollar is generally good for Japanese stocks while recently a strong dollar vs the Chinese renminbi has been bad for Chinese stocks (as I explained in a recent newsletter). So why the widespread euphoria which seemed to coincide with a strong dollar? Clearly, something had happened. A quick review of the headlines revealed that the Chair of the US Federal Reserve had delivered an upbeat appraisal on the outlook for the US economy. The US market rallied (on the assumption that the trade war fears were overdone) and the dollar rose as it meant the Fed would still look to raise interest rates when necessary. If a central bank raises interest rates then the country's currency rallies. However, the consensus was that the rate rises would not be aggressive which is generally a good thing for tech stocks. That's because tech stocks' paydays are usually way off into the future and a higher interest rate means that this payday is worth less when discounted back to today. Given that share prices are a function of discounted future earnings, a higher discount rate would mean a lower share price today. So with scenario 3, just one story explained the screenshots you see above.
Summary
By treating markets almost like a fun puzzle which you try to solve you can gain a greater understanding of how they work. More importantly, you gain a thirst for trying to understand them as they become less like hieroglyphics and more like jigsaw pieces.
You should never obsess about daily market moves but it does bring investing to life. Sometimes it is quicker to learn by practical examples rather than through pure theory. You can learn how a car works by studying engineering or by rolling your sleeves up and looking under the bonnet to understand what makes a car tick. Understanding investment markets is much the same. To extend the analogy further, if you know how a car works you then know how to keep it on the road with minimal effort. It might even help you avoid an accident too. Again, Investing works in a similar way.
I hope you found the article useful. Finally, I must stress that sometimes you can't explain why markets have moved the way they have or find a reason for it. That's perfectly fine. Often a reason presents itself eventually. However, when markets don't act as you might expect them to then that in itself is interesting and may lead to further insights. If nothing else this article should help you wade through the deluge of articles and headlines and pick out the most important ones.

£200 Pension Cashback Offer
Make a qualifying deposit or transfer a pension to our partner Interactive Investor.
- Deposit or transfer a pension of at least £20k and you could earn £200 cashback
- Terms and Fees apply, Capital at risk
- New & Existing customers opening a SIPP
- Offer ends 31st July 2026
Before starting your transfer, check you won't lose any valuable benefits (such as guaranteed annuity rates or a lower protected pension age) and find out what exit fees you might have to pay
