

Back in October, I received the following request from an 80-20 Investor member via Chatterbox.
"Hello Damien
You previously did a really useful research article on using a 200 day moving average filter to determine whether to be in funds or cash, as a mechanism to reduce drawdowns while only slightly affecting growth rate. In this research one of the options you looked at was using this filter in conjunction with your higher risk portfolio which excludes funds from the low risk bracket and just uses med and high risk funds. My question is, what if you were to exclude medium risk funds as well and just use the more volatile high risk funds? Could this provide the better risk adjusted performance due to the filter, along with a better growth rate too, due to the fund performances?
I love using your portfolio and your research pieces as a starting point for my own investments, and I am very pleased with the results."
It was certainly an intriguing idea, which upon closer consideration would require a significant amount of time and effort to research. Not just because it would require me to update the alternative versions of my portfolio (step 1), but it would also require me to analyse every trade within my portfolio and recreate it using only the high risk funds. I have been running my portfolio for almost 9 years, so that is over 100 monthly portfolio reviews to go back through and analyse (step 2). Finally I would then need to look at the impact of trying to market-time (step 3). Nonetheless that is exactly what I did.
Step 1 - Update my alternative higher risk portfolio.
I completed the first step required to answer the question posed when I published Damien’s alternative risk portfolios update – December 2023. If you have not done so already, it's worth familiarising yourself with the research article.
For the purposes of this piece of research I have also ensured the higher risk version of my £50k portfolio is up to date (including any changes made in January 2024).
Step 2 - Build two new high risk only alternative portfolios
When considering how to accurately recreate a high risk only portfolio I settled upon two potential options.
Option 1 - Equal high risk portfolio
Under this option I assumed an investor may have looked at my standard £50k portfolio reviews each month and built a portfolio where they split their money equally across the higher risk funds only. So, for example, if we go back to June 2020 my standard £50k portfolio held the following funds classified as higher risk:
- Baillie Gifford Long Term Global Growth Investment
- Baillie Gifford Positive Change
- Jupiter Japan Income
So when reconstructing the "Equal high risk portfolio" I assumed an even split of:
- 33.33% invested in Baillie Gifford Long Term Global Growth Investment
- 33.33% invested in Baillie Gifford Positive Change
- 33.34% invested in Jupiter Japan Income
Option 2 - Weighted high risk portfolio
The alternative option was to weight the holdings within the high risker funds to reflect my convictions at the time. So, for example, in June 2020, the aforementioned funds had the following allocation within my standard £50k portfolio
- 8% invested in Baillie Gifford Long Term Global Growth Investment
- 5% invested in Baillie Gifford Positive Change
- 6.5% invested in Jupiter Japan Income
You can see this if you read my June 2020 portfolio review.
As you can see I had the most conviction (exposure) to Baillie Gifford Long Term Global Growth Investment and the least conviction (exposure) to Baillie Gifford Positive Change. In fact, my exposure to Baillie Gifford Long Term Global Growth Investment was over 50% bigger than my exposure to Baillie Gifford Positive Change.
So a portfolio that invests in these 3 funds only, which reflects the conviction in my original standard portfolio would look like this.
- 41% invested in Baillie Gifford Long Term Global Growth Investment
- 25.6% invested in Baillie Gifford Positive Change
- 33.4% invested in Jupiter Japan Income
I then replicated this methodology for every monthly portfolio review update I've published since I started running my standard £50k portfolio almost 9 years ago.
So when creating both portfolio options it meant analysing almost 100 past portfolio reviews to produce 200 portfolio entries (100 for each portfolio). It has obviously taken me a few weeks but the results are now in...
Results
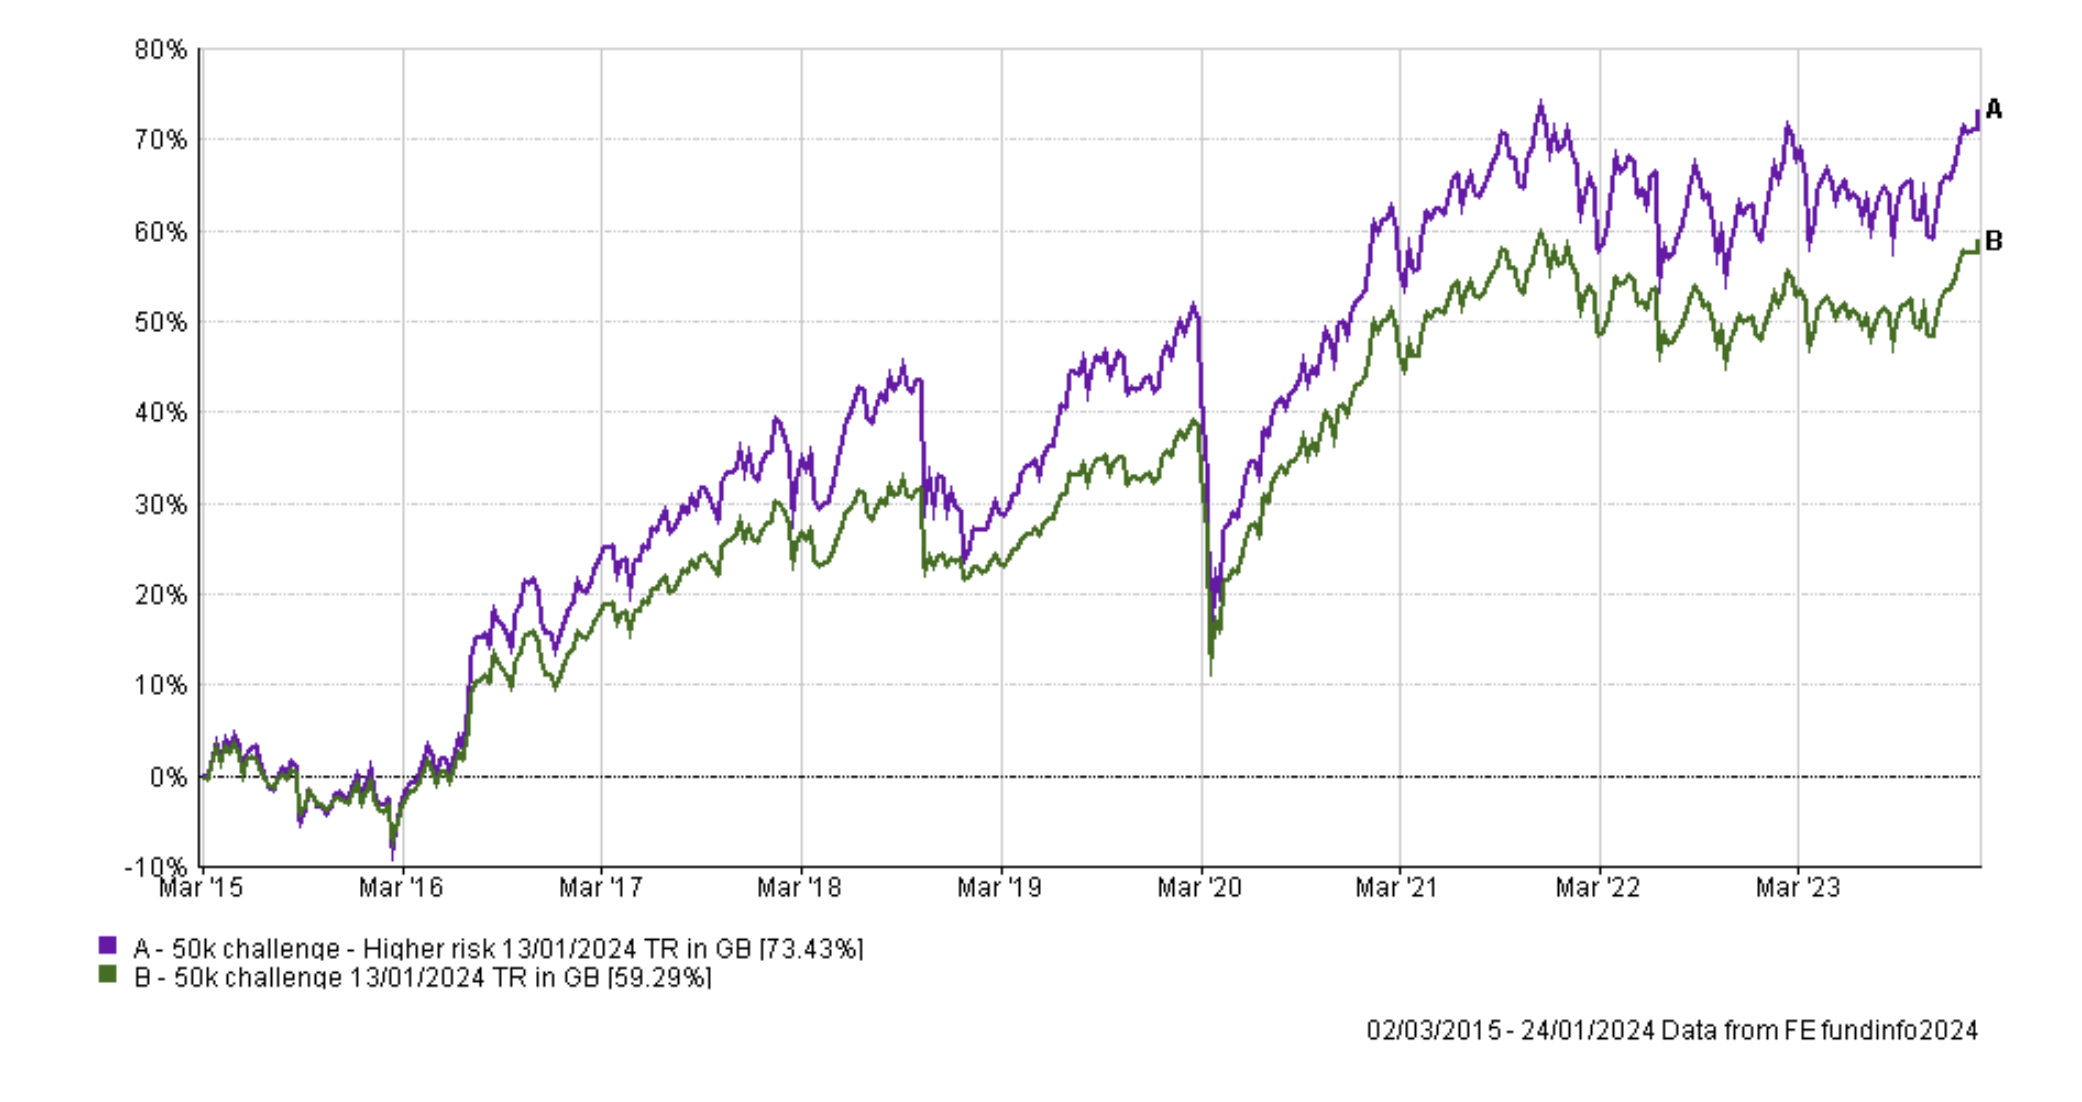
As a base measure here is the latest chart showing my standard £50k portfolio versus the usual higher-risk £50k portfolio that I update periodically.
Now let me add in the new "equal high risk portfolio" and the new "weighted high risk portfolio"
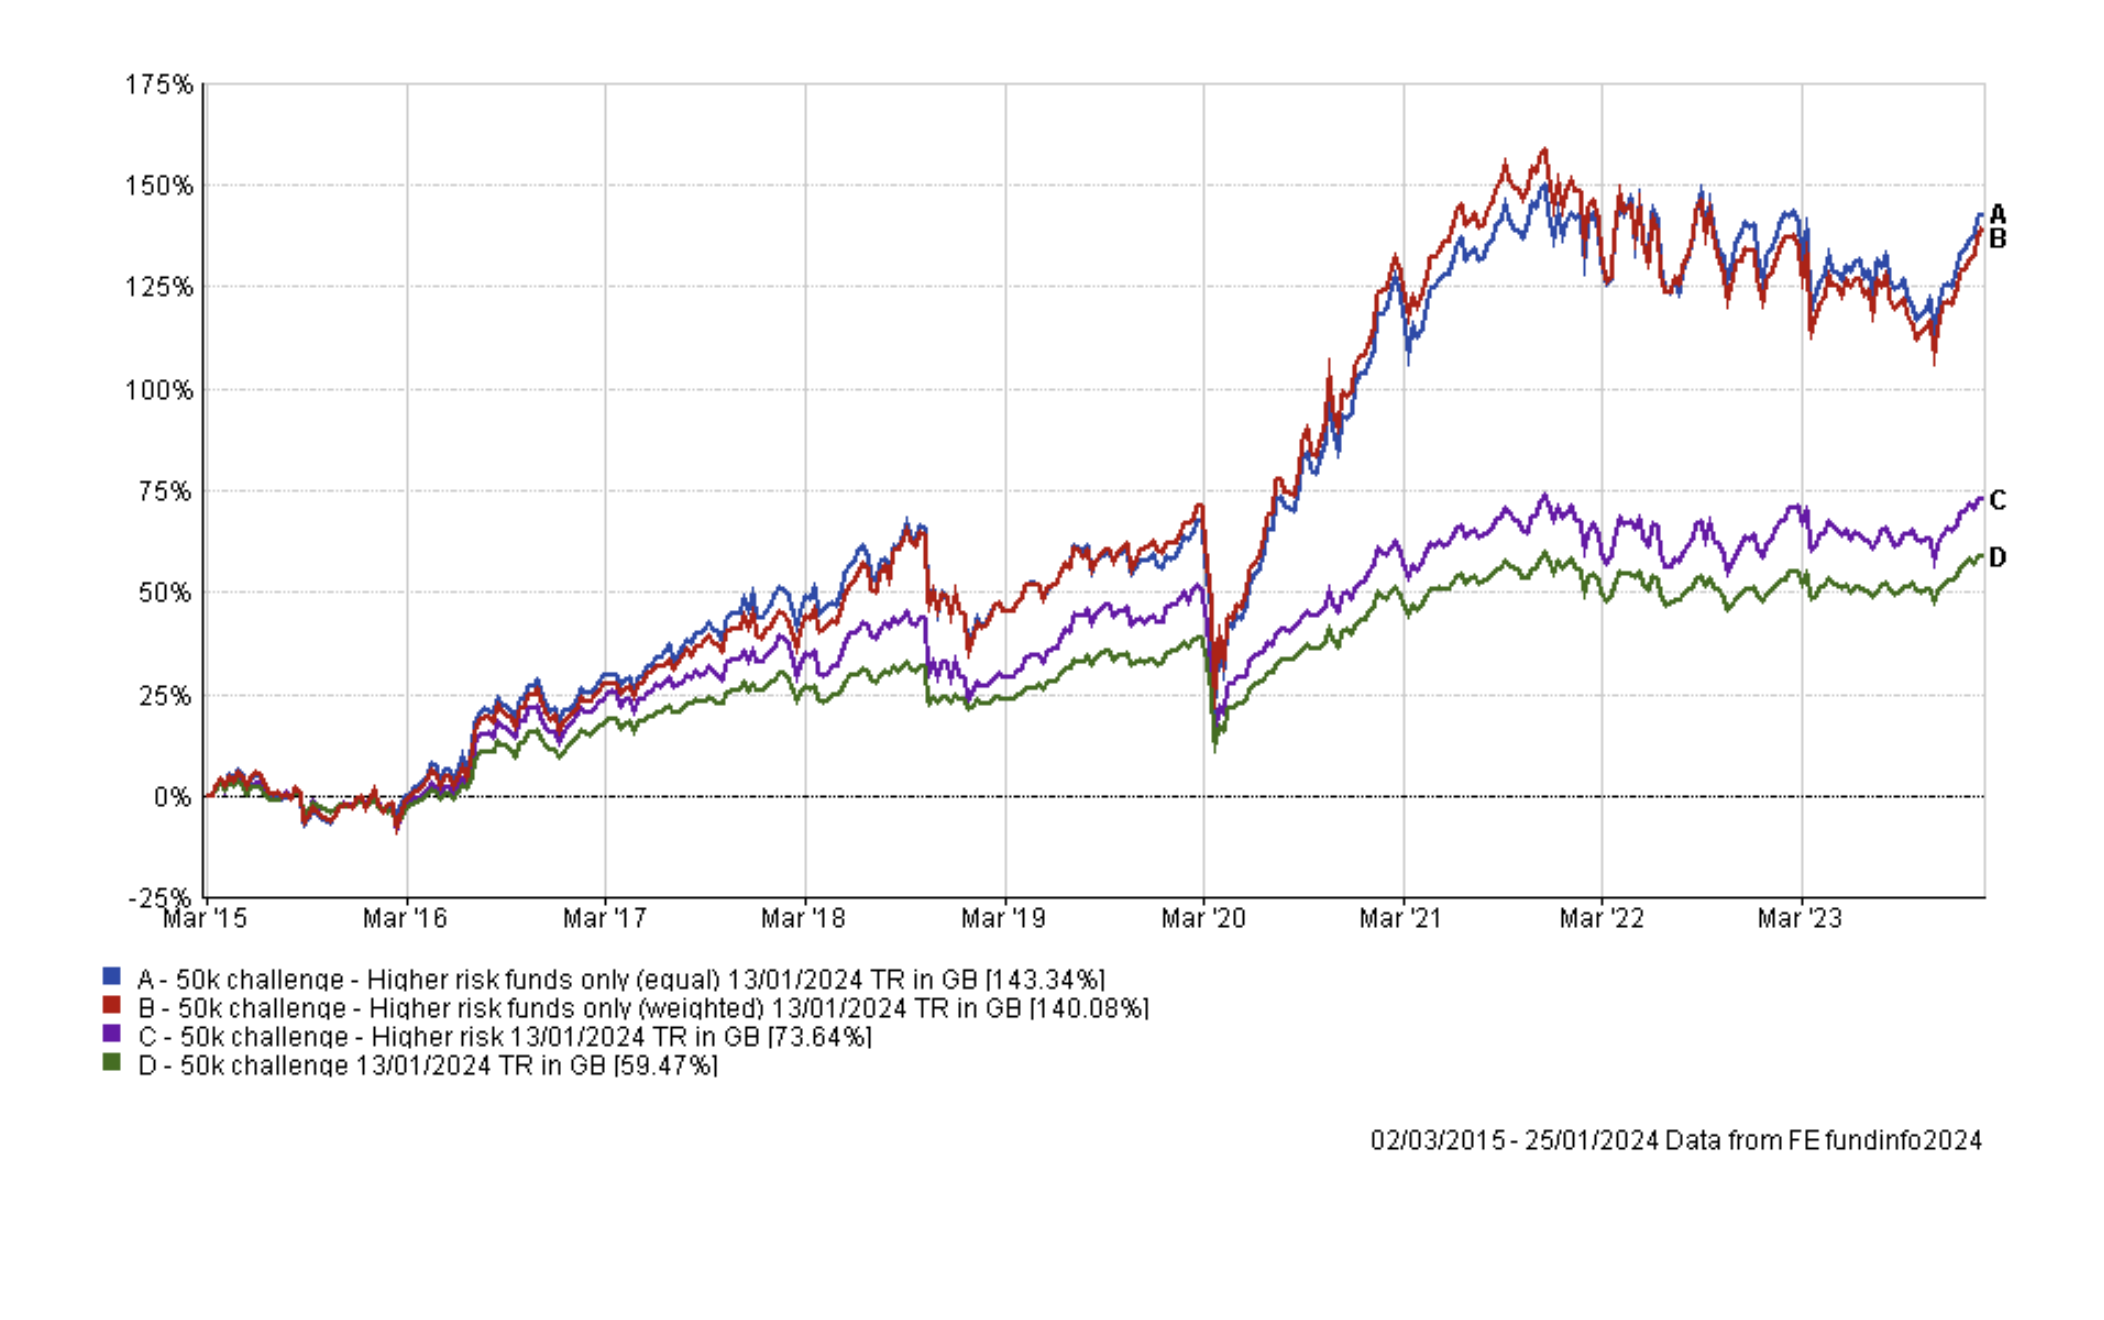
The results are extraordinary. To put the results into context, my standard £50k portfolio is now worth £79,500 which I'm very pleased with. However, had I invested solely in the higher risk funds in my portfolio it would be worth approximately £120,000
What makes this exercise fascinating is that there is no cherry-picking going on. These are the results that someone would have achieved had they solely followed the high risk funds in my portfolio. Because it's based on the trades I actually made in my original portfolio, I have no doubt that there may be some 80-20 Investors who may have achieved this result or done something similar.
This result highlights a core aspect and founding aim of the 80-20 Investor service. It is not dictatorial and the research can be used to provide a wide range of outcomes, unlike if you invest in an off-the-shelf managed portfolio with an investment platform or fund house where the outcome is singular (i.e. everyone gets the same - good or bad). Someone could have achieved the above results if they had a high risk tolerance.
An initial observation is that there is no material difference in outcomes between the two new portfolios and in hindsight that perhaps shouldn't be a surprise. My standard £50k portfolio typically only holds around 3 high risk funds, as it does right now. On top of that, it is rare that any one of those funds will make up the lion's share of the higher risk portion of my portfolio. Instead, my money is usually split fairly evenly between them.
Of course, the high risk only fund portfolios have taken a very high level of risk, with the portfolios invested in between 1 to 6 funds at various times since March 2015. Such a high level of conviction will inevitably lead to periods of outperformance but also underperformance.
Looking at the chart above the period after the pandemic crash is a perfect example of outperformance. If someone had invested in either of the new high risk portfolios at the market-low of the Covid-19 crash they would have doubled their money by 11th November 2021, just 20 months later. Earlier in this article, I used the example of June 2020 to demonstrate how the portfolios were constructed. June 2020 is exactly when both new high risk portfolios went parabolic after the pandemic market-low. If you look at the funds it was invested in they were:
- Baillie Gifford Long Term Global Growth Investment
- Baillie Gifford Positive Change
- Jupiter Japan Income
The first two funds invested heavily in technology stocks which were the biggest pandemic winners, when the world was in lockdown. Interestingly if we now look at the performance of the portfolios since the start of 2022, the picture is quite different.
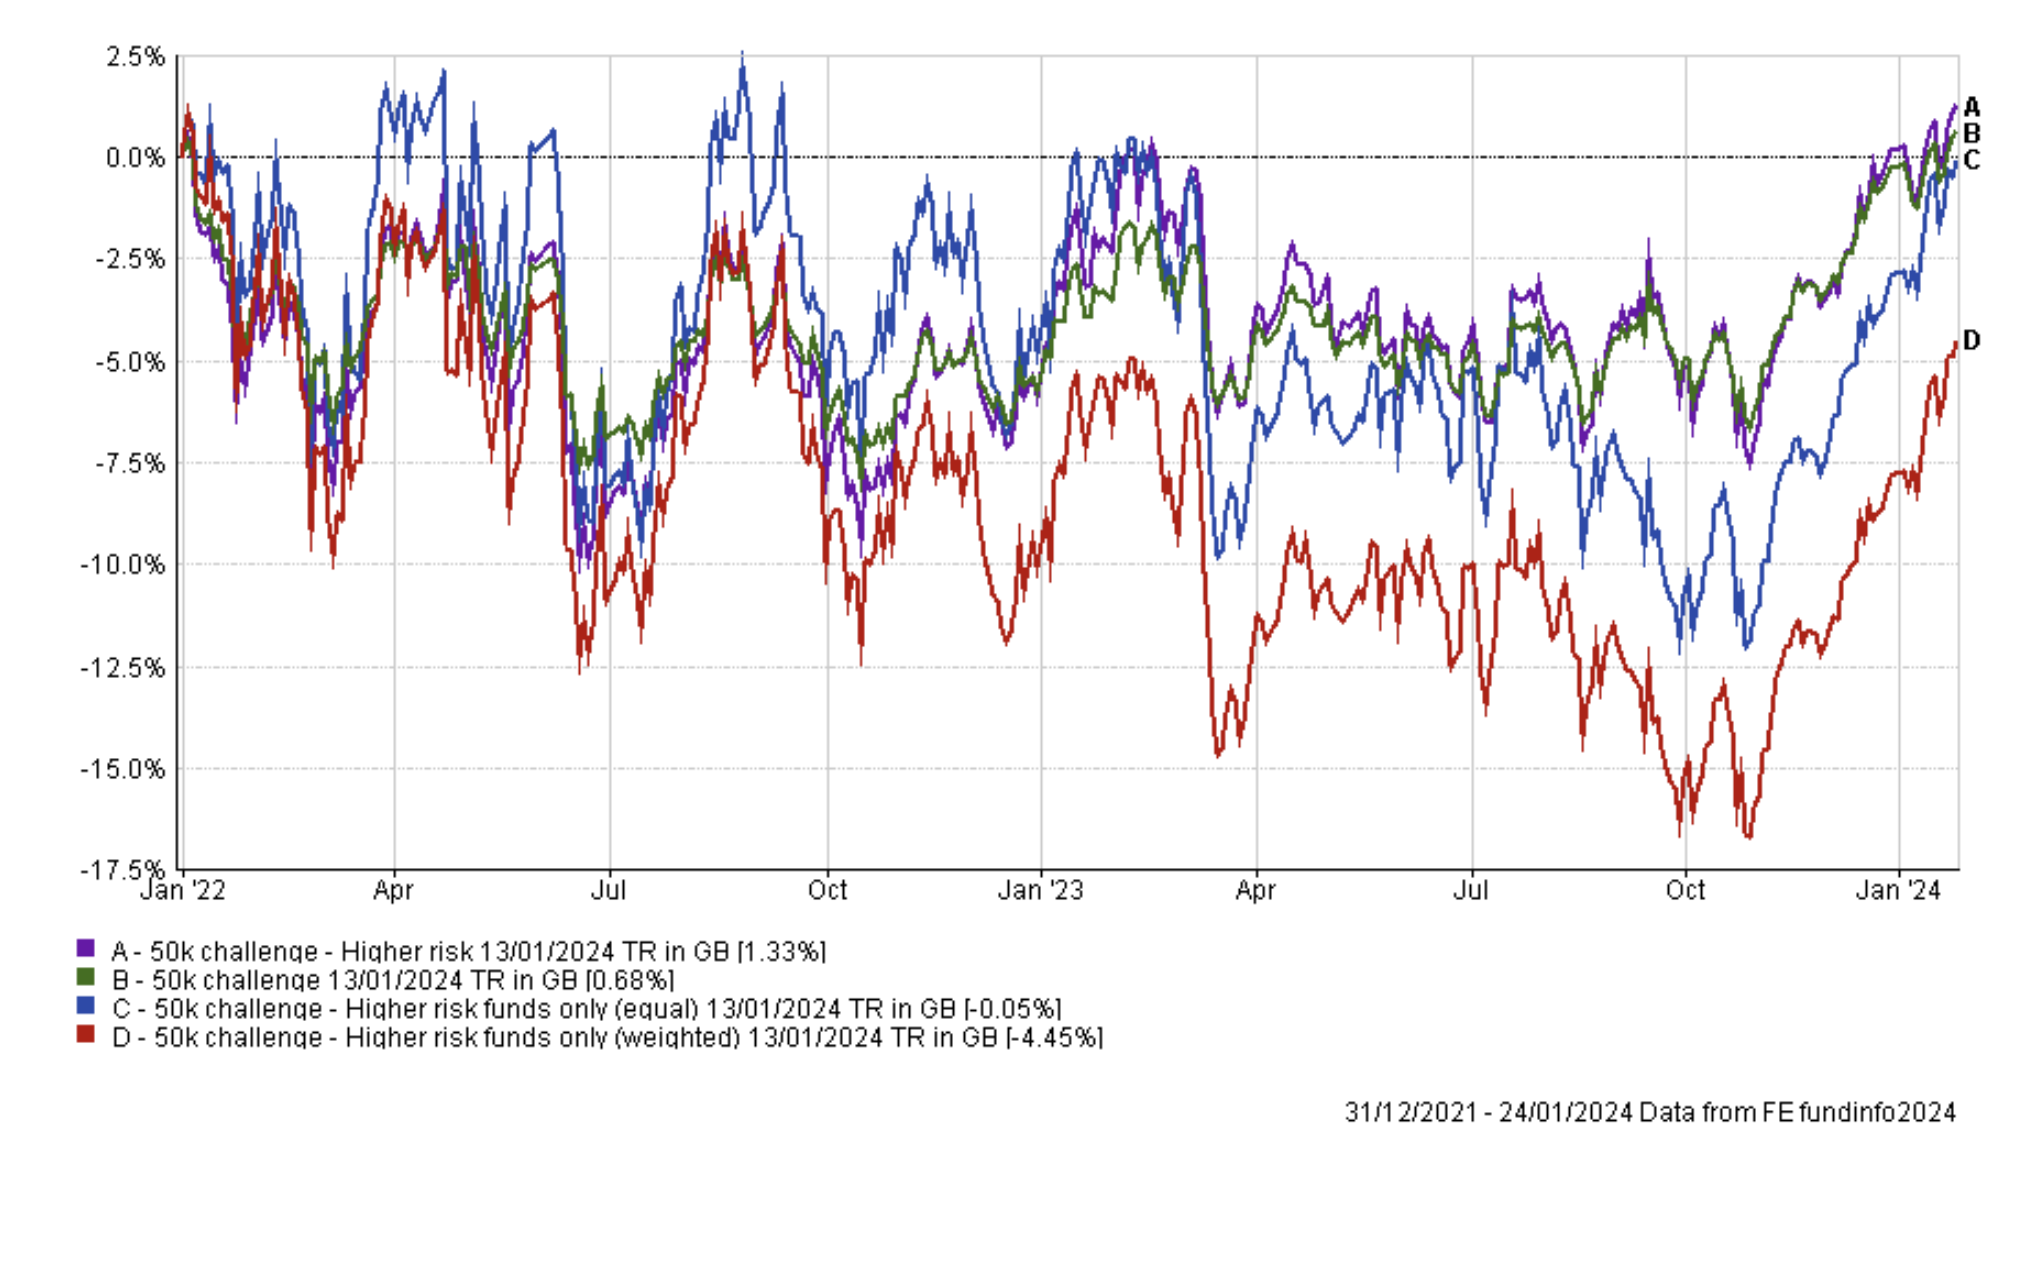
The weighted version of the new high risk portfolio has significantly underperformed since the start of 2022. That is largely because it became overweight in US stocks during a period of weakness and then became overweight in European stocks during a period of stress for the region, following the invasion of Ukraine. This is of course a quirk of its construction. My own standard 50k portfolio became more defensive during the period which meant there were fewer high risk funds contained within it, from which to construct the new portfolios. In fact, at certain points I only held one high risk fund which placed all the new portfolios' eggs in one basket.
It could be argued that in reality a person would have diversified their high risk holdings, perhaps by picking others from the BOTB selection rather than just relying on my portfolio. Nonetheless the drag on performance didn't overly harm the long-term performance of the new high risk portfolios. But it does give a warning over the impact of a lack of diversification within a portfolio.
Given that the new portfolios are almost exclusively made of equities, how do they compare to the average global equity fund over the period. The answer is that they still significantly outperformed:

It is also interesting to look at the key summary statistics for these portfolios. In the table below (click to enlarge) the key metrics are colour coded in each column with blue being the best, yellow being the 2nd best, orange the third best and red being the worst. At the foot of this article I explain what each key statistic represents. The original higher risk portfolio produced a lower annualised return with a lower volatility as it has medium risk funds held within it, unlike the other versions of the high risk portfolio. But, as you can see the equal weighted high risk portfolio not only produces the greater return, it does so by taking more risk (suggested by the higher volatility). However, the additional risk is rewarded, based upon the Sharpe ratio. It also has the highest alpha of all the portfolios listed.

Perhaps more interestingly if the 50k higher risk funds (equal) portfolio resided in the global equity fund sector it would actually rank number 1 out of 137 funds for performance over the period (annual average return of 10.38%) and rank 3rd for its Sharpe ratio and Sortino ratio. It would also rank in the top quartile (23rd place) for its alpha generation. This is an incredible result but... on the flip side it would rank last for volatility.
Or in other words, the higher-risk only portfolio (equal weighted) has the possibility of market leading returns and is easy to implement, but it is only for the brave-hearted because it is incredibly volatile.
Step 3
The next step is to look at the impact market-timing would have on the new higher-risk only fund portfolios. I will look at that in part 2 of this research, which will be out next week.
Key statistic definitions
Alpha
Alpha is a figure which measures a manager’s apparent skill at picking winning investments versus their benchmark. Alpha is the excess return versus the return of a fund’s benchmark (i.e the market). So a fund with a positive alpha indicates that the fund manager has outperformed through skill. While a negative alpha figure would indicate underperformance. The higher the alpha figure the better.
Beta
Beta measures a fund’s sensitivity to the general market in which it operates. The market always has a beta of 1 by definition. So if a fund also has a beta of 1 that would mean that if the market rose by 5% then so should the fund. If the fund has a beta of -1 then as the market rises so the fund falls. A well-managed index fund will have a beta of exactly 1. Funds that outperform the market when it does well but do even worse when the market is going down will have a beta above 1.
Maximum Drawdown
This is the biggest fall experienced in a given week.
Sharpe Ratio
The Sharpe Ratio is a measure of the excess return a manager is achieving for the risk they are taking. The higher the Sharpe Ratio the better.
Sortino Ratio
This is very similar to the Sharpe Ratio but places more emphasis on the manager's ability to manage on the downside.
Volatility
This is a measure of a fund's dispersion of returns, or in plain English the variability in those returns. Think of it as a measure of how much a building is prone to wobble. The more prone it is (the higher the volatility) the more it will sway in an earthquake.

£200 Pension Cashback Offer
Make a qualifying deposit or transfer a pension to our partner Interactive Investor.
- Deposit or transfer a pension of at least £20k and you could earn £200 cashback
- Terms and Fees apply, Capital at risk
- New & Existing customers opening a SIPP
- Offer ends 31st July 2026
Before starting your transfer, check you won't lose any valuable benefits (such as guaranteed annuity rates or a lower protected pension age) and find out what exit fees you might have to pay
