

Investors are continuing to grapple with the future direction of monetary policy from central banks and what it means for investment markets. In last week's newsletter I wrote that...
"The closer investors believe a central bank is to the end of its rate hiking cycle, the better its domestic stock market has tended to perform (in local currency terms) in 2023...
[but]...if investors’ interest rate expectations for key central banks are changing then so will the performance of key stock and bond markets going forward. For example, if a central bank is no longer deemed to be near the end of its rate hiking cycle, then this may be reflected negatively in the domestic stock and bond markets.
It then raises the interesting question of how do different assets perform from a UK investors' point of view throughout the Bank of England rate hiking cycle. This is a topic I will look to explore in a new research article next week."
So as promised in this article I look at how assets have performed during periods of aggressive Bank of England (BOE) rate hikes in the past. Additionally, I contrast this with post-hike periods (including pauses) to gain insights into which assets are likely to outperform once the current rate hiking cycle is over, which the market is predicting might be as soon as early next year. With such insights it could theoretically be possible to position a portfolio to be better placed when the transition occurs.
Methodology
First I created a historical chart of the Bank of England bank base rate going back to the 1970s

For my analysis, I focused on parts of the base rate cycle that started from the mid-1990s onwards (see below) because this is as far back as the majority of unit trust fund data goes. It also is a sufficient enough timespan to cover three rate hike cycles (the red arrows), three rate cutting cycles (the green arrows) and two pauses following rate hike cycles (the blue arrows). I have not included the pause between 2009 and 2021 as it was a period of historic low rates and I want to focus on periods where rates have been elevated.

For each of these periods I then analysed the performance of the unit trust sectors contained in the 80-20 Investor growth heatmap that were in existence back as far as June 1996. By examining the performance of each unit trust sector during these times (hikes, pauses and cuts), we can determine their relative strengths and weaknesses in response to the three stages of an interest rate cycle.
The analysis enabled me to produce the heatmap below (click to enlarge). Each column represents a time period highlighted by a coloured arrow on the above graph, in chronological order. The first row is coloured-coded in line with the arrows on the graph to make it easier to reference.
The performance of the average fund from each sector is shown in the table and each column is colour-coded on a relative basis. So the best performing assets over each time period are highlighted red while the worst are coloured blue.
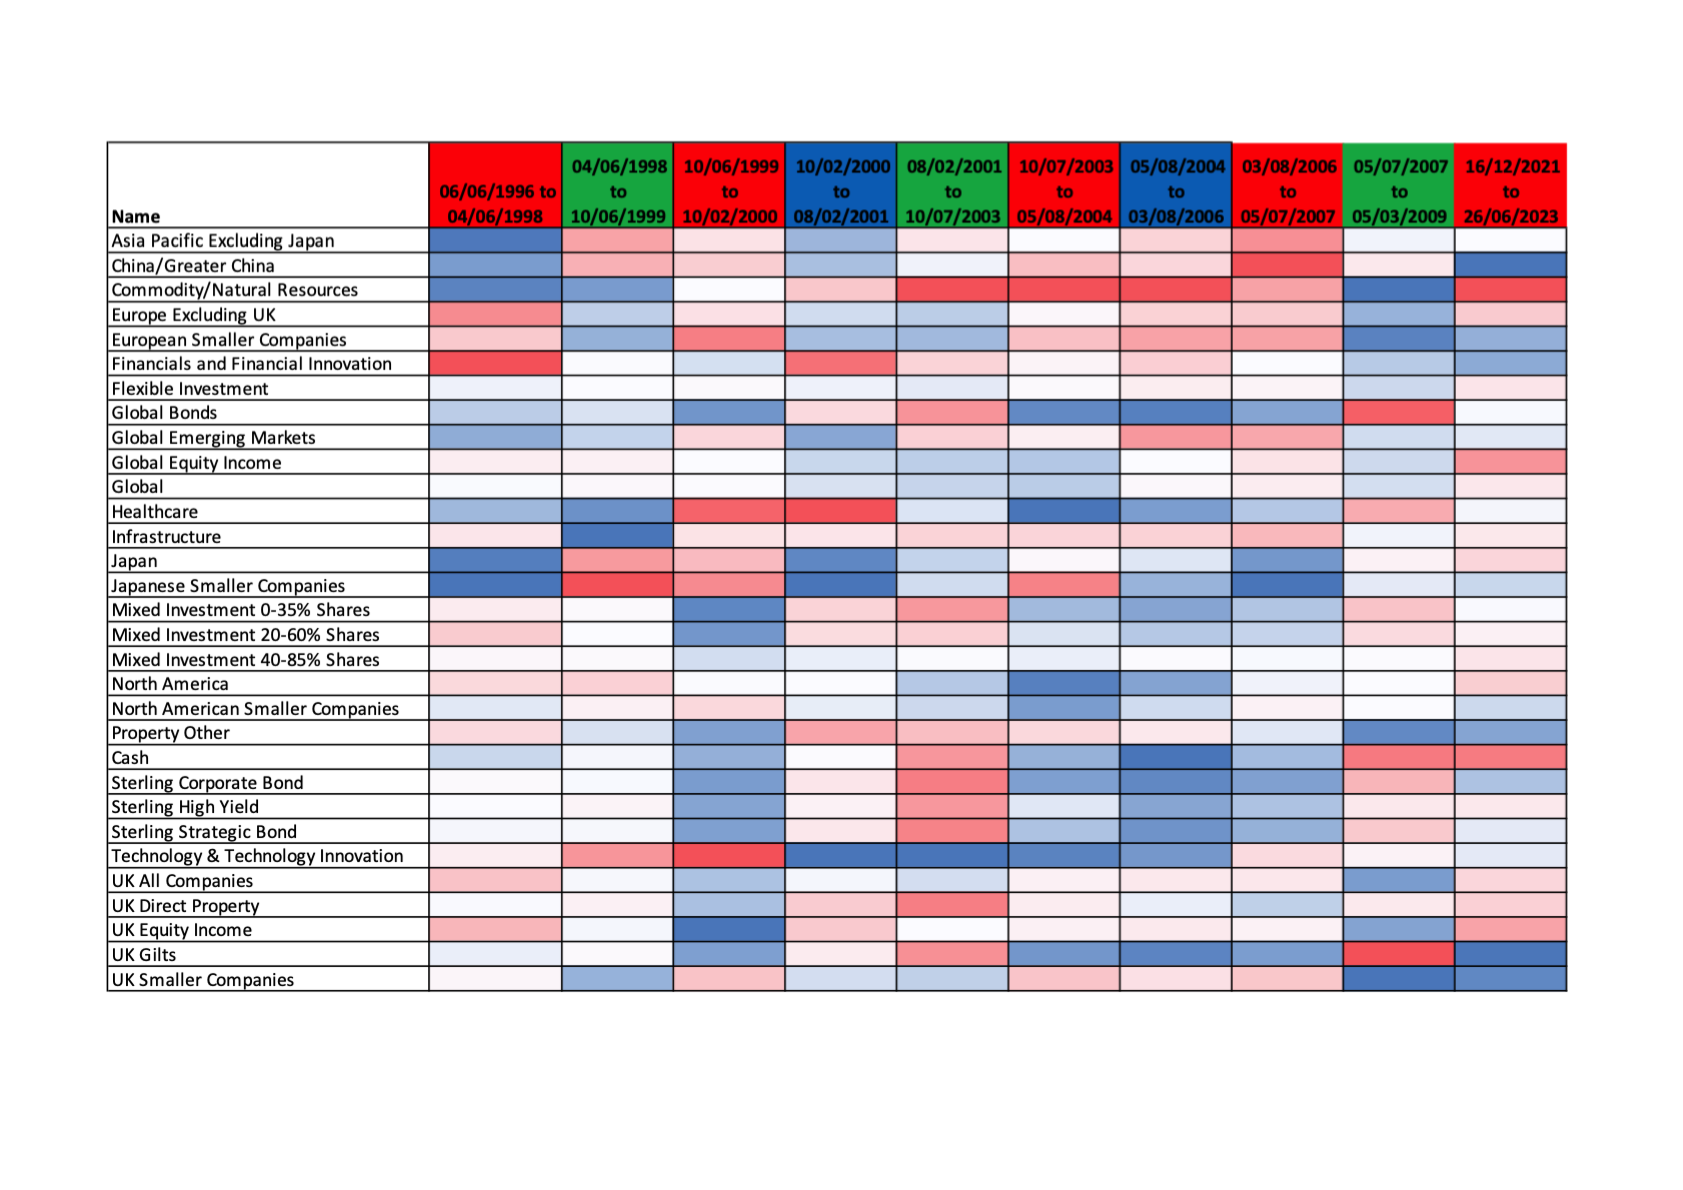
During base rate rises
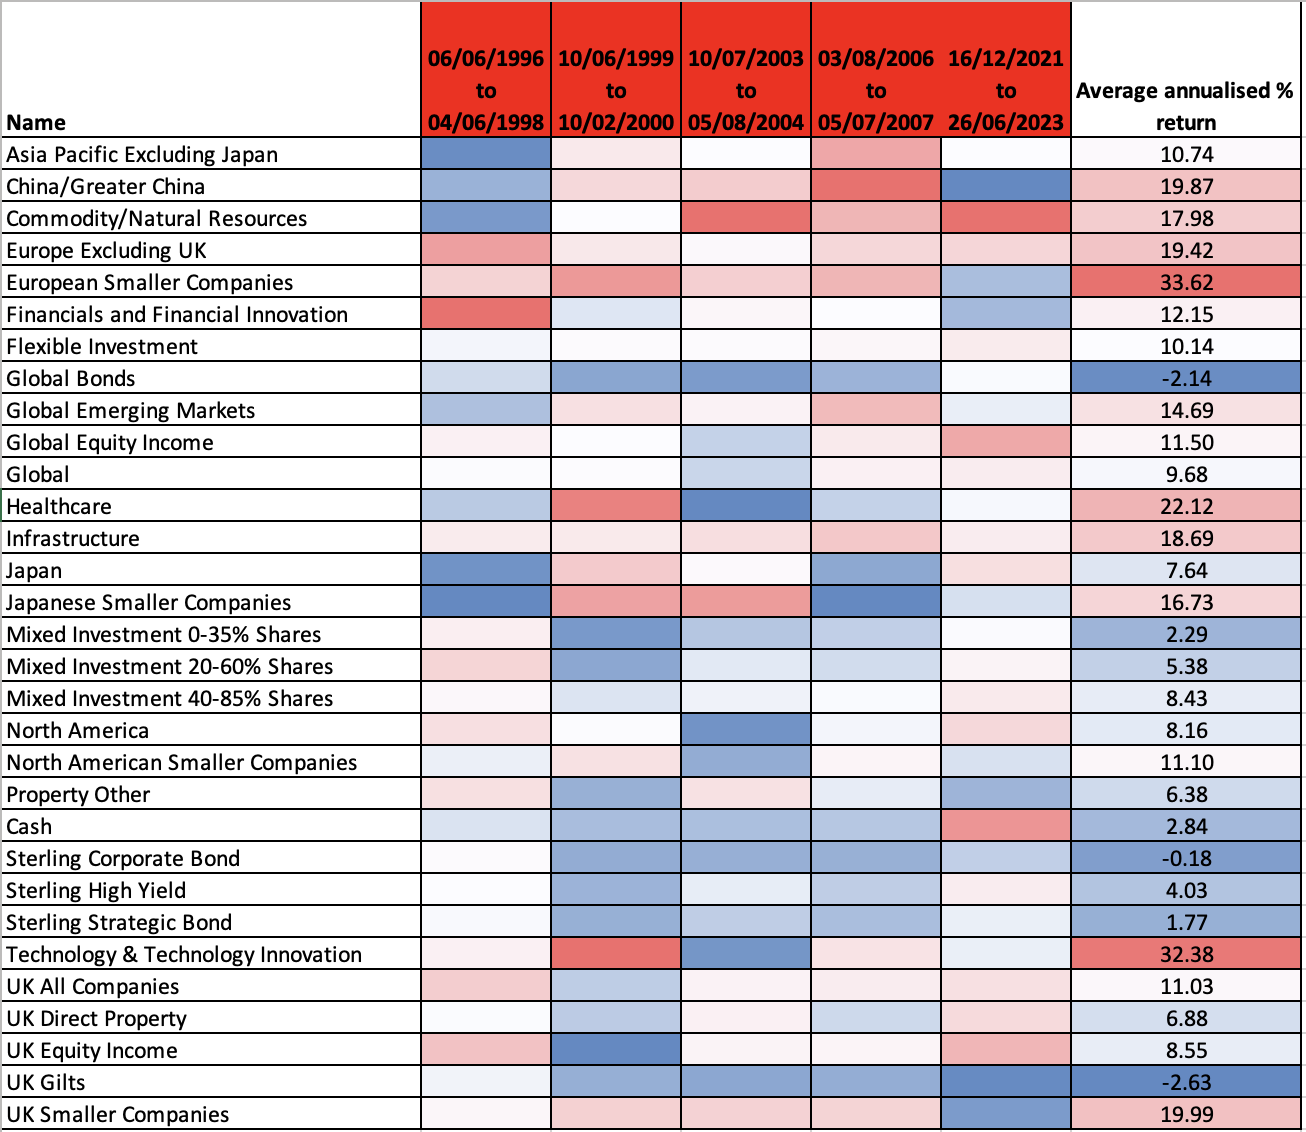
The best performing assets during periods of aggressive interest rate hikes have tended to include European equities and European Smaller Companies, with the exception being the latest rate hike cycle. But this highlights that while the Bank of England monetary policy plays a key role in UK investor outcomes, other macro factors have an overriding influence. Of course, in the case of 2022 the war in Ukraine hit European equities hard. But why have European equities typically performed better than other asset classes during a BOE rate hike cycle? One reason could be the divergence in monetary policy between the EU and the UK. A good example of this was during the BOE rate rise cycle in 2004 when the European Central Bank (ECB) actually kept interest rates stable at a lower level. As we've seen in 2023, when one central bank has looser monetary policy compared to another it can be positive for the domestic stock markets of the economy with the looser monetary policy. Of course the impact of currency moves can negate this but the table does take into account currency moves.
Commodities have also tended to perform well during a rate hike cycle (up almost 18% on an annualised basis) and this is likely to have happened for two reasons, firstly BOE rate rises tend to cause the pound to rally, which in turn causes the US dollar index to weaken. When the US dollar weakens it is usually positive for commodity prices. It can also benefit emerging market assets. Secondly the BOE increases interest rates to combat inflation and commodities are often bought by investors as a hedge against inflation, just as we saw at times last year.
Infrastructure funds have also tended to fare well (with an annualised return of 22.12%) and this again could be because they act as an inflation hedge given that they often hold inflation-linked assets providing relatively stable income payments, such as toll roads, airports, utilities and energy projects. Often such assets can have built-in mechanisms to raise prices and therefore allow revenue to keep pace with inflation.
UK smaller companies have also performed well during periods when interest rates are rising. This could be because rate rises can be a sign of a robust UK economy which would therefore be to the benefit of the domestically focused companies within UK smaller companies funds. In addition, if the pound strengthens as a result of interest rate rises, then it will likely reduce import costs for smaller UK companies (making them more profitable) but, in addition, the valuation of their shares/dividends won't be hurt by currency moves (unlike if you invest overseas). 2022/23 has been an outlier for UK smaller companies (the sector has been one of the worst performers), this is perhaps because the BOE has increased the base rate to tackle historically high inflation (and not just to try to prevent the economy overheating). Furthermore the size of the rate hikes have been significant. Higher rates make the cost of debt more expensive which will hurt smaller companies as they often struggle to pass on rising costs (due to inflation) to their customers.
Unsurprisingly, assets that have struggled in a rising rate environment are those related to bonds - be they global, corporate or government bonds. The declines are due to the fact that newer bonds with higher yields become available, making existing lower-yielding bonds less attractive to investors so they sell out.
Technology & Technology Innovation funds have historically produced a mixed response to rising interest rates. The outlier is the period between 1999 and 2000 when tech stocks performed exponentially well (more than doubling in value) but that was because we were in the middle of the dotcom bubble before it burst. Again, it is another example of when other macro events become the principal driver of investment markets. So take the average annualised return figure for tech stocks with a pinch of salt.
During a pause following rate rises
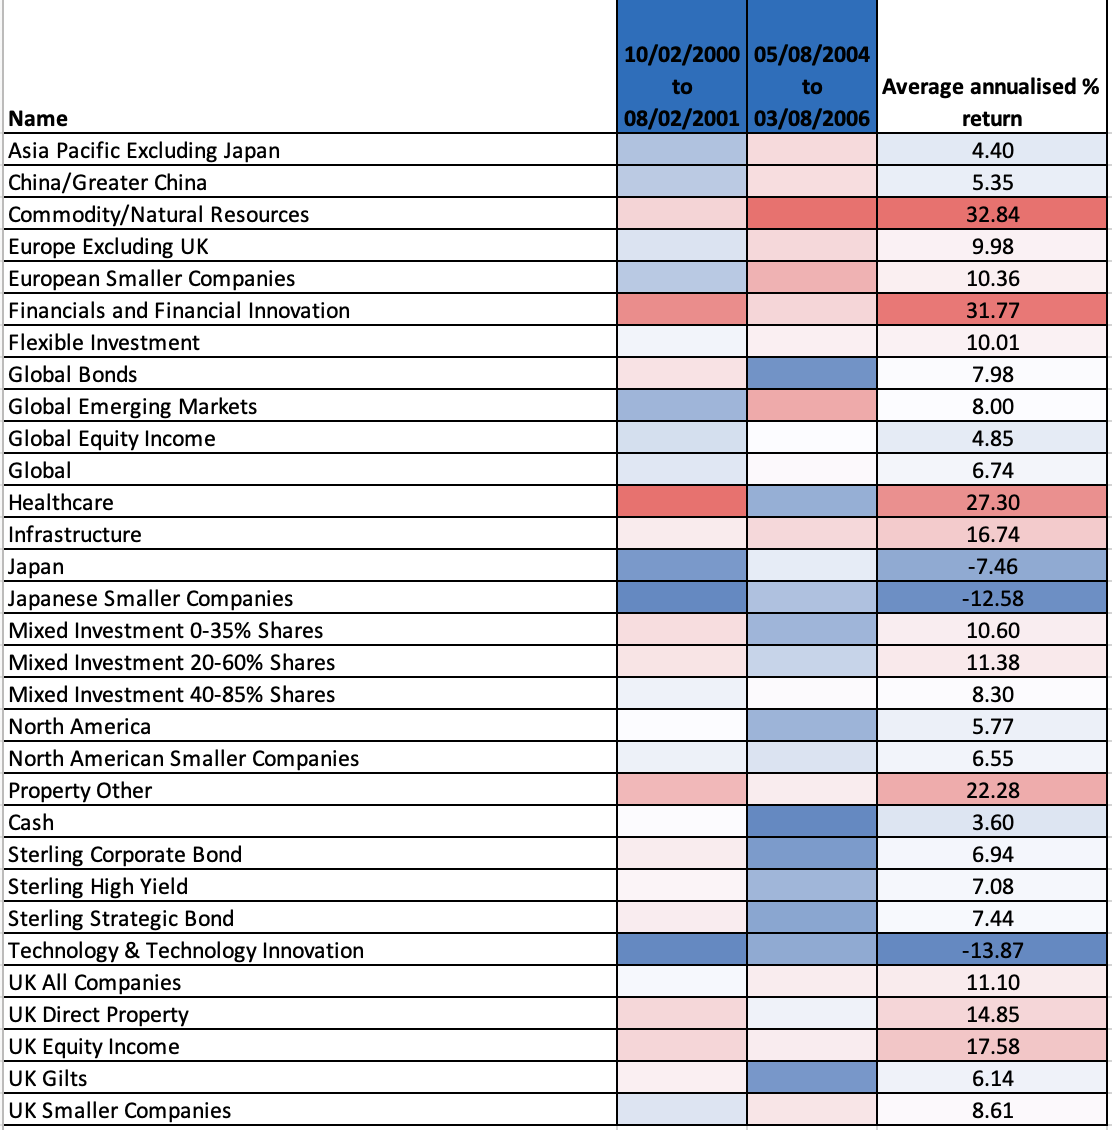
The sample size is small for this scenario but there are still some interesting observations about what happens when rate rises are put on pause. Commodity/Natural Resources were among the best performing assets once again. This can be attributed to increased demand for commodities and resources, driven by strong economic growth, infrastructure development and industrial expansion.
"Property Other" which represents property shares and Direct Property perform better than during the rate rise scenario, presumably a result of investors returning to the sector in the hope of lower debt costs when interest rates start to fall. The average annualised return was over 20%.
Interestingly when the rate pause precedes further rate hikes then assets have behaved as if the market was anticipating what is going to come next. Back in 2000 the pause phase included a small rate reduction which meant assets behaved more in line with the "rate cut" scenario I describe in the next section. In contrast, during the pause phase of 2004-2006 it's as if the market was anticipating further rate hikes (which they eventually got) because assets performed more in line with the "rate rise" scenario explained in the previous section.
As I've already mentioned, the sample size for the pause scenario is too small to give conclusive insights but if we are going to see a pause in the current rate hiking cycle before rates are then cut (as the market is predicting) then it suggests that bonds and property will start to fare better. Interestingly, commodities performed well in both pause periods as did financial stocks. Financials were also one of the most consistent outperformers (except 2022-23) when rates were rising. That makes sense because when interest rates rise banks will often increase the rate of interest they charge on loans to a greater extent than they increase the rate of interest they offer savers. This boosts their profit margins and ultimately their share price. But the greatest surge in their share price appears to occur at the height of the rate rise cycle during the pause phase. Presumably by this point banks are able to boost their profit margins by the greatest degree. During the pause phase financial stocks rose approximately 31.77% per annum.
During aggressive interest rate cuts
When interest rates have been cut in the past there is a clear drive towards safety rather than risk. It means that bonds fared better on a relative basis than equities, with global bonds also presumably getting a currency boost as the pound falls in value. Interestingly Asian equities, especially Japanese equities, fare relatively well too.
It's also those asset classes that tend to have a greater sensitivity to interest rate moves that fare especially well. In the bond space that means UK gilts while in the equity space technology stocks are among the best performers.
But usually when rates are slashed in an aggressive way it is a result of a crisis of some kind, for example the dotcom bubble bursting or the financial crisis. As such equities on the whole perform poorly.
Interestingly it is during aggressive rate cuts that cash comes to the fore presumably as fund managers have managed to lock into higher interest rates ahead of the crash in interest rates.
Final word on gold...
Unfortunately it was not possible to include a gold ETF in this analysis because they were only first introduced in 2003. But it is possible to chart the performance of a gold ETF (iShares gold trust) during the last three time periods, namely the 2006-2007 rate hike, the 2007-2009 rate pause and the current rate hiking cycle.
The performance numbers are shown below. The total return figure for each period is shown first, while the annualised return is shown in brackets to make it easier to compare to the earlier tables.
| 03/08/2006 to 05/07/2007 | 05/07/2007 to 05/03/2009 | 16/12/2021 to 26/06/2023 | |
| iShares gold trust | -5.91% (-5.91%) | 102.25% (52.52%) | 11.89% (7.64%) |
The figures show that during the rate hiking cycle before the financial crisis, gold was one of the worst performing assets. Gold does not provide a yield and as such becomes less attractive when interest rates rise. In contrast, when interest rates are cut gold becomes much more attractive but when they are cut aggressively (which is usually a result of a crisis) investor fear helps drive the price of gold up further. During the aggressive rate cuts following the financial crisis gold more than doubled in value, making it the best performing asset class bar none.
Interestingly during the current rate hiking phase gold has been one of the best performing asset classes thanks to its haven status during a period that has seen the war in Ukraine as well as bonds and equities fall in tandem (which is historically unusual). If the current rate hiking cycle is followed by aggressive interest rate cuts then gold could be a major beneficiary.

£200 Pension Cashback Offer
Make a qualifying deposit or transfer a pension to our partner Interactive Investor.
- Deposit or transfer a pension of at least £20k and you could earn £200 cashback
- Terms and Fees apply, Capital at risk
- New & Existing customers opening a SIPP
- Offer ends 30th June 2026
Before starting your transfer, check you won't lose any valuable benefits (such as guaranteed annuity rates or a lower protected pension age) and find out what exit fees you might have to pay
