

This time last year, I sat down to write my 2025 investment outlook amidst a strange mix of optimism and skepticism. On the one hand, investment banks were optimistic about the year ahead, with their view obscured by recency bias, as it has been in almost every year since I’ve been writing my annual investment outlook. Recency bias is the cognitive tendency to believe that recent events will occur again in the near future, often leading to inaccurate assessments. The average prediction from the major investment banks was for the S&P 500 to rise 12.46% to reach 6,635. Yet there were concerns about the surge in AI-related stocks and the impact on already stretched valuations. This led to fears of a possible dotcom-style crash in 2025. Meanwhile, the potential for a full-blown Trump trade war was a shadow hanging over the market as we entered 2025.
However, as it turned out the majority of investment banks weren’t optimistic enough. At the time of writing, the S&P 500 is now at 6,863. The most bullish institution, Deutsche Bank, targeted 7,000 points, a forecast that seemed aggressive at the time. As we close out 2025 and look toward 2026, reality has once again proven that even the professionals get it wrong. 2025 was a stellar year for equity investors and those who sat on the sidelines missed out.
Although many global stock markets are at or near all-time highs, the past twelve months have not been a steady climb but a series of high-magnitude shocks and subsequent policy-driven recoveries.
On 2nd April 2025, a day now etched in market history as "Liberation Day", the sudden announcement of sweeping tariffs triggered a global market crash. The S&P 500 dropped 12% in a single week, and the VIX spiked to levels not seen since the 2020 pandemic. Yet, as my newsletters highlighted throughout the year, the "TACO" trade (Trump Always Chickens Out) gained popularity as investors correctly bet that initial tariff threats would be followed by negotiation. The subsequent introduction of the One Big Beautiful Bill Act (OBBBA) on 4th July cemented the V-shaped recovery that carried the index to record highs by year-end.
The volatility caused by Trump’s trade war and geopolitics, played out against a backdrop of diverging monetary policy and a weaker US dollar. The latter exerted a significant influence over the winners and losers of 2025. In my 2025 investment outlook I wrote of the US dollar:
“The consensus among investment analysts is for the US dollar to strengthen further as we move into 2025. The strength, or weakness, of the US dollar significantly influences investment markets…
However perhaps we should be wary of a consensus. In 2016, a stronger US dollar was a hallmark of the Trump trade back then. While the dollar initially surged after his 2016 election win, it peaked by the end of that year, before Trump officially took office, and then sharply declined throughout 2017.
Heading into 2025, the [Republicans] will hold the slimmest margin of control in both chambers of Congress for any president since Bill Clinton, indicating a genuine possibility of another "Trump slump" in 2025, with broader implications for investment markets.”
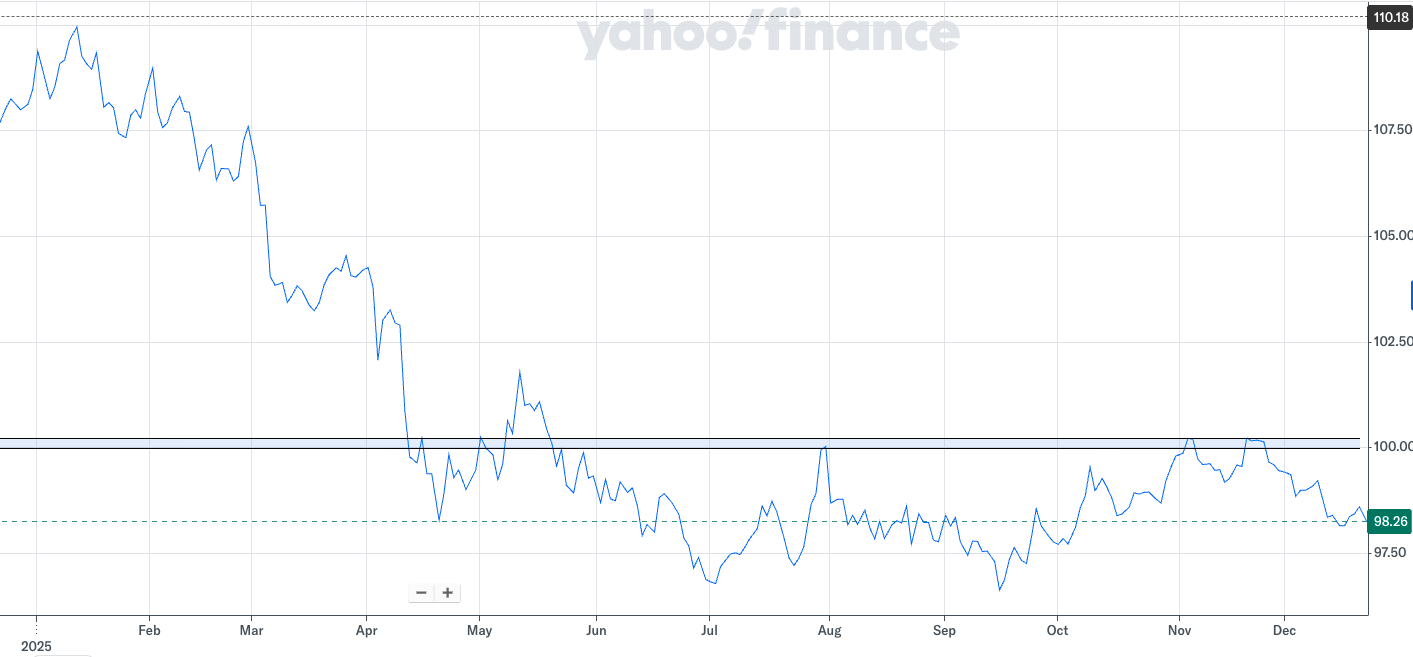
As it turns out the Trump slump 2.0 did materialise in 2025, with the US dollar tumbling in value, as shown in the chart below. And while the US dollar eventually found support in the second half of the year it failed to break back above the resistance zone around the 100 level. The dollar decline was driven by a combination of cooling US inflation and a softening jobs market, which prompted the Federal Reserve to cut interest rates. At the same time while mounting fiscal deficits and moderating economic growth saw investors sell the dollar.
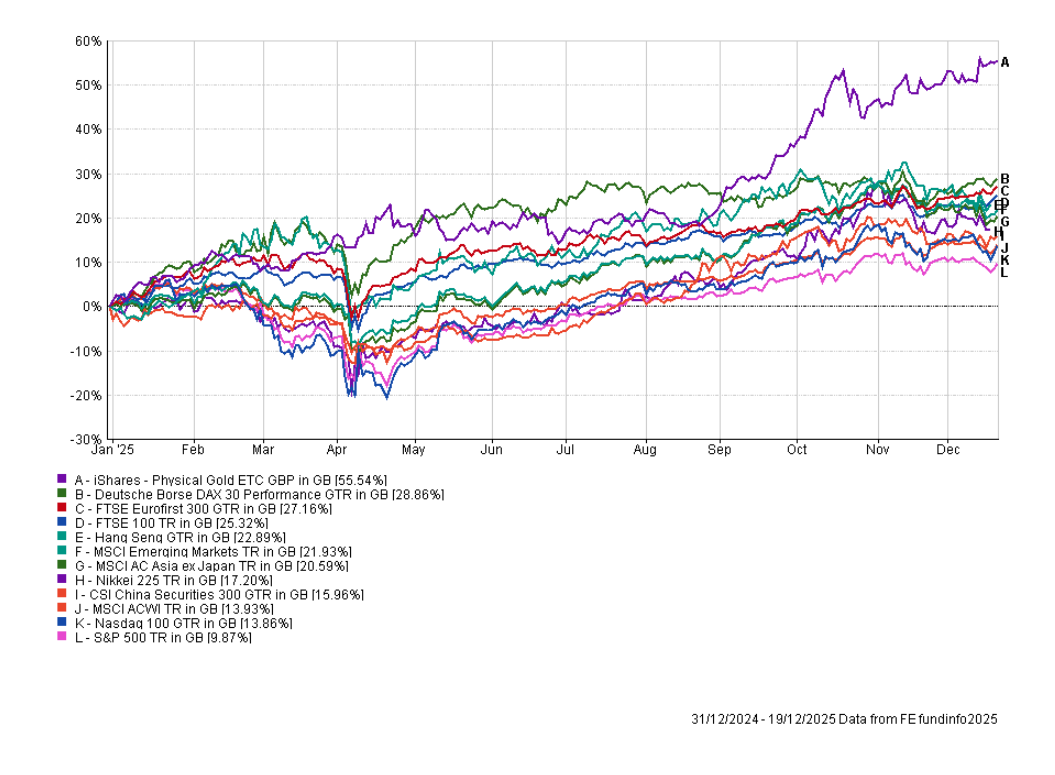
As a result gold, emerging market and Asian equities were among the best performing assets. The chart below shows the return achieved by a UK investor in 2025, taking into account currency moves.
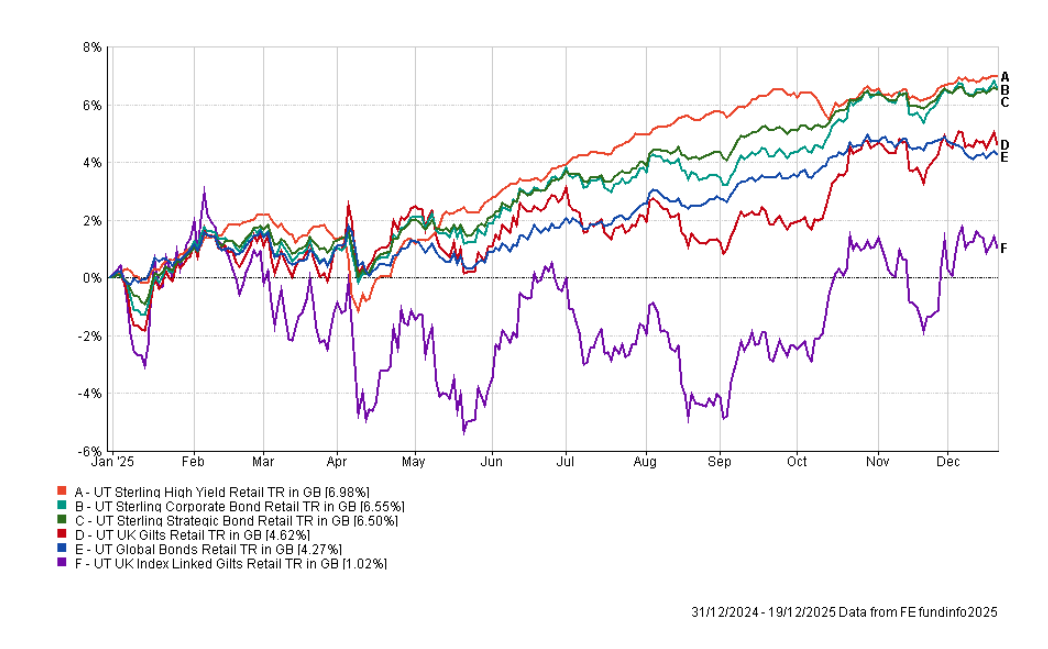
In 2025, bond funds continued where they left off in 2024, with gilts lagging. High yield bond funds led the way but were pegged back by ordinary corporate bond funds.
2026 Outlook
It has become a tradition in these annual outlooks to look at the year-ahead predictions of the major investment banks, primarily as a study in "recency bias" as mentioned earlier.
Just like this time last year, there's an almost complete absence of bearish forecasts. Not a single major firm currently anticipates a decline in the S&P 500 for the coming year. The table below summarises the current year-end 2026 price targets from the major institutions.
| Institution | S&P 500 Forecast (End 2026) | Implied Upside from Current Level |
| Oppenheimer | 8,100 | 18.5% |
| Deutsche Bank | 8,000 | 17.1% |
| Morgan Stanley | 7,800 | 14.1% |
| UBS | 7,700 | 12.7% |
| Goldman Sachs | 7,600 | 11.2% |
| JPMorgan | 7,500 | 9.7% |
| Wells Fargo | 7,500 | 9.7% |
| HSBC | 7,500 | 9.7% |
| Bank of America | 7,100 | 3.9% |
| Average Prediction | 7,644 | 11.9% |
The average prediction of 7,644 implies a return roughly in line with the long-term historical average for the S&P 500 of over 11% However, the bullish case, from the likes of Deutsche Bank and Morgan Stanley, rests on the assumption that double-digit earnings growth will persist for a third consecutive year.
Themes to watch in 2026
As is usual in my annual investment outlook I also look at a number of investment themes to watch. Unusually, the themes and concerns that captured investors attention at the start of 2025, are the same as those at the start of 2026. The main difference is that the stakes have been raised.
Artificial Intelligence
Artificial Intelligence (AI) is the investment theme that grabbed the most investment headlines over the last year. By late 2025, the S&P 500 reached a 23x forward price-to-earnings ratio, far above its 16x average. It means that US stocks are now very expensive by historical standards, thanks largely to investor enthusiasm for all things AI-related. A big question for 2026 is whether AI will finally generate enough profit to justify the capital being spent on it by some of the biggest companies in the world. Cloud titans like Microsoft, Amazon, Alphabet and Meta are projected to spend over $1 trillion on infrastructure, even though 80% of the required $3 trillion in data centres is still unbuilt. The other concern is that we are also seeing circular deals, where companies like Nvidia fund their own customers (such as the recent $100 billion OpenAI deal) to buy their products/services (such as chips), a pattern reminiscent of the dotcom bubble.
If AI earnings don't live up to the hype and the tech leaders stumble, then the US stock market is vulnerable to a deep sell-off. For example, the S&P 500 has approximately a 30% concentration in the largest AI-related stocks, such as those already mentioned. If the US stock market falters then it will likely have wider implications for global stock markets. We could see a wider "risk-off" sentiment drag down global stocks or maybe investors will instead seek better opportunities elsewhere, rather than flee to cash (this is something I cover later).
2026 will be dogged by talk of an AI bubble. It means that investors will have to decide if there is indeed an AI bubble, at what stage we are at (if they believe there is one) and what they should do. To help answer that question I suggest listening to our recent podcast on “Investing through an AI stock market bubble”.
Last year, I wrote that “investors had enjoyed all of the rewards (profits) from investing in AI, but 2025 could be the year when we see the associated risks finally make themselves known”. That turned out not to be the case, which raises the risks further for 2026.
Gold
We started 2025 with the question of whether gold would continue to shine, and the answer was clearly “yes”.
While the technical analysis at the time suggested $3000 per ounce was likely (we were around $2,650 at the start of 2025), a pullback was always likely. Yet, aside from pullbacks in April and November gold surged higher through 2025, fuelled by low interest rates and central bank demand.
Gold finished 2025 over 70% higher than it started 2025, making it the best year for gold since 1979. Those who invested in the precious metal throughout saw their portfolio’s value power higher. So where does the price of gold go from here? From a technical standpoint there is little reason why the precious metal can’t push higher.
Major investment banks are increasingly clustering their 2026 gold price targets between $4,500 and $5,300 per ounce. JP Morgan, one of the more bullish banks, believes gold could hit $5,055 per ounce by the 4th quarter of 2026. That represents a rise of almost 13% from current levels.
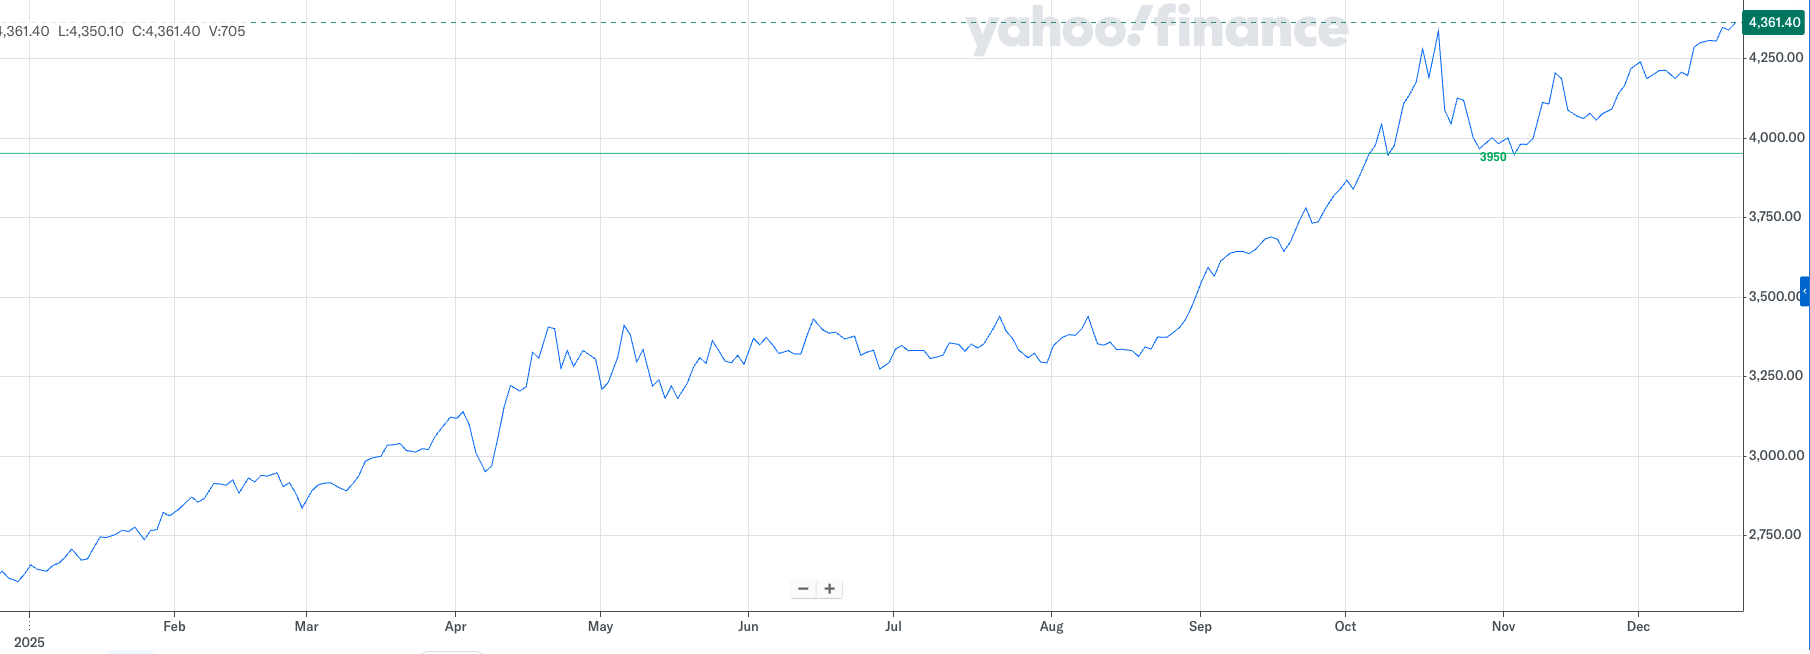
But as we learnt from the US dollar this year, beware of the consensus view. Having said that, it’s probably not until the price of gold falls below 3950 (shown in the chart below) that selling will start to increase and the bull market in gold will be under pressure.
60/40 portfolio
This leads me nicely on to the 60% equity / 40% bond portfolio. After a torrid couple of years the 60/40 portfolio continued its recovery in 2025. Interestingly, at the start of 2025 I highlighted research that showed that when the 10-year US treasury yield is above 4% then it tends to benefit the performance of the 60/40 portfolio versus just investing 100% in the US stock market. This time last year the 10 year US treasury yield was around 4.4% and as the chart below shows, the 60/40 portfolio outperformed the S&P 500, taking into account currency moves.
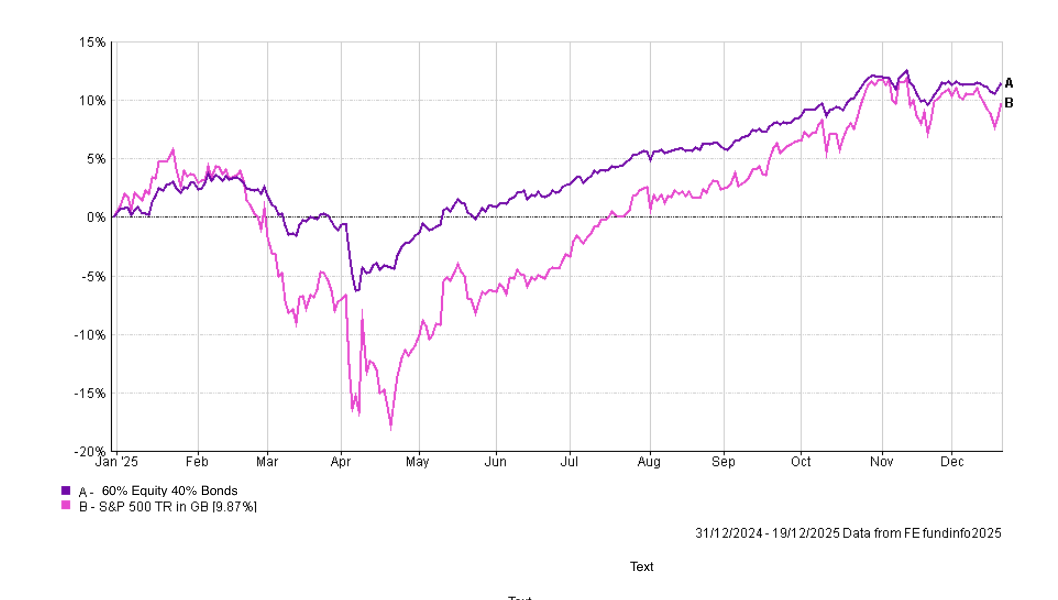
At present the 10 year US treasury yield sits at 4.17%, which suggests that a 60/40 portfolio could fare better in 2026 than a portfolio solely invested 100% in the S&P 500.
Having said that, with gold being one of the best performing assets of 2025, as shown earlier, simply investing in equities and bonds hampered your returns. Compare the above numbers to the 17% return achieved by my portfolio, in 2025 which was partly a result of its exposure to gold.
Not only has there been a performance boost over the last year from looking at alternative assets, but research from State Street Investment Management showed that the diversification benefits of a 60/40 portfolio have evaporated in recent years. The research found that the 36-month rolling average correlation between US treasuries and the S&P 500 has turned positive, meaning that both assets tend to rise and fall at the same time.
Before 2022 the correlation was -0.37, showing a tendency for equities and bonds to perform differently and provide diversification benefits when held in a portfolio. Post-2022, the correlation is now +0.41 This erosion of the hedging property has forced many institutions to rethink portfolio construction to include alternative assets such as gold.
US dollar
The US dollar was one of the primary driving forces behind asset price moves and in determining the winners and losers. At the start of 2025 the consensus was for the US dollar to strengthen. However, most market participants were caught off guard when the Trump slump 2.0 took hold. Those of us who pivoted to emerging/asian equities and gold profited the most.
Outlooks for the US Dollar in 2026 remain mixed across major investment banks. Morgan Stanley forecasts the US Dollar Index (DXY) falling to 94 by the second quarter before rebounding to 100 by year-end. Under this scenario, many 2025 investment trends would likely persist through the first half of 2026 before reversing. Meanwhile, JP Morgan and ING maintain a bearish stance, while Goldman Sachs remains neutral.
Ultimately it remains the case from a technical analysis standpoint that unless the US dollar index rises above 100, shown in the earlier chart, a rebound is unlikely.
Central bank divergence or convergence
A pivotal event for 2026 will be the transition of US Federal Reserve leadership in May. The appointment of a new Fed chair could ideologically align the Fed with Trump’s goal of managing debt through lower interest rates. If that happens it could lead to more accommodative monetary policy. While that might sound positive, if it is at the expense of normalising inflation then the market might become nervous. A second wave of inflation therefore remains a risk, especially if Trump’s proposed $2,000 "tariff dividend" cheques are distributed in mid-2026 ahead of the midterm elections.
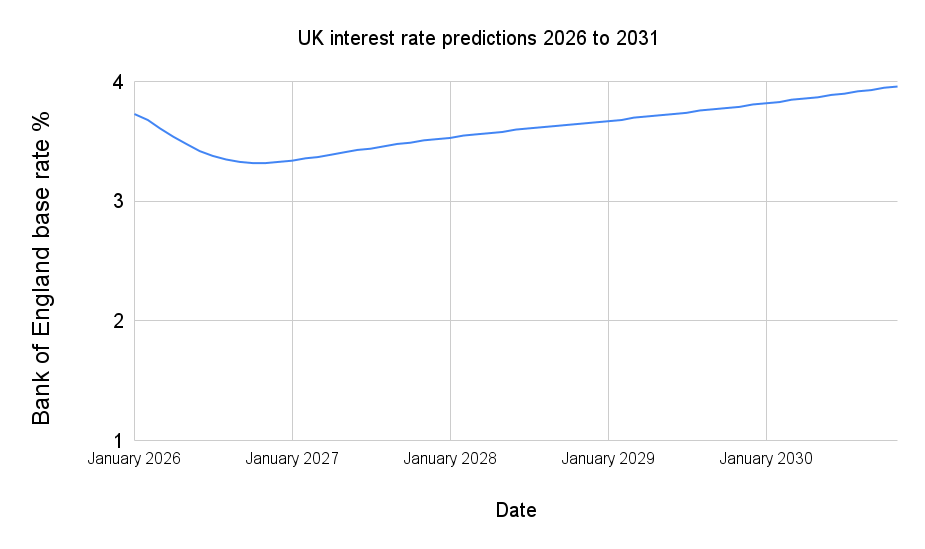
While the US may lean towards pro-growth fiscal policies, other central banks are on different paths. The European Central Bank (ECB) faces sluggish growth and is expected to hold rates. Conversely, Japan is entering a reflationary era; the Bank of Japan (BoJ) raised interest rates to 30-year highs in late 2025 and is expected to continue on this path. Meanwhile in the UK the Bank of England is expected to cut the base rate at least one more time in 2026, as shown below.
But while individual central bank policy decisions may differ, they are all aiming for the neutral rate for their respective economies. While the ECB is likely there, the Fed and the BoE are not quite there yet. Meanwhile, the BoJ is further from it. How central banks manage market expectations will be important if they want to avoid significant market moves, such as the unwinding of the yen carry trade which I've previously written about. Also, central bank policy decisions will be reflected in currency moves, which ultimately (especially in the case of the US dollar) have an impact on the winners and losers of 2026.
It's also worth noting that a second wave of inflation isn't just a potential threat for the US, it is also the case for the UK and the eurozone. That's because the market's baseline assumption that inflation was under control would have to be rewritten which would likely lead to a mass repricing of most assets, and not just stocks and bonds.
Geopolitics
As we enter 2026, there are a number of regional flashpoints that pose a risk to investment markets. These include:
The Russia-NATO Frontier: While some hope for a Russia-Ukraine peace agreement, 2026 could see an intensification of the war as Russia attempts to erode European morale. The cost to rebuild Ukraine is currently estimated at $550 billion, a figure that will only rise the longer the conflict remains unresolved.
Taiwan: A Chinese annexation or invasion of Taiwan remains a catastrophic tail-risk. Such an event would massively disrupt shipping routes in East and Southeast Asia, halt Taiwanese chip production, and lead to a potential collapse of global supply chains. It would also likely ratchet up tensions between the US and China.
Venezuela: In late 2025, President Trump announced a "total and complete" naval blockade of sanctioned Venezuelan oil tankers, ramping up pressure on Nicolas Maduro to relinquish power. The interception and seizure of vessels triggered a sharp spike in geopolitical risk, which fuelled a "safe-haven" rush that pushed gold to record highs again. A direct military confrontation in Latin America could destabilise global crude markets and trigger volatility in equity markets.
Middle East: Despite US-led ceasefire efforts, tensions between Israel and Iran are expected to remain high. The risk of a renewed regional conflict, particularly one that disrupts energy routes in the Red Sea, continues to be a concern.
Value vs Growth
The table below shows how growth stocks have dominated value stocks over the last few years, with the "Mag-7" delivering returns that smashed value strategies. However, as we enter 2026, there are signs that the tide is starting to turn. The recent rotation out of tech stocks began in November 2025, and saw mega-cap tech stocks fall 1.1% in a single month to end a seven-month winning streak. This may suggest that AI bubble fears are finally impacting investor positioning.
For 2026, opportunities may lie in the broadening of the bull market. If large tech stocks begin to struggle, non-tech sectors such as financials and utilities could see continued inflows as investors seek better value opportunities. If this were to happen then the FTSE 100 might outperform the S&P 500 once again in 2026. Historically, value outperforms in difficult or rising-rate markets, often when interest rates are rising. Could 2026 be the year of the value investor?
| Year | MSCI ACWI Growth | MSCI ACWI Value |
| 2025 | 14.18 | 13.48 |
| 2024 | 26.45 | 12.74 |
| 2023 | 25.71 | 5.5 |
| 2022 | -19.61 | 4.1 |
| 2021 | 18.18 | 20.72 |
| 2020 | 29.47 | -3.41 |
| 2019 | 27.6 | 15.93 |
| 2018 | -2.42 | -5.24 |
| 2017 | 18.75 | 8.02 |
| 2016 | 23.18 | 34.28 |
| 2015 | 7.43 | -0.83 |

£200 Pension Cashback Offer
Make a qualifying deposit or transfer a pension to our partner Interactive Investor.
- Deposit or transfer a pension of at least £20k and you could earn £200 cashback
- Terms and Fees apply, Capital at risk
- New & Existing customers opening a SIPP
- Offer ends 31st July 2026
Before starting your transfer, check you won't lose any valuable benefits (such as guaranteed annuity rates or a lower protected pension age) and find out what exit fees you might have to pay
