

In May's monthly newsletter I said that I would look at the changes in the 80-20 Investor Best of the Best fund selection in more detail.
This month has seen a big change in the funds making the grade and being including in our Best of the Best selection.
Of the 26 funds that were in April's Best of the Best list 8 remain in May's selection. These are:
- 7IM - Unconstrained
- Aviva Inv - High Yield Bond
- Baring - Eastern Trust
- First State - Global Property Securities
- GLG - Continental Europe
- Jupiter - European
- M&G - Japan
- Threadneedle - China Opportunities
This is a lower proportion then the previous month and marks a turning point in a number of macro investment themes. This becomes even clearer when you look at the sectors (types of funds) that are included this month.
The table below shows the list of different sectors that were included in 80-20 Investor's Best of the Best selection for the month of April & May.
| April's sectors | May's sectors |
| Asia Pacific Excluding Japan | Asia Pacific Excluding Japan |
| China/Greater China | China/Greater China |
| Europe Excluding UK | Europe Excluding UK |
| Global | Global Emerging Markets |
| Japan | Japan |
| Mixed Investment 0%-35% Shares | Mixed Investment 0%-35% Shares |
| Mixed Investment 20%-60% Shares | Mixed Investment 20%-60% Shares |
| North America | Property |
| Property | Sterling High Yield |
| Sterling High Yield | Sterling Strategic Bond |
| Targeted Absolute Return | Targeted Absolute Return |
| UK All Companies |
One of the big trends to notice is that North American equities and Global funds have been ditched. American shares had an amazing 2014 and were key drivers in the outperformance of the 80-20 Investor selection at the end of 2014 and into early 2015 (see chart below).
Yet now the strong dollar, which was seen as a positive to start with, is now hitting company profits. Big US multi-national companies with significant revenues abroad are seeing those profits hit by the exchange rate when they repatriate them. The upshot is that US equities had a difficult April. Global funds are almost always heavily skewed to the US (which is a bit of a bugbear of mine) so as US equities have slipped out of the Best of the Best selection so inevitably have the Global funds. That is not to say that US funds are awful, just that better opportunities have arisen in the medium risk area of the portfolio.
Yet in the high risk section emerging market funds have crept in and that is almost solely because of the huge rally in Chinese equities. Read my article Chinese equity funds – bubble or buy? for more on the subject. This has also happened because Japan funds have been re-rated from high risk to medium. Why has this happened? Well largely because the volatility (the big swings up and down) in Japanese equities has fallen in recent months.
Interestingly a UK fund has crept into the Best of the Best selection which perhaps is not surprising given the good run UK shares have had recently. Whether this can be maintained after the General Election will be interesting to see.
If you analyse all the holdings (both bonds and equities) within the Best of the Best selection the geographical split is roughly
- Europe ex UK - 21%
- Pacific Basin (including China) - 16%
- UK - 15%
- Japan - 14%
With the rest split across other geographical regions. It's a bold mix but successful investing is not about making comfortable decisions.
80-20 Investor Best of the Best fund performance - since inception August 2014
To make the comparison I have assumed that an investor bought all of the 80-20 Best of the Best funds in equal measure and switched them every month. The chart shows the level of outperformance since we began tracking the 80-20 Investor Best of the Best selection back in August 2014. The 80-20 selection is up 13.85% (green line) versus 9.57% for the average managed fund (black line) and 7.62% for the FTSE 100 (red line).
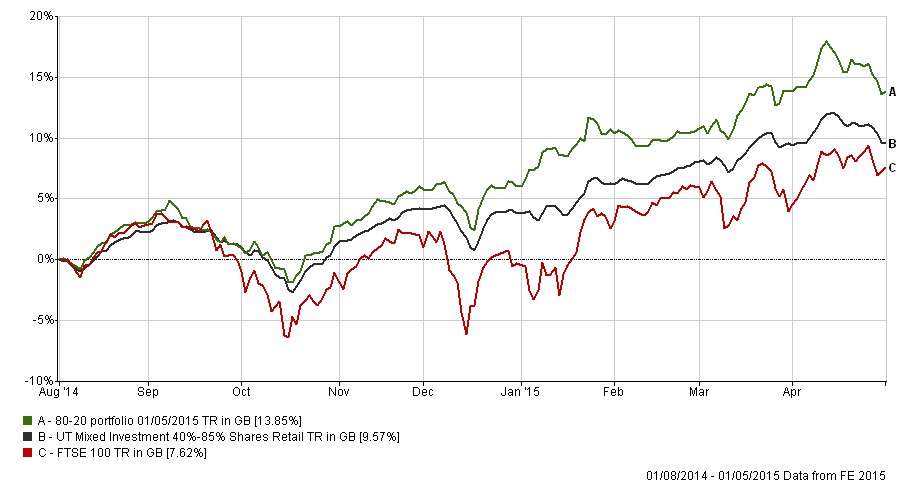
That is a huge outperformance in just 9 months.
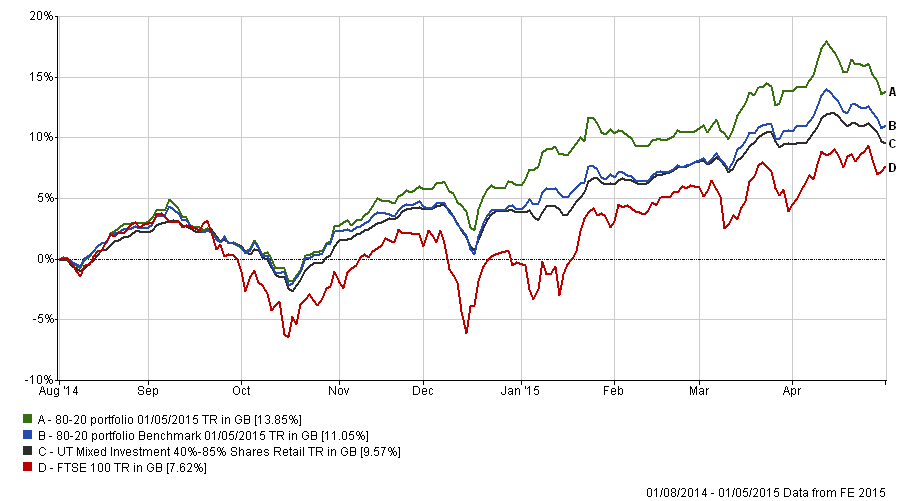
However, some may claim that the average managed fund may not invest in the same assets as the 80-20 fund selection and that the comparison might be unfair. So below I have replicated the chart above and this time added in another benchmark, the blue line. This is the return you would have got just simply by following the asset allocation of the 80-20 Investor selection (i.e buying the same proportion of Japan funds, US funds etc). It uses the returns from the average fund in each of the relevant sectors. What it shows is that it outperforms the average managed fund. Yet more importantly it shows the power and importance of picking the right funds within each sector, demonstrated by how much the 80-20 portfolio line is above this benchmark. So the 80-20 Investor algorithm helps ensure you are in the right sectors and the right funds!
Long may this outperformance continue!
All performance figures are net of fund charges. The material in any email, the MonetotheMasses.com website, associated pages / channels / accounts and any other correspondence are for general information only and do not constitute investment, tax, legal or other form of advice. You should not rely on this information to make (or refrain from making) any decisions. Always obtain independent, professional advice for your own particular situation. See full Terms & Conditions and Privacy Policy
Neither MoneytotheMasses.com/80-20 Investor nor its content providers are responsible for any damages or losses arising from any use of this information. Past performance is no guarantee of future results.
Funds invest in shares, bonds, and other financial instruments and are by their nature speculative and can be volatile. You should never invest more than you can safely afford to lose. The value of your investment can go down as well as up so you may get back less than you originally invested.
Information provided by MoneytotheMasses.com/80-20 Investor is for general information only and not intended to be relied upon by readers in making (or not making) specific investment decisions.
Appropriate independent advice should be obtained before making any such decisions. Leadenhall Learning (owner of MoneytotheMasses.com/80-20 Investor) and its staff do not accept liability for any loss suffered by readers as a result of any such decisions.
The tables and graphs are derived from data supplied by Trustnet. All rights Reserved.

£200 Pension Cashback Offer
Make a qualifying deposit or transfer a pension to our partner Interactive Investor.
- Deposit or transfer a pension of at least £20k and you could earn £200 cashback
- Terms and Fees apply, Capital at risk
- New & Existing customers opening a SIPP
- Offer ends 31st July 2026
Before starting your transfer, check you won't lose any valuable benefits (such as guaranteed annuity rates or a lower protected pension age) and find out what exit fees you might have to pay
