

On Monday a Financial Times headline asked the question "Is Britain now in a full blown economic crisis?". It was in response to the carnage we've experienced in investment markets over the last week, triggered by the current government's mini-Budget statement.
On 23rd September 2022, a day after the Bank of England once again raised its base rate by 0.5%, Chancellor Kwasi Kwarteng set out a plan for the biggest wave of tax cuts in 50 years. These included changes to national insurance, income tax and even stamp duty. This wave of tax cuts came hot on the heels of the energy price guarantee announced weeks earlier. But it was the scale of the tax cuts, which would need to be funded by increased government borrowing, in the absence of a corresponding cut in spending, that shook markets.
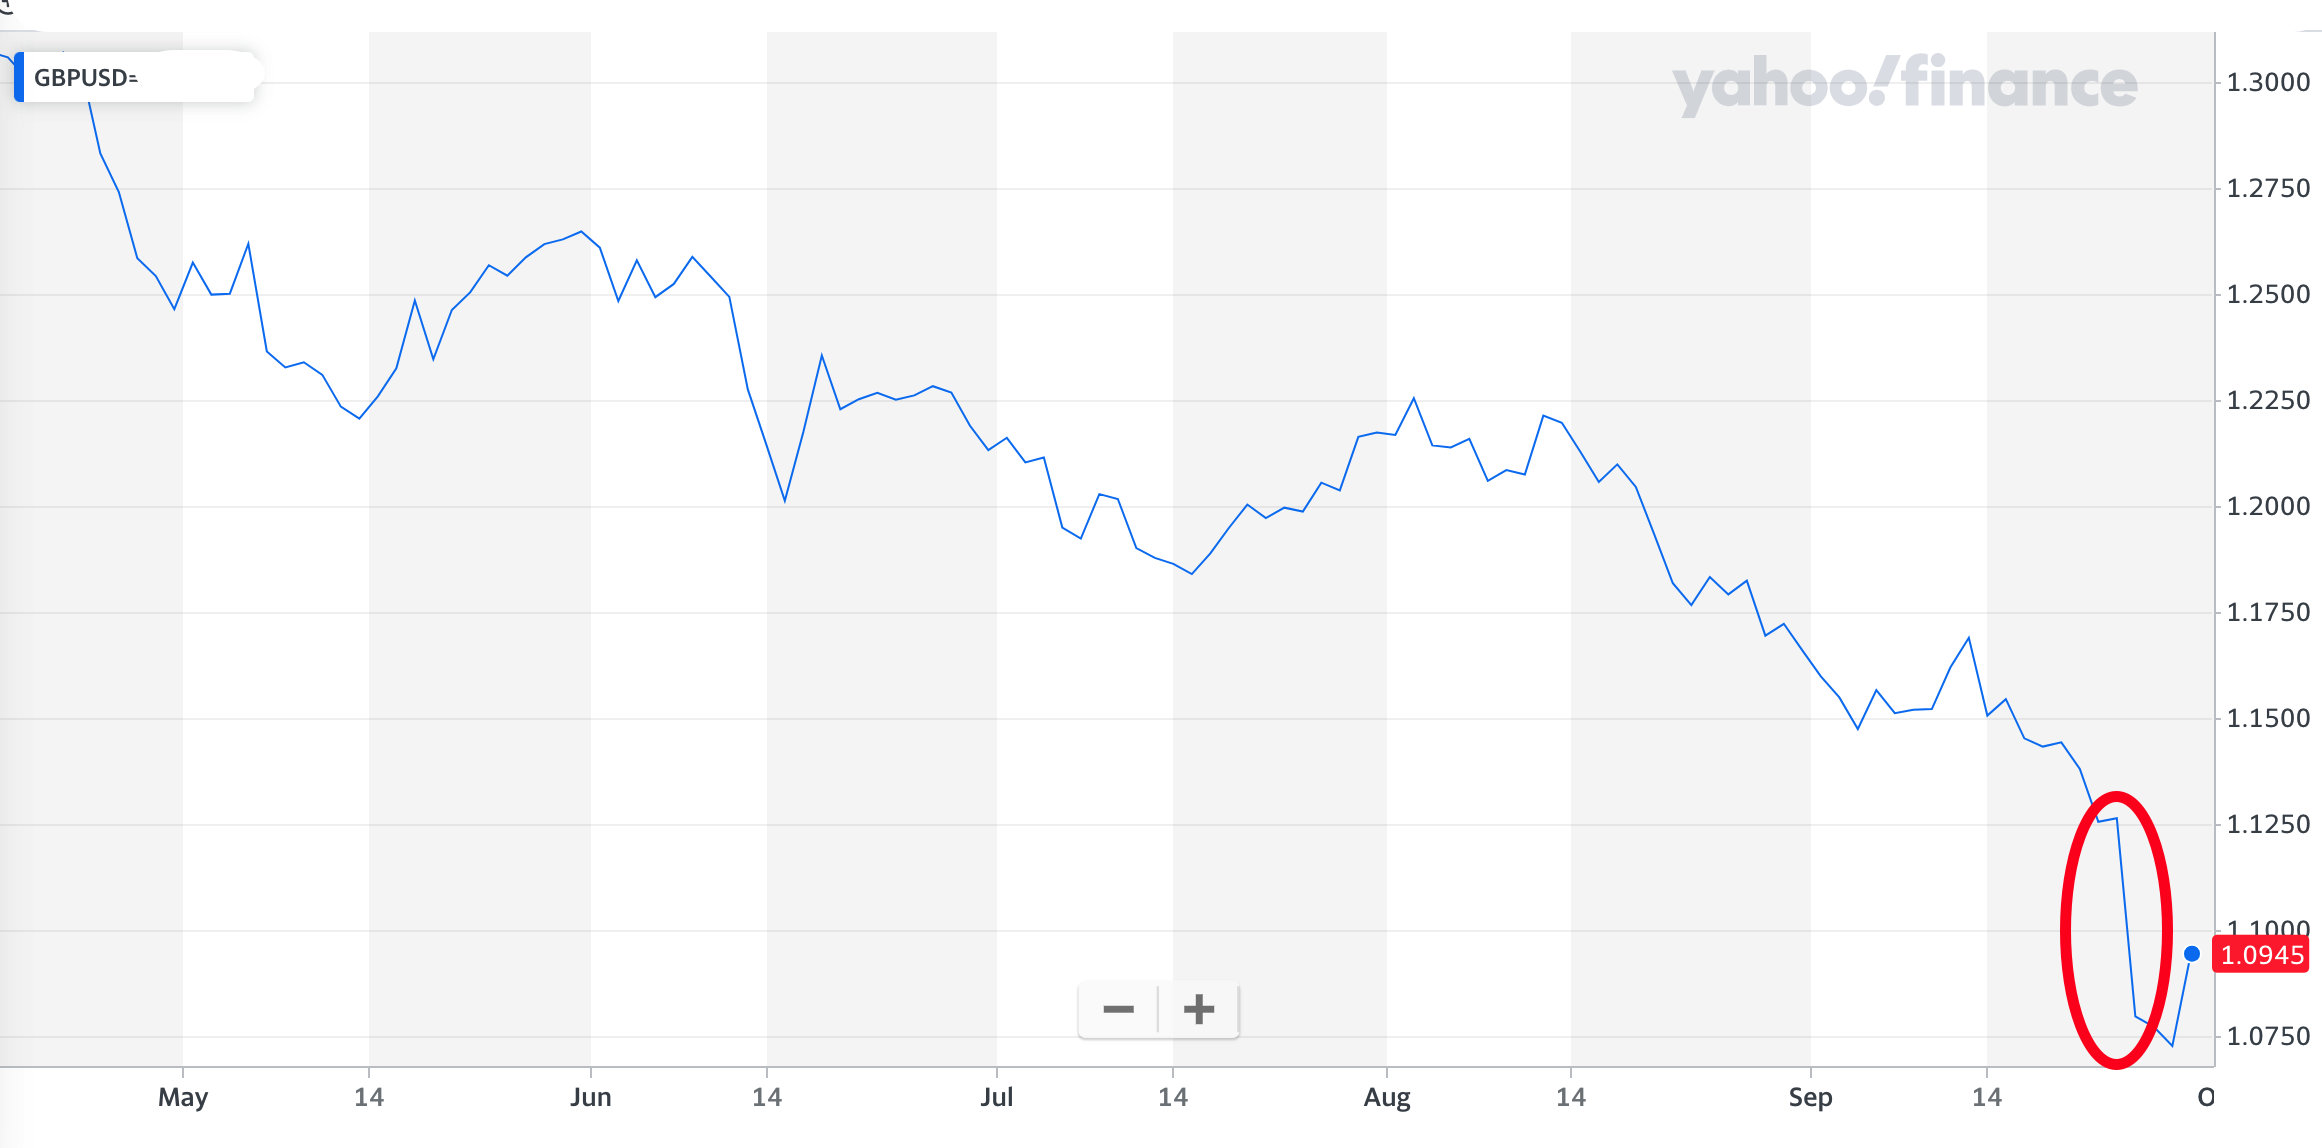
The chart below shows how the value of the pound crashed to a new all-time low against the US dollar.
Meanwhile government bond yields (gilt yields) rocketed as investors began questioning the UK's ability to manage the required level of borrowing. The jump in yields was phenomenal, because what would normally take years to occur, took place in a matter of days. The rise in gilt yields saw the UK mortgage market freeze and the Bank of England forced to step in to stop a number of final salary pension schemes imploding. The Bank of England's (BOE) action is a temporary sticking plaster (essentially restarting Quantitative Easing again) in an attempt to stabilise gilt yields. While the BOE action has proved successful for the time being, at the time of writing gilt yields are rising again as Prime Minister Liz Truss doubles down on her determination to deliver the mini-Budget.
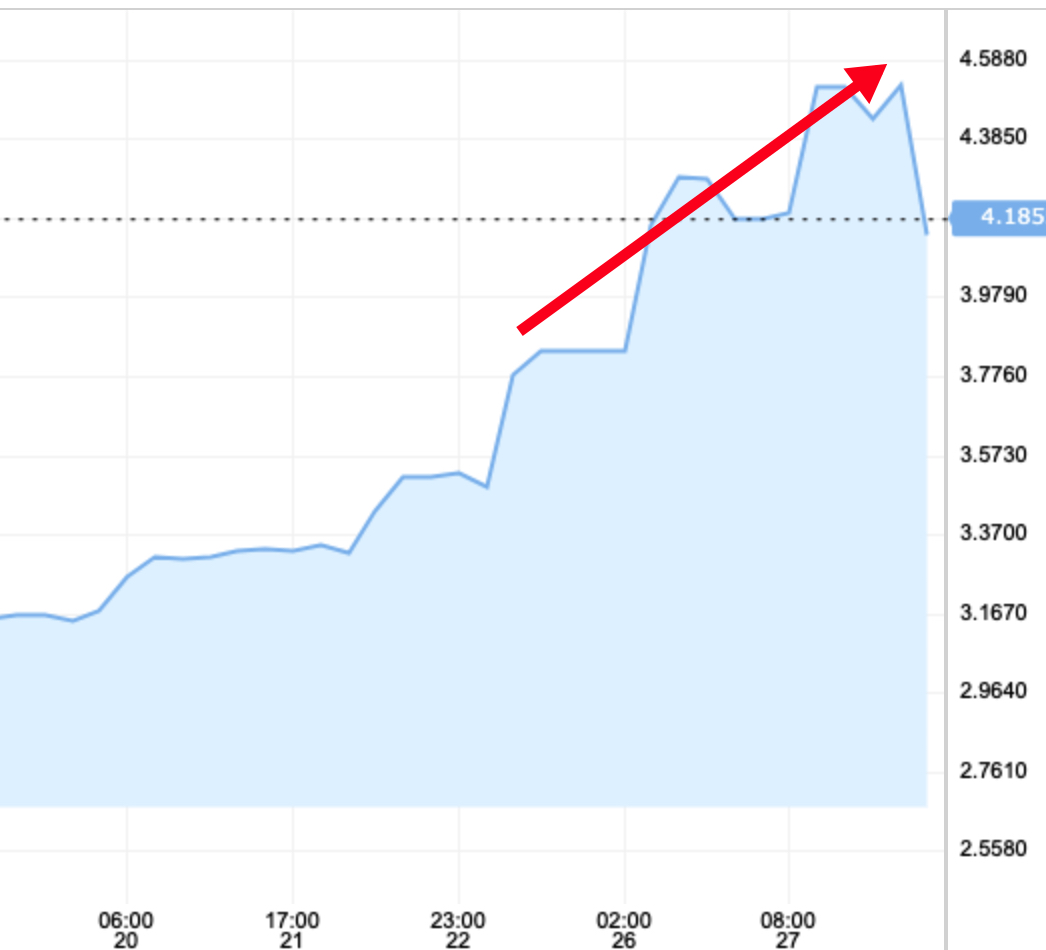
The chart below shows the 10 year gilt yield over time. Such a surge in gilt yields had repercussions across global bond markets, causing yields to rise, but by much smaller degrees. The 10 year US treasury, for example, rose from 3.708% to 3.964%, which was a quarter of the rise we saw in the equivalent UK gilt. This more muted rise means that the 10 year US treasury yield is now lower than that of the 10 year UK gilt, with the latter hitting its highest rate since October 2008 (during the financial crisis).
The UK's economic crisis has had a global impact but most of the damage is very much centred around the UK, in particular UK assets (mainly the value of the pound and gilt prices) as investors raise the alarm over the UK's fiscal plans. Even the International Monetary Fund (IMF) has now openly criticised the UK government's fiscal plan and urged the Chancellor and the Prime Minister to change course.
But what if they don't and what if we see more problems centred around the UK?
Market meltdown
The table below shows the average performance of different assets in the aftermath of the mini-Budget and before the BOE's intervention. You can see the damage done to UK gilt funds as well as UK equity funds.
| Sector | % return post mini-Budget up until Bank of England intervention |
| China/Greater China | 3.64 |
| European Smaller Companies | 1.84 |
| Healthcare | 1.81 |
| Europe Excluding UK | 1.49 |
| Technology and Technology Innovations | 1.35 |
| Japanese Smaller Companies | 1.02 |
| Asia Pacific Excluding Japan | 0.86 |
| North America | 0.8 |
| North American Smaller Companies | 0.54 |
| Global | 0.53 |
| Global Emerging Markets | 0.46 |
| Global Equity Income | 0.38 |
| Financials and Financial Innovation | 0.09 |
| Standard Money Market | -0.01 |
| Japan | -0.09 |
| UK Direct Property | -0.22 |
| Global EM Bonds Hard Currency | -0.25 |
| Flexible Investment | -0.3 |
| Global EM Bonds Local Currency | -0.32 |
| India/Indian Subcontinent | -0.47 |
| UK All Companies | -0.58 |
| Mixed Investment 40-85% Shares | -0.62 |
| Global Bonds | -0.83 |
| Targeted Absolute Return | -0.95 |
| Mixed Investment 20-60% Shares | -1.14 |
| UK Equity Income | -1.24 |
| Global EM Bonds Blended | -1.26 |
| Mixed Investment 0-35% Shares | -1.36 |
| Sterling High Yield | -1.63 |
| UK Smaller Companies | -1.7 |
| Property Other | -1.98 |
| Sterling Strategic Bond | -2.01 |
| Infrastructure | -2.75 |
| Sterling Corporate Bond | -3.3 |
| Commodity/Natural Resources | -3.69 |
| UK Gilts | -4.54 |
| Latin America | -5.03 |
| UK Index Linked Gilts | -13.57 |
Now of course there are many factors that influenced asset price moves during this week's sell-off but the impact of the falling pound and, more importantly, rising UK bond yields can be seen when you look at the pattern of winners and losers above. Overseas bond and equity funds got a currency boost, while sectors that typically have less exposure to UK bond/gilts and equities also fared better.
Final salary pension schemes in the UK do not take excess risks in order to meet their future liabilities. However the crash in UK gilts, which these pension funds hold a lot of, threatened to make many of them insolvent (the exact mechanics of why is not important) which is why the BOE stepped in to support the gilt market by buying billions of pounds worth of long dated gilts. Of course, ordinary investors have also been hit by the crisis enveloping the UK economy, especially in the supposedly low risk part of their portfolios. Whether the Bank of England can prevent further damage remains to be seen but assuming not, then which low risk funds will take the brunt of the storm? After all, those investors who have been sheltering in bonds (not my £50k portfolio) this year have seen significant losses already.
Factors which will impact a fund's performance include its exposure to currency moves, uk bonds/gilts as well as duration risk. UK index linked gilt funds hold gilts with large duration risk (an explanation of duration risk can be found here) and do not benefit from a weak pound. The perfect storm.
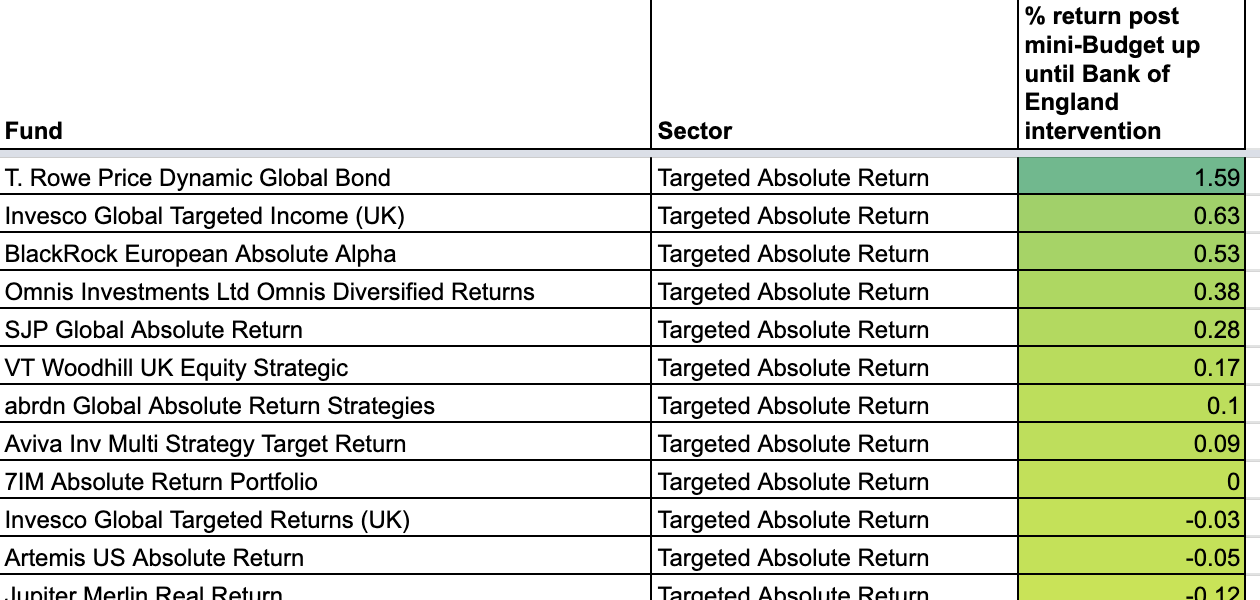
By analysing the performance of individual funds over the period between the Chancellor announcing his mini-Budget up until the BOE intervened in markets this week, it is possible to identify the biggest losers in a potential UK economic crisis. In doing so I have produced two heatmaps below.
I have used the broader assumption of low-risk funds by analysing funds in the sectors listed below, rather than use the 80-20 Investor definition which analyses the risks taken by individual fund managers. Obviously that means UK Index Linked Gilts are in the list, when typically they would not meet the 80-20 Investor low risk definition. But by including all the funds in these sectors I ensure that I cover all of the funds that investors "believe" are low-risk.
The sectors analysed are:
- Mixed Investment 0-35% Shares
- Global Bonds
- Sterling Strategic Bond
- Sterling Corporate Bond
- Sterling High Yield
- UK Gilts
- UK Index Linked Gilts
Low risk funds (by sector) in a UK economic crisis
The first one shows the performance of each fund, relative to its peer group, from when the Chancellor announced his mini-Budget up until the BOE intervened in markets. In this chart the colour-coding is done on a sector by sector basis. So green represents the funds that outperformed their sector peers. While red represents those that unperformed their sector peers. Click on the image to download the full list.

Low risk funds during a UK economic crisis
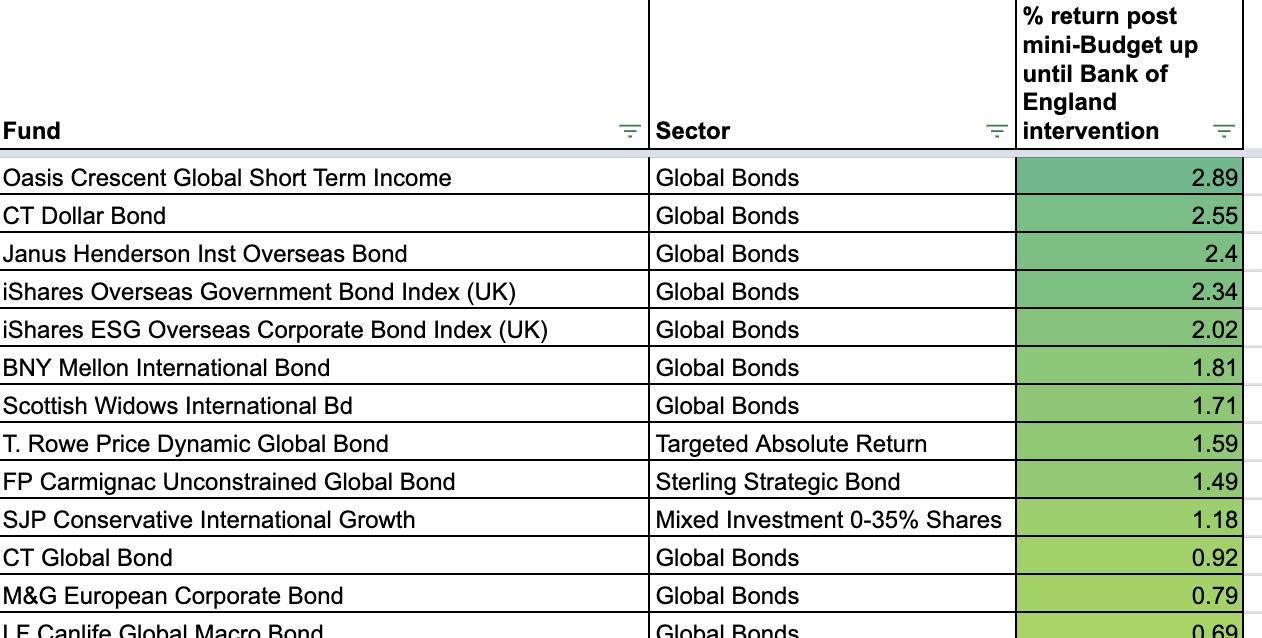
The second chart shows the performance of each fund versus every fund analysed, irrespective of the sector they reside in, from when the Chancellor announced his mini-Budget up until the BOE intervened in markets.
In this chart the colour-coding is based on the entire table. So green represents the funds that outperformed all funds analysed across the sectors. While red represents those that underperformed. Click on the image to download the full list.


£200 Pension Cashback Offer
Make a qualifying deposit or transfer a pension to our partner Interactive Investor.
- Deposit or transfer a pension of at least £20k and you could earn £200 cashback
- Terms and Fees apply, Capital at risk
- New & Existing customers opening a SIPP
- Offer ends 31st July 2026
Before starting your transfer, check you won't lose any valuable benefits (such as guaranteed annuity rates or a lower protected pension age) and find out what exit fees you might have to pay
