

Research has shown that the sectors and asset classes you invest in are more important than the underlying stocks or shares which you buy. For example if the US stock market was to plummet the differentiator between the most successful investors and those who lose the most money is not which US shares they'd bought but whether they had any at all.
Yet for investors deciding which assets to buy to minimise risk yet maximise returns is a minefield, especially as there is a lot of conventional wisdom out there not backed up by research.
As it is ISA season one of the most popular questions I get asked is 'where should I invest my ISA allowance?' It's a difficult one to answer as there are so many factors to take into account including your investment term, your attitude to risk and what is going on in investment markets.
Yet rather than shy away from this question I decided to do some analysis to discover what is the perfect ISA portfolio and even if one exists. Is there a perfect combination of different types of assets that can not only make you money but reduce the chance of you losing any?
Perfect ISA Portfolio
So I laid down the rules for the perfect ISA portfolio:
- There would be no constraint over which assets could be included or in what proportions they are held
- The portfolio must have made money every tax year since the last market peak back in 2000
- and not lost money
- It had to at least beat a FTSE 100 Index tracker and
- The asset allocation had to remain constant throughout that time (being rebalanced each year)
So in essence I wanted to find the perfect 'buy and forget' asset allocation. One which would have achieved the above irrespective of the actual funds you'd bought. So to make sure I was only looking at the asset allocation I always used the sector average return for each asset.
The possible assets
I included the following unit trust sectors in my analysis:
- Asia Pacific Excluding Japan
- China/Greater China
- Europe Excluding UK
- European Smaller Companies
- Flexible Investment
- Global Bonds
- Global Emerging Market Bond
- Global Emerging Markets
- Global Equity Income
- Global
- Japan
- Mixed Investment 0%-35% Shares
- Mixed Investment 20%-60% Shares
- Mixed Investment 40%-85% Shares
- Cash
- North America
- North American Smaller Companies
- Property
- Sterling Corporate Bond
- Sterling High Yield
- Sterling Strategic Bond
- Technology & Telecoms
- UK All Companies
- UK Equity Income
- UK Gilts
- UK Index - Linked Gilts
- UK Smaller Companies
The number of possible combinations of the above is almost mind-blowing. In fact it took me two full days to analyse it. Of course there was no guarantee that there was a solution to the problem, that's what makes the best research and analysis.
The perfect portfolio revealed
Interestingly, despite the global possibilities the perfect portfolio is
- 9% cash
- 71% UK Gilts
- 20% UK Equity Income
What is key is the ratio of cash/bonds to equities. As it turns out there was a hint towards this outcome in a separate piece of research which I also recently carried out on the correlations between different asset classes. It showed that over the 14-15 year period since 2000 the only negatively correlated asset to UK equities (i.e. when UK equities go down the other asset goes up) is UK Gilts. For those of you who are unaware gilts are essentially loans to the UK Government so have one of the lowest risk ratings of all assets, besides cash.
Also there seems to be some truth in the perceived wisdom that UK equity income funds tend to perform better than UK All Companies funds in a downturn, hence their inclusion.
So below are the returns achieved by this portfolio in each tax year since 2000 vs the FTSE 100 for reference:
| Tax year | FTSE 100 | Perfect ISA |
| 2000 | -11.13 | 3.23 |
| 2001 | -4.11 | 0.3 |
| 2002 | -24.52 | 0.63 |
| 2003 | 21.3 | 4.69 |
| 2004 | 14.46 | 6.38 |
| 2005 | 26.34 | 10.27 |
| 2006 | 9.37 | 2.47 |
| 2007 | -3.63 | 0.86 |
| 2008 | -29.94 | 0.02 |
| 2009 | 50.49 | 7.71 |
| 2010 | 7.95 | 4.78 |
| 2011 | -1.74 | 9.87 |
| 2012 | 13.44 | 6.83 |
| 2013 | 11.04 | 0.6 |
| 2014 so far | 6.62 | 9.54 |
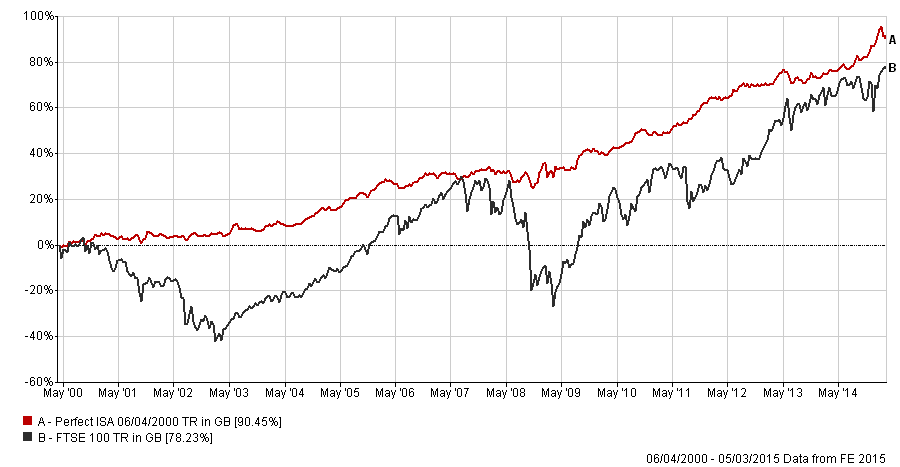
Here is how it actually performed over time cumulatively. The Perfect ISA portfolio is in red while the FTSE 100 is in black. You can see that an initial sum invested back in 2000 would have almost doubled using the Perfect Portfolio (click on the image to enlarge):
What is interesting is that the Perfect ISA portfolio is backed up by a piece of research I published in December titled Funds to ‘buy & forget’ in 2015 which highlighted Vanguard – LifeStrategy 20% Equity as a fund to buy. At the time I speculated whether it had the perfect asset allocation due to its ability to make money in market sell-offs. The fund has 20% of assets in fixed interest (bonds and gilts) and the rest in equities globally, not just the UK.
Interestingly my findings also resonate somewhat with the “permanent portfolio”, advocated by the famous American investor Harry Browne, which invests 25% in gold, 25% in cash, 25% in US Treasuries (America's version of gilts) and 25% in US equities.
The 80-20 Perfect Portfolio
Some of you might then ask whether you should just buy a passive tracker, like the Vanguard fund, with the split above.
The answer is no, not if you want to maximise your returns. Now let's imagine that someone had used 80-20 Investor to choose the UK equity income funds to invest in for the 20% part of the Perfect ISA portfolio invested in equities.
Could using 80-20 Investor just on that tiny portion of the portfolio make any difference? Given that there are so few gilt funds we will take the average fund return for that sector in this exercise.
The table below shows how much money an investor would have today if at the start of each tax year they had invested their full ISA allowance into:
- the FTSE 100
- the Perfect Portfolio using trackers
- the 80-20 Investor Perfect Portfolio where our algorithm chooses the UK Equity income funds (I've split the 20% across 3 funds each time).
The ISA allowance has increased from £7,000 to £15,000 over the last 14-15 years. So if someone had invested their ISA allowance each year they would have invested a total of £125,960
| Total Invested | £125,960 |
| Perfect ISA portfolio | £185,190 |
| 80-20 Perfect ISA portfolio | £194,894 |
Being an active investor would have made you £9,704 more!
Is the perfect portfolio foolproof
It is foolproof to apply yet is not guaranteed to make you money going forwards, particularly as we near the end of a 30 year bond bull market. However, if you are a particularly conservative investor it provides a point of reference. There is a big upside tradeoff from having a portfolio which protects on the downside. By way of example if an investor had simply invested in UK equity funds using our momentum strategy their £125,960 would now be worth approximately £384,800.
The material in any email, the MonetotheMasses.com website, associated pages / channels / accounts and any other correspondence are for general information only and do not constitute investment, tax, legal or other form of advice. You should not rely on this information to make (or refrain from making) any decisions. Always obtain independent, professional advice for your own particular situation. See full Terms & Conditions and Privacy Policy
Neither MoneytotheMasses.com/80-20 Investor nor its content providers are responsible for any damages or losses arising from any use of this information. Past performance is no guarantee of future results.
Funds invest in shares, bonds, and other financial instruments and are by their nature speculative and can be volatile. You should never invest more than you can safely afford to lose. The value of your investment can go down as well as up so you may get back less than you originally invested.
Information provided by MoneytotheMasses.com/80-20 Investor is for general information only and not intended to be relied upon by readers in making (or not making) specific investment decisions.
Appropriate independent advice should be obtained before making any such decisions. Leadenhall Learning (owner of MoneytotheMasses.com/80-20 Investor) and its staff do not accept liability for any loss suffered by readers as a result of any such decisions.
The tables and graphs are derived from data supplied by Trustnet. All rights Reserved.

£200 Pension Cashback Offer
Make a qualifying deposit or transfer a pension to our partner Interactive Investor.
- Deposit or transfer a pension of at least £20k and you could earn £200 cashback
- Terms and Fees apply, Capital at risk
- New & Existing customers opening a SIPP
- Offer ends 31st July 2026
Before starting your transfer, check you won't lose any valuable benefits (such as guaranteed annuity rates or a lower protected pension age) and find out what exit fees you might have to pay
