

The concept of diversification should be nothing new to experienced DIY investors. Diversification means not putting all your eggs in one basket. It is about spreading risk across a range of assets that are not correlated to each other (i.e. they don’t move in the same direction) meaning, if markets fall, you shouldn’t see all your investments losing value at the same time or to the same degree. Well, that's the theory although it doesn't always bear out in practice. You can also diversify within each asset class – for example, holding shares in both large and small companies, in companies operating in different sectors like technology or utilities, and in both international and domestic companies.
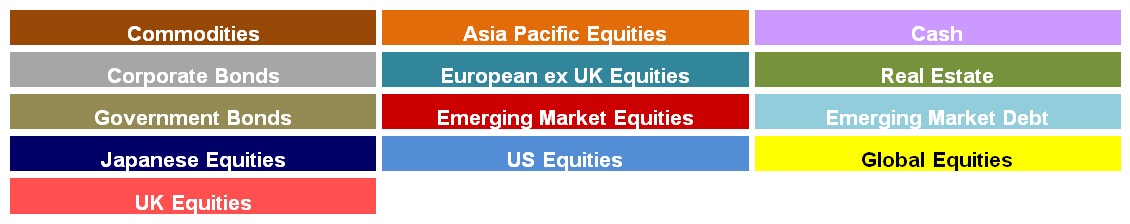
Diversification is an important part of risk management but, from a return perspective, you are also trying to maximise your chances of positive returns over the long term because every asset class will eventually have its day in the sun. The table below produced by Fidelity ranks the investment performance of various asset classes against one another between 2007 to 2016. As you can see (click the image to enlarge) different asset classes outperformed at different times.
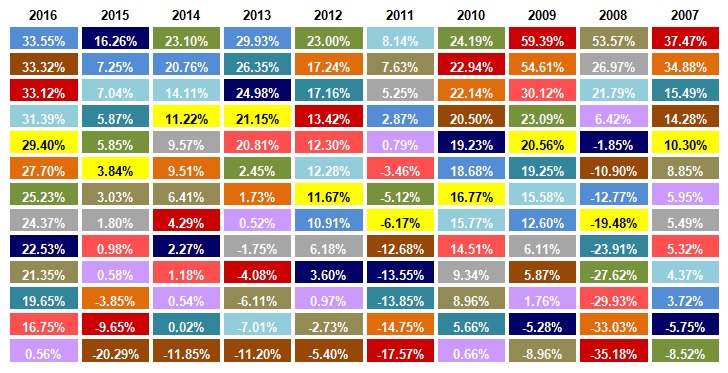
Key:
The question of how you diversify and what assets to hold in what proportions has no definitive answer. Much depends on the level of risk you wish to take as certain assets carry more investment risk than others. If you are risk-averse your portfolio would likely have a higher weighting to cash, bonds and property. Conversely, the more risk-tolerant you are the larger proportion of higher risk assets you would have in your portfolio.
Your initial starting asset allocation may be determined by personal choice. We have previously built an asset allocation calculator which allows you to construct a portfolio based upon your age, risk tolerance and the asset allocation techniques used by Vanguard for their Lifestrategy funds. Personally, the asset allocation for my £50,000 portfolio is influenced by that of the BOTB.
Once you have a starting point for your portfolio's asset allocation you have a decision to make as to whether to stick to your original asset mix or allow nature to takes its course. By letting nature take its course I'm referring to the natural evolution of an unchecked portfolio whereby those funds that perform the best start accounting for a larger proportion of the portfolio. While those funds that perform badly account for a smaller and smaller allocation of the portfolio over time. As the portfolio's asset mix deviates over time from your original asset allocation so too does its risk profile. Therefore you may want to rebalance your portfolio which means selling the profits made on the most successful parts of your portfolio and adding to the underperforming parts.
However what value if any does rebalancing add to your portfolio? Does it actually reduce risk? Can it even improve the performance of your portfolio? How frequently should you rebalance?
I decided to carry out some research into the impacts of rebalancing a portfolio of funds. To do this I decided to build a portfolio using the following asset classes, which are based upon the Investment Association's unit trust sector categories. They are:
- Asia Pacific Excluding Japan
- China/Greater China
- Europe Excluding UK
- Flexible Investment
- Global Emerging Markets
- Global
- Japan
- Mixed Investment 20-60% Shares
- Mixed Investment 40-85% Shares
- North America
- Property
- Sterling Corporate Bond
- Sterling High Yield
- Sterling Strategic Bond
- UK All Companies
- UK Equity Income
- UK Smaller Companies
In order to only asses the asset mix rather than fund performance, I built a portfolio using the sector average for each of the above sectors. To start with I built a portfolio with an equal weighting in each of the above sector categories. That means that 5.88% of the portfolio's assets were invested in each sector at the start. I then recreated what would have happened to the performance of the portfolio over time, while tracking the changes to the underlying asset mix. The furthest point to which I could go back was January 1991 as many of sectors didn't exist prior to this. I repeated the exercise 3 more times assuming:
- the portfolio was rebalanced monthly
- the portfolio was rebalanced quarterly
- the portfolio was rebalanced annually (in January)
I assumed that there were no switching charges at all. The table below shows the total return of each portfolio between 1st January 1991 and 25th June 2018.
| Portfolio | % Total return from Jan 1991 to June 2018 |
| No rebalancing | 982.4 |
| Annual rebalancing | 940.32 |
| Quarterly rebalancing | 908.44 |
| Monthly rebalancing | 886.65 |
Based on more than 27 years of historical performance the table above clearly shows that the more frequently you rebalance the more it hinders the total return of your portfolio over the long term. As an aside by the end of the term the 'no rebalancing' portfolio had more than 26% invested in China and just 1.2% in Strategic Bond funds. Don't forget every sector started with 5.88% in it. It is unsurprising that the difference in performance is so marked.
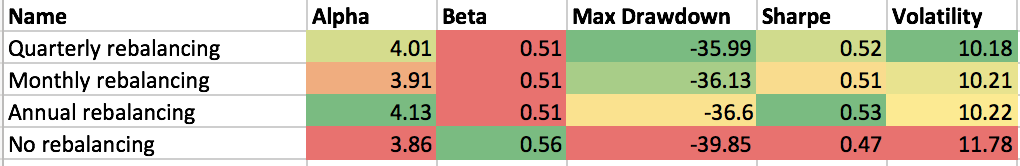
However, how did it impact the risk of the portfolios? The table below (click to enlarge) shows some key statistics for each of the portfolios.
Let me remind you what each of the key statistics means:
Alpha
Alpha is a figure which measures a manager’s apparent skill at picking winning investments versus their benchmark. Alpha is the excess return versus the return of a fund’s benchmark (i.e the market). So a fund with a positive alpha indicates that the fund manager has outperformed through skill. While a negative alpha figure would indicate underperformance.
Beta
Beta measures a fund’s sensitivity to the general market in which it operates. The market always has a beta of 1 by definition. So if a fund (or portfolio) also has a beta of 1 that would mean that if the market rose by 5% then so should the fund. If the fund has a beta of -1 then as the market rises so the fund falls. A well-managed index fund will have a beta of exactly 1. Funds that outperform the market when it does well but do even worse when the market is going down will have a beta above 1. Momentum strategies tend to have a high beta
Sharpe ratio
The sharpe ratio is not a widely known statistic yet it indicates how much extra return a fund manager has achieved for the increased risk they have taken. There is nothing wrong with fund managers taking calculated investment risks if they result in additional returns for investors. So the higher a fund’s sharpe ratio the better.
Maximum Drawdown
The Maximum Drawdown shows the maximum fall during the period for each portfolio.
Volatility
Volatility (standard deviation) – The standard deviation shows how widely a fund’s return varies from its benchmark over a given period. A fund whose annual return hasn’t differed much from its long-term average return will have a low standard deviation and has therefore displayed a lower volatility of returns. If a fund has an average annual return of 10% but a volatility of 15%, this means that the range of returns has varied from -5% to +25%. High volatility obviously could give rise to higher returns but also higher losses. The level of volatility is indicative of the level of investment risk you are taking.
So overall the takeaway is that a non-rebalanced portfolio takes more risk and starts becoming a higher beta strategy, moving towards a momentum strategy which is why it outperforms. However, while rebalancing reduces the downside risks, determining a frequency that is best is marginal. The annual rebalancing strategy has the best risk/return profile as indicated by its Sharpe ratio but the result is too close to call.
I then decided to take this one step further. The reality is that investors don't equally weight their portfolios. Given that rebalancing appears to have an impact on returns (albeit negatively) and risk (reducing it) would the results be more marked if applied to a realistic portfolio where there is an element of conviction in the original selection?
To test this I used the aforementioned investment allocation tool to create an indicative medium risk profile based upon Vanguard's Lifestrategy approach for someone who is 30 years old. The portfolio looks like this:
| Asset | Original % holding |
| North America | 32 |
| Global Bonds | 21 |
| Europe Excluding UK | 9 |
| UK All Companies | 8 |
| UK Smaller Companies | 8 |
| UK Gilts | 7 |
| Global Emerging Markets | 5 |
| Japan | 5 |
| Sterling Corporate Bond | 3 |
| Asia Pacific Excluding Japan | 2 |
As you can see the portfolio has more conviction, with US equities accounting for almost a third of the portfolio's assets.
I re-ran the above analysis, tracking the performance, asset allocation changes over time as well as key risk/reward metrics for five rebalancing strategies. The total return between May 1992 (when the UK Gilt sector was created) to 25th June 2018 is shown in the table below:
| Portfolio | Total return % |
| Strategic portfolio - rebalanced annually | 662.8 |
| Strategic portfolio - no rebalancing | 647.25 |
| Strategic portfolio - 6 monthly rebalancing | 636.33 |
| Strategic portfolio - quarterly rebalancing | 626.82 |
| Strategic portfolio - monthly rebalancing | 616.58 |
Unexpectedly rebalancing annually actually boosted investment returns! Rebalancing more frequently than that reduced investment performance. Indeed the more frequently you rebalanced the greater the drag on investment performance.
So how does it impact the risk/return measure? The table below (click to enlarge) shows the key metrics used earlier for each of the five Strategic portfolios: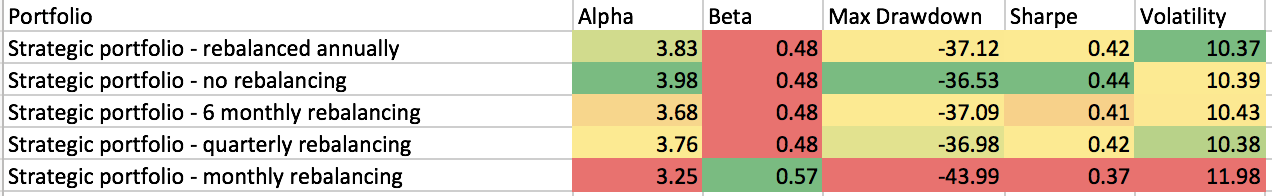
You can see that while the annual rebalancing improved returns it didn't improve the risk/return profile of the portfolio. The 'no rebalancing' portfolio has the lowest max drawdown and highest Sharpe ratio and Alpha figures. This is very interesting because it is not what you might expect. However, the outperformance of the annually rebalanced portfolio can be attributed to how the portfolio performed across the dotcom bubble and subsequent crash. In the crash that followed the dotcom bubble implosion the annually rebalanced portfolio fell 34% in two and half years while the no rebalancing portfolio fell over 41%. However, the latter portfolio has outperformed ever since that time as markets have rallied.
The table below shows the starting portfolio mix in 1992 and final asset mix for the two portfolios. The differences are stark, with the overall equity exposure rising at the expense of bonds. It is, therefore, no wonder that the no rebalancing portfolio outperforms in rising markets but underperforms in falling markets.
| Asset | Original % holding | Annual rebalancing final % holdings | No rebalancing final % holding |
| North America | 32 | 32.9 | 47.6 |
| Global Bonds | 21 | 20.7 | 5.4 |
| Europe Excluding UK | 9 | 8.6 | 13.2 |
| UK All Companies | 8 | 8 | 6.7 |
| UK Smaller Companies | 8 | 8.3 | 14 |
| UK Gilts | 7 | 7.1 | 2.4 |
| Global Emerging Markets | 5 | 4.5 | 4.7 |
| Japan | 5 | 4.9 | 2.9 |
| Sterling Corporate Bond | 3 | 3.1 | 0.9 |
| Asia Pacific Excluding Japan | 2 | 1.9 | 2.9 |
Summary
So pulling this all together there are some fascinating findings:
- Rebalancing regularly (more than yearly) will significantly hit your potential returns
- However, rebalancing does reduce a portfolio's downside risks and improves the risk/return profile
- Rebalancing yearly (rather than more frequently) is the optimum time frame of those tested
- If you have a level of conviction in your original portfolio mix rebalancing annually can improve your returns as risks rise faster in a non-rebalanced Strategic portfolio
- the benefit of rebalancing is likely to be dependent on your original asset mix (the Strategic portfolio didn't contain any China exposure) and how your best conviction plays fared over the term.
Leaving your portfolio to 'go wild' is a form of momentum investing whereby you invest a greater and greater percentage into your winners. It explains why it performs so well compared to the other strategies. If you rebalance too regularly your portfolio is not able to ride any uptrend for long enough to boost returns. However the introduction of annual rebalancing likely acts as a mechanism to take some profits and reduce risk (and therefore the possibility of you losing those profits in the future). Whether rebalancing annually would boost returns in all cases and given any asset mix can't be guaranteed. The research assumes that the annual rebalancing happened in January each year so it would be interesting to expand the research in the future to determine if there was an optimum month to rebalance.
For my own portfolio, I regularly review the portfolio's holdings and try to minimise changes where possible. Over time the asset mix changes and deviates from that of the BOTB. However, this latest research shows that it doesn't pay to obsess over trying to tweak or rebalance the asset mix unnecessarily.

£200 Pension Cashback Offer
Make a qualifying deposit or transfer a pension to our partner Interactive Investor.
- Deposit or transfer a pension of at least £20k and you could earn £200 cashback
- Terms and Fees apply, Capital at risk
- New & Existing customers opening a SIPP
- Offer ends 31st July 2026
Before starting your transfer, check you won't lose any valuable benefits (such as guaranteed annuity rates or a lower protected pension age) and find out what exit fees you might have to pay
