

The Chatterbox section of 80-20 Investor is fast becoming a treasure trove of insights and Q&A's. Normally I always answer any questions posed to me beneath the original question itself within Chatterbox. However, I felt the answer to one question in this month's Chatterbox warranted being turned into a full article for wider circulation. In doing so it will prove a great reference piece that demonstrates how the 80-20 Investor algorithm actually works in practice. Here is the question:
Hi Damien
I have a question which although concerns a specific investment trust, it will help me understand how the 80-20 algorithm works. The trust in question is Value & Income which resides in the UK Equity Income sector. According to FE Trustnet its performance rankings are 2nd over 1 month, 6th over 3 months, 1st over 6 months and 1st over 12 months. Yet it doesn’t appear in the 80-20 tables, could you explain why please?
Why 80-20 Investor doesn't just focus on fund performance
The 80-20 Investor algorithm doesn't just focus on performance, it also takes into account a whole range of other factors including risk. Or to put it another way, the 80-20 Investor algorithm takes into account how those returns are made. The algorithm is designed to not only identify those funds with momentum but also those where the trend is most stable and therefore most likely to persist.
The 80-20 Investor Best Funds by Sector tables you refer to were published on the 16th September 2016. The reason why the Value & Income trust does not feature is that although it is, as you say, one of the top performing funds over the given timeframes it takes far more investment risk than its peers to achieve it. In fact only 3 funds in the sector take more risk. 80-20 Investor looks at this risk/return trade off when compiling the fund shortlists.
It is possible to demonstrate this visually. The chart below shows the performance year to date for the fund you mention (in blue) the fund from the same sector that made the 80-20 investor shortlist (in red) and the sector average (in green). Click on the image to enlarge it.
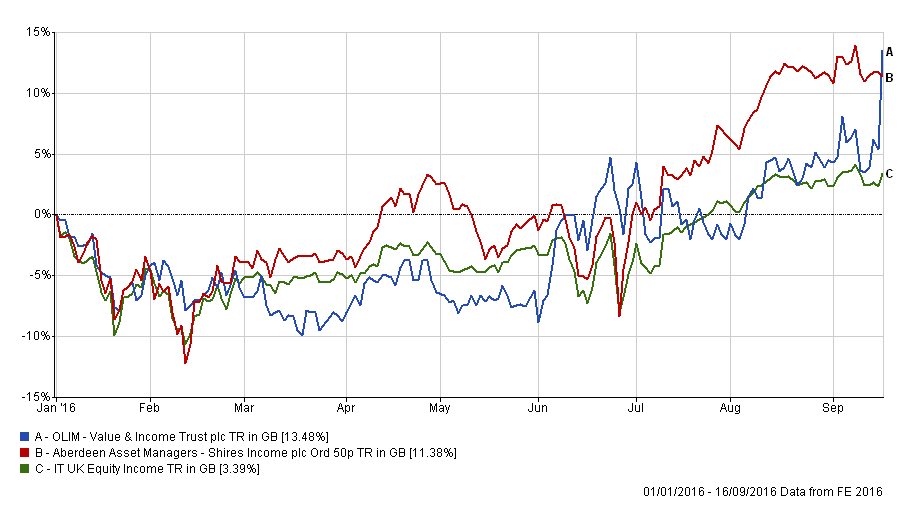
The first thing to note is that as of the 16th September when the 80-20 Investor shortlists were updated the Value and Income trust is the top performer, as you suggest. However, the lion's share of that came in just a few days last week.
If you focus on the right-hand side of the chart (from mid May) you can see, with the exception of the Brexit vote, the red line has been more predictable (less volatile) than the blue line. If we now show what has happened in the few days since the 80-20 Investor tables were updated the story is very different. The Value and Income trust has lost 7% in just one day! While the fund picked by 80-20 Investor rose by nearly 1%.
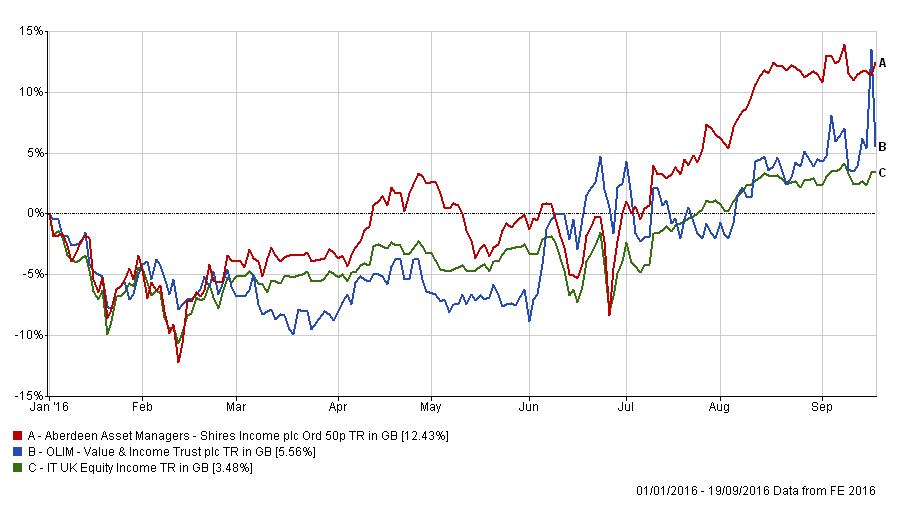
Of course there was no indication that on the 16th September that this was about to happen but it emphasises that the risk being taken by the manager is not being rewarded. Now of course the 80-20 Investor algorithm isn't immune from picking a fund that then falls in value but by not focusing on performance alone, as most advisers and DIY investors do, then you reduce the likelihood of it happening. It's a bit like watching champion surfers. They don't try and surf every wave, they will let many pass by before picking the one that will carry them the furthest. It's a similar scenario with 80-20 Investor.
Interestingly the risk/reward variable within the 80-20 Investor algorithm does mean that you could have bought a fund from one of the 80-20 Investor lists and made a large profit as a result, only for it to be subsequently screened out even though it is still the top performing fund among its peers. This could happen if the risk level vs reward rises substantially. This actually happened to me when investing in Legg Mason Japan Equity a few months ago. I'd made 22% from the fund in just a few months, compared to a return of 1.5% from the average Japanese equity funds, yet I still sold out of it because it was subsequently being screened out by the 80-20 Investor algorithm due to the risk level having risen substantially. The fund that took its regular place in the 80-20 Investor Best Funds by Sector table was AXA Framlington Japan, which I am currently invested in.
Since my switch into the fund in July the AXA Framlington fund has gone sideways (up 0.61%) which although a little disappointing (and under review) is in line with its peers. Yet it still compares favourably with the -2.94% from the Legg Mason Japan Equity over the same time period. Yet the Legg Mason fund remains the top performing Japanese equity fund over 1 year, 3 years, 5 years and 10 years. Which goes to show it's not all about absolute performance figures.
Of course if conditions are right there's nothing to stop either the Legg Mason Japan fund or the Value & Income investment trust rallying strongly. In particular the Legg Mason fund will react strongly to whatever the Bank of Japan do. Inevitably if either fund rallies and the uptrend is strong and reliable then the 80-20 Investor algorithm will pick it up.
Summary
So to sum up, the 80-20 Investor algorithm takes account of a number of factors including performance and how that performance was achieved. It therefore identifies funds with momentum that demonstrate not only an upward trend but a more stable one at that. That is why the Best of the Best Selection regularly features around 50% of the funds from the previous month's shortlist and why only 9% of funds in that shortlist have ever triggered a stop loss alert. If you purely focus on performance you of course will sometimes pick some big winners. Yet often today's biggest winners tend to be tomorrow's biggest losers. The aim of 80-20 Investor is to identify funds that can be held for months at a time which means you need to dig a little deeper than the trustnet performance tables.

£200 Pension Cashback Offer
Make a qualifying deposit or transfer a pension to our partner Interactive Investor.
- Deposit or transfer a pension of at least £20k and you could earn £200 cashback
- Terms and Fees apply, Capital at risk
- New & Existing customers opening a SIPP
- Offer ends 31st July 2026
Before starting your transfer, check you won't lose any valuable benefits (such as guaranteed annuity rates or a lower protected pension age) and find out what exit fees you might have to pay
