

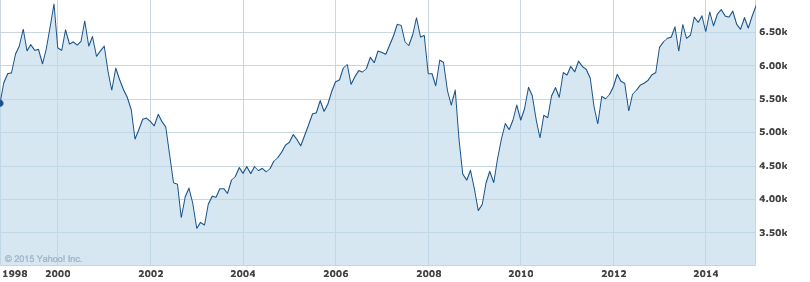
In recent days the FTSE 100 has been hovering around its all-time high of 6,930 which it attained on 31st December 1999. The chart below shows what happened next when the dot com bubble burst (click on all the images in this article to expand them).
Yet it's not just the UK stock market that has been testing multi-year highs. The Japanese stock market (Nikkei 225) has just hit a 15 year high while the US S&P 500 has set yet another all-time high above 2,100. But even in Europe there are similar headlines. The German stock market (the DAX) has also hit an all-time high this month.
While market timing is an almost impossible task, successful investors buy low and sell high. So with stock markets at such highs where are they headed next?
Where are stock markets headed next?
Trying to predict the future of the stock market is akin to reading tea leaves. Personal predictions are almost always clouded by prejudices which reaffirm what we 'want' to happen rather than what is 'most likely' to happen.
That is why one objective method is to use technical analysis to try and judge likely outcomes. So what is technical analysis? One line of thinking is that stock markets are driven largely by human behaviour. At the simplest level you could argue that fear and greed drive a lot of investors' actions. Let's say that an opportunity presents itself and some investors jump on it and buy the shares in question. The demand then drives up the price. More investors jump on the bandwagon looking to profit. Then at some point the tide turns (fear sets in) as people think the price for the shares is looking expensive and so people start selling. More and more people start selling to take profits and the price falls. At some point the price falls until others think the shares look cheap and start buying, outnumbering the number of sellers. Again demand outstrips supply and the price goes back up.
This see-sawing explains the movement you see in the stock market charts such as the one above. The prices at which investors start bailing and selling the shares is called a point of resistance while the point at which they pile in is called a point of support.
As such there is a surprising level of predictability to human behaviour. In terms of the stock market that means when the price goes through historic points of resistance or support it can indicate an new unfolding market rally or collapse. Why does it do this? Part of it will be because traders trading in millions of pounds will use these points of resistance and support to trigger trades. Yet for a lot of investors they might not even be aware of these inflexion points. They simply are reacting to how other people in the market behave. Put it this way, when stock markets fall you feel tempted to sell, right? Also once it starts to rally, you are tempted to jump in? That's why these patterns have a tendency to repeat.
Some investors and traders swear by it and trade solely using technical analysis. I don't fall into that camp. I view technical analysis like a road map drawn by someone who has already completed a journey to somewhere near where you are planning to drive to. The road map won't take you exactly to your intended destination, nor will it be entirely accurate. However, it will give you a better sense of what to expect. Then if you decide you like the look of particular market you can use 80-20 Investor's 'Best of the Rest' data to choose an actual fund to invest in. So where are 3 key stock markets now heading?
There are different types of technical analysis and over time I will introduce some to you. However, you don't want to get bogged down into them. I find the most useful guide is to simply highlight the points of resistance and support.
FTSE to 7,000?
Click on the image to enlarge it. The first thing is to say that I have slightly rounded some of these numbers. The red lines are lines of support while the green is a line of resistance. However, lines of support also can work as lines of resistance once breached and vice versa (as can be seen by the diagonal red line).
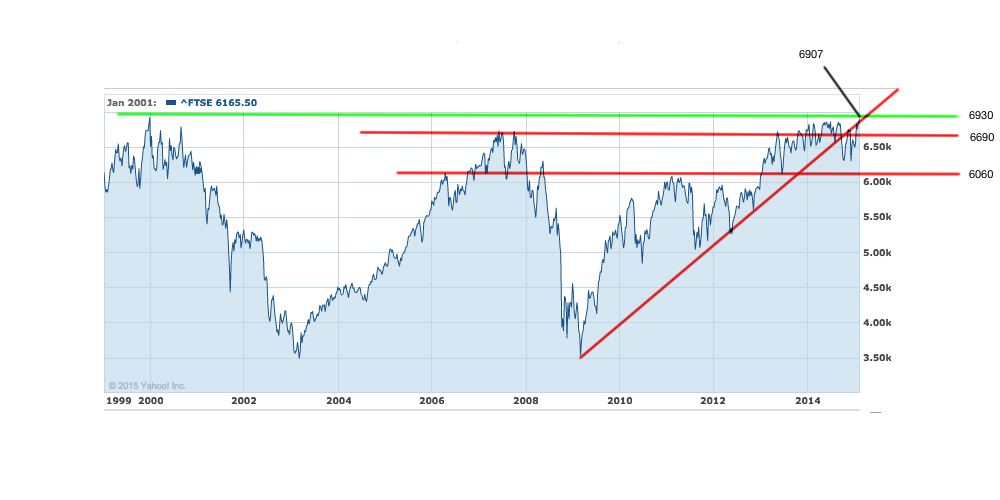
So what do all these lines mean? At the moment the previous high of December 1999 is acting as a point of resistance. The market keeps testing it and then sells off when it gets near. At the moment recent highs of around 6,690 are providing a support level, although it has been breached and found support slightly lower. In a sense the FTSE 100 is at a crossroad moment with almost a binary choice of setting new highs or selling off. If the FTSE 100 can break 6,930 the diagonal line of support could suggest that we'll hit 7,000 pretty quickly.
But the market is still susceptible to a sell-off. Imagine if things turn sour with Greece or the conflict in Ukraine escalates then you can see the potential for a pretty large sell off heading towards 6,000 with stops along the way. So the breaching of the all-time high is crucial to see which outcome we will get. The thing with technical analysis is that different people can draw different lines of support or resistance and in reality no one is going to be spot on. What I would take away is that we are going to need a good push upwards to make any serious gains (7,000 is only 1.5% above where the FTSE 100 is at the time of writing). Otherwise at best we could carry on in this sideways markets for a while.
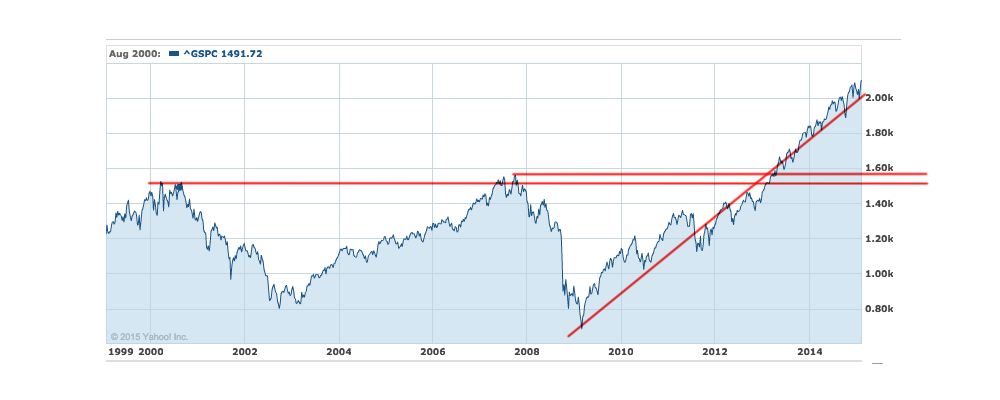
US S&P 500 - where next?
The US stock market chart looks completely different. There are some headwinds facing the US stock market, for example there's evidence that the strong dollar is starting to impact the profit margins of US multi-nationals. Also, in much of 2014 the rally was driven by investors buying shares of companies within defensive sectors (such as drug companies) and not companies most sensitive to the economic outlook (such as retailers). If a rally is going to continue then investors need to start backing the idea that the US economy is in escape velocity with their money (and not just say they believe it). Yet looking at the chart below, a technical investor would certainly still be feeling bullish and buying US equities as they bounce upwards along the diagonal line of support.
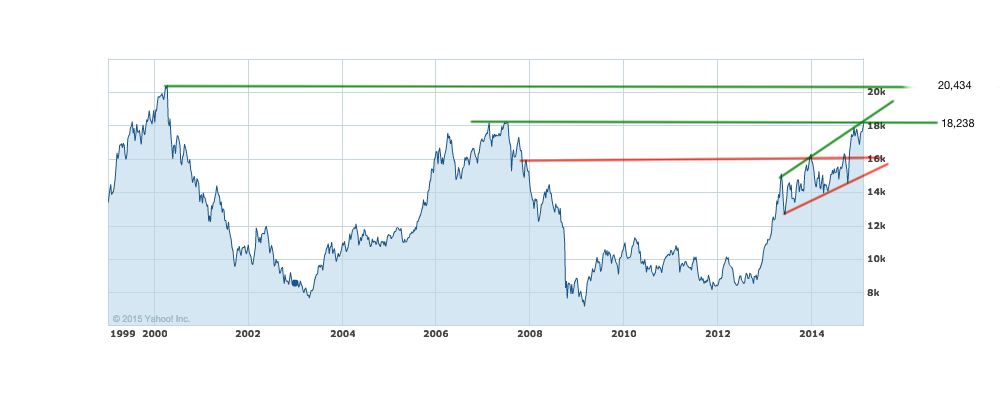
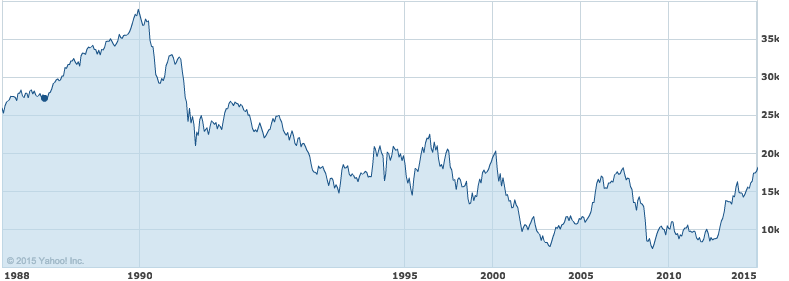
Nikkei 225 - what next?
The Japanese stock market has spent decades in the doldrums as the economy was ravaged by deflation. Yet the stock market has seen a stellar rally driven by enormous amounts of money printing. Those who bought Japanese equities just as the Bank of Japan embarked on printing Yen back in 2012 would have doubled their money, assuming they had hedged out exposure to the Yen - which is always advisable (Neptune Japan Opportunities is a good example of a fund that does).
The material in any email, the MonetotheMasses.com website, associated pages / channels / accounts and any other correspondence are for general information only and do not constitute investment, tax, legal or other form of advice. You should not rely on this information to make (or refrain from making) any decisions. Always obtain independent, professional advice for your own particular situation. See full Terms & Conditions and Privacy Policy
Neither MoneytotheMasses.com/80-20 Investor nor its content providers are responsible for any damages or losses arising from any use of this information. Past performance is no guarantee of future results.
Funds invest in shares, bonds, and other financial instruments and are by their nature speculative and can be volatile. You should never invest more than you can safely afford to lose. The value of your investment can go down as well as up so you may get back less than you originally invested.
Information provided by MoneytotheMasses.com/80-20 Investor is for general information only and not intended to be relied upon by readers in making (or not making) specific investment decisions.
Appropriate independent advice should be obtained before making any such decisions. Leadenhall Learning (owner of MoneytotheMasses.com/80-20 Investor) and its staff do not accept liability for any loss suffered by readers as a result of any such decisions.
The tables and graphs are derived from data supplied by Trustnet. All rights Reserved.

£200 Pension Cashback Offer
Make a qualifying deposit or transfer a pension to our partner Interactive Investor.
- Deposit or transfer a pension of at least £20k and you could earn £200 cashback
- Terms and Fees apply, Capital at risk
- New & Existing customers opening a SIPP
- Offer ends 31st July 2026
Before starting your transfer, check you won't lose any valuable benefits (such as guaranteed annuity rates or a lower protected pension age) and find out what exit fees you might have to pay
