

A new 80-20 Investor recently wrote to me to ask whether now was a good time to invest or whether they should wait for a market dip before committing any money. The backdrop to this question are the high valuations we are seeing in equity markets right now. In last week's weekly newsletter I explained how all three main equity indices in the US simultaneously hit all-time highs, something that hadn't happened since the infamous dotcom bubble of 1999. Often what goes up must come down so it's wise to celebrate such milestones cautiously. So are markets about to tumble or continue higher? Is there still scope for more upside before a correction materialises. Of course I don't have a crystal ball but in this article I hope to shed some light.
As you well know I regularly advise investors to not try and time the market because they will never get it right. In the worst case scenario they will lose money which they will struggle to recoup. However, there's nothing wrong with trying to determine a range of possible future outcomes within investment markets. Think of it in terms of the recent Olympic sailing events. Weather conditions have a huge impact on how the race will unfold. Certain conditions favour certain competitors while other conditions can mean that the race will be postponed. Knowing the weather forecast in advance doesn't make the race a formality. Far from it in fact but it does give you an insight into the most likely winners. In the investing world the closest and most reliable thing we have to a weather forecast is technical analysis.
What is technical analysis?
For those who don't already know or have forgotten here is an explanation of what technical analysis is:
Trying to predict the future of the stock market is akin to reading tea leaves. Personal predictions are almost always clouded by prejudices which reaffirm what we ‘want’ to happen rather than what is ‘most likely’ to happen.
That is why one objective method is to use technical analysis to try and judge likely outcomes. So what is technical analysis? One line of thinking is that stock markets are driven largely by human behaviour. At the simplest level you could argue that fear and greed drive a lot of investors’ actions. Let’s say that an opportunity presents itself and some investors jump on it and buy the shares in question. The demand then drives up the price. More investors jump on the bandwagon looking to profit. Then at some point the tide turns (fear sets in) as people think the price for the shares is looking expensive and so people start selling. More and more people start selling to take profits and the price falls. At some point the price falls until others think the shares look cheap and start buying, outnumbering the number of sellers. Again demand outstrips supply and the price goes back up.
This see-sawing explains the movement you see in stock market charts such as those below. The prices at which investors start bailing and selling the shares is called a point of resistance while the point at which they pile in is called a point of support.
As such there is a surprising level of predictability to human behaviour. In terms of the stock market that means when the price goes through historic points of resistance or support it can indicate a new unfolding market rally or collapse. Why does it do this? Part of it will be because traders trading in millions of pounds will use these points of resistance and support to trigger trades. Yet for a lot of investors they might not even be aware of these inflexion points. They simply are reacting to how other people in the market behave. Put it this way, when stock markets fall you feel tempted to sell, right? Also once it starts to rally, you are tempted to jump in? That’s why these patterns have a tendency to repeat.
Some investors and traders swear by it and trade solely using technical analysis. I don’t fall into that camp. I view technical analysis like a road map drawn by someone who has already completed a journey to somewhere near where you are planning to drive to. The road map won’t take you exactly to your intended destination, nor will it be entirely accurate. However, it will give you a better sense of what to expect. Then if you decide you like the look of particular market you can use 80-20 Investor’s ‘Best funds by Sector‘ data to choose an actual fund to invest in.
How reliable is technical analysis?
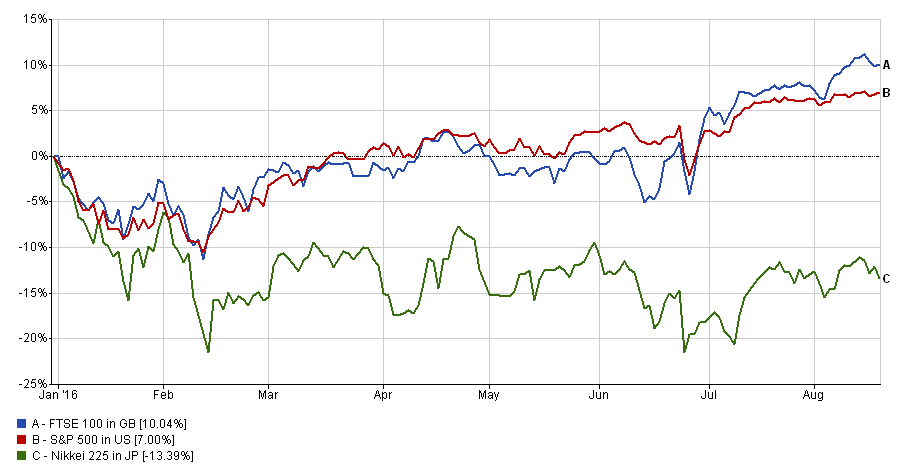
Perhaps the best demonstration of how useful technical is is to go back and review, with the benefit of hindsight, the technical analysis I carried out back in February. I'm pretty chuffed as at the time I suggested we were near the bottom of the market sell-off, which it turns out we were. It's about as close as you are ever likely to get to calling the bottom of a market sell-off. Yet I was wide of the mark with the outlook for US equities which have since hit all-time highs! To give it some context the chart below (click to enlarge) shows how the US, FTSE and Nikkei have performed since the start of the year. The article was written at the bottom of the sell-off in February.
Latest technical analysis
There are different types of technical analysis, however, I find the most useful guide is to simply highlight the points of resistance and support, as I've done previously. So below I provide technical analysis, looking at areas of support and resistance, on the key global equity markets.
UK stock market
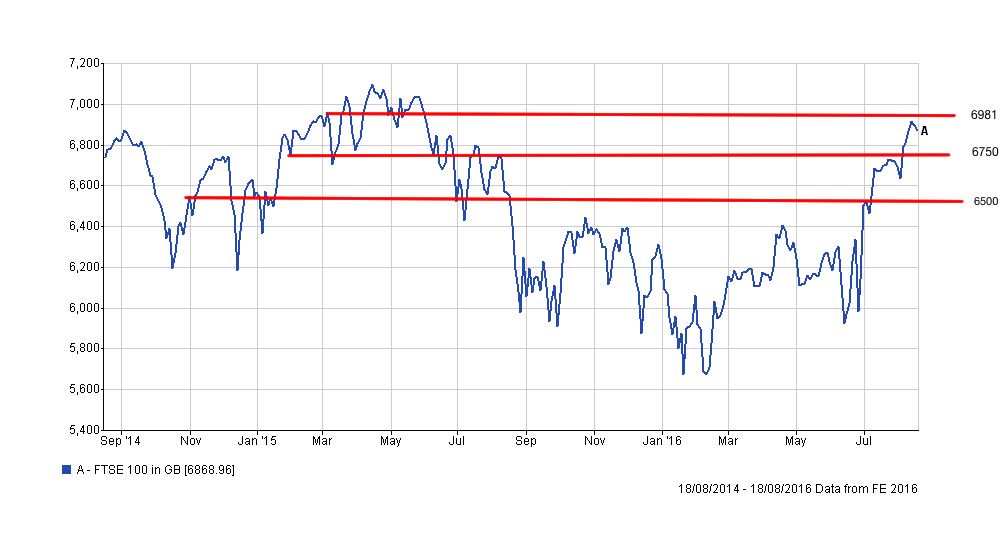
The FTSE 100 has had one hell of a rally since the EU referendum. It's been driven by the weak pound which has been a boost to exporters and those companies with overseas earnings, which account for around 70% of the index. The index rallied more than 14% hitting a post Brexit vote high of 6,941 before pulling back to below 6,900.
Interestingly this month the FTSE 100 index is in a similar position to that just after it hit its peak last year, with the index bouncing around a narrow band above 6,800. The 6,800 level remains a key support level to keep an eye on. If the market breaks down through that then there's more support around 6,750 and then a number of support lines all the way down to 6,600. In the short term the 6,500 looks like a likely floor to the current rally. The support and resistance lines are shown in red in the chart above (click to enlarge)
On the upside there's s resistance level around 6,910 where it recently peaked and then again just below the 7,000 point mark. If the index can consistently close above 6,910 there's a definite chance that it can push up through the 7,000 barrier especially if the Bank of England keeps pushing with its Quantitative Easing (QE) programmes. However, with so much focus on this milestone I think it could end up being a tougher nut to crack than it seems on paper, even though it's only 2% above where we are now. The strength/weakness of the pound will continue to be a determining factor on where this market heads next. Continued weakness will provide further fuel to the market, but a stronger pound will likely dampen the mood.
US stock market
In the US the S&P 500 has been setting new all-time highs and there's a feeling that perhaps the market could do with a breather. You can see from the chart below that the S&P 500 has enjoyed a similar rally to the UK stock market propelling it through the key 2,100 level. Beyond that the market is in fresh air so don't be surprised if it takes a breather and bumbles along in a narrow channel much as it has done for the past 18 months or so. Over the near term keep an eye on the 2,100 level on the downside and then 1990 if there is a serious market sell off (both marked as horizontal red lines in the chart below). The latter is 9% below where we are now currently so just inside the official definition of a correction (i.e. 10% or more). On the upside there is resistance around the 2,190 level which is just above where we currently are (which is 2,183). The next target is 2,200 if the market is to drive higher. We need the market to close consistently above 2,200 for the rally to not run out of steam and head back to 2,100.

Japanese stock market
The Japanese stock market is still struggling with the strength of the yen, especially after the Bank of Japan (BOJ) disappointed markets with its stimulus package. Don't forget that the yen is seen as a haven asset and is bought en masse whenever investors become nervous. Due to the export focus of the Japanese economy a strong yen is bad news for Japanese stocks. So the stock market and the yen tend to move in opposite directions - what's good for the currency is bad for the stock market.
Updating the chart of the Nikkei 225 you can see that it's been a dismal year for the index, down almost 20% from a year ago. How much downside is there left? You can see from the chart that 16,000 is a key support level. Currently we are at 16,585 so 16,000 represents a 3.5% fall. If we go through 16,000 then 14,000 looks like the bottom of where we could end up. On the upside if we can get through 17,000 we'd finally break the black downtrend lines and there is a great deal of upside potential. What might spark this? Well the strong yen could force the BOJ's hand meaning more QE.

Summary
Stock markets have rallied fast and hard in the last 2 months especially with currency moves being drivers in the UK and Japan. The rallies in the UK and the US certainly look like they will take a breather, perhaps falling back to support levels below current levels while the market tries to find a new sense of direction. Future central bank action will decide whether the rally regains momentum or we have a correction. The risks are asymmetric, with more downside potential than upside but there will initially be a lot of support if we do get a more significant pullback. Japan's equity market is perhaps the most interesting with the most upside potential if the BOJ takes action, although that is a big 'if'.

£200 Pension Cashback Offer
Make a qualifying deposit or transfer a pension to our partner Interactive Investor.
- Deposit or transfer a pension of at least £20k and you could earn £200 cashback
- Terms and Fees apply, Capital at risk
- New & Existing customers opening a SIPP
- Offer ends 31st July 2026
Before starting your transfer, check you won't lose any valuable benefits (such as guaranteed annuity rates or a lower protected pension age) and find out what exit fees you might have to pay
