

Since my last technical analysis piece three months ago a lot has happened in stock markets. So as we enter the notoriously weak summer months I thought it an opportune time to review where we are and where markets are likely to head next.
As ever with these pieces I like to recap what technical analysis is and how it works. I always advise investors not to try and time the market because they will never get it right. However, there's nothing wrong with trying to determine a range of possible future outcomes within investment markets. Think of it like a weather forecast. It’s not 100% accurate but it will give you a better idea of whether a storm is on the horizon. Technical analysis is the nearest thing we have to weather forecasting in the investment world.
What is technical analysis? - A recap
For those who don't already know or have forgotten here is an explanation of what technical analysis is:
Trying to predict the future of the stock market is akin to reading tea leaves. Personal predictions are almost always clouded by prejudices which reaffirm what we ‘want’ to happen rather than what is ‘most likely’ to happen.
That is why one objective method is to use technical analysis to try and judge likely outcomes. So what is technical analysis? One line of thinking is that stock markets are driven largely by human behaviour. At the simplest level you could argue that fear and greed drive a lot of investors’ actions. Let’s say that an opportunity presents itself and some investors jump on it and buy the shares in question. The demand then drives up the price. More investors jump on the bandwagon looking to profit. Then at some point the tide turns (fear sets in) as people think the price for the shares is looking expensive and so people start selling. More and more people start selling to take profits and the price falls. At some point the price falls until others think the shares look cheap and start buying, outnumbering the number of sellers. Again demand outstrips supply and the price goes back up.
This see-sawing explains the movement you see in stock market charts such as those below. The prices at which investors start bailing and selling the shares is called a point of resistance while the point at which they pile in is called a point of support.
As such there is a surprising level of predictability to human behaviour. In terms of the stock market that means when the price goes through historic points of resistance or support it can indicate a new unfolding market rally or collapse. Why does it do this? Part of it will be because traders trading in millions of pounds will use these points of resistance and support to trigger trades. Yet for a lot of investors they might not even be aware of these inflexion points. They simply are reacting to how other people in the market behave. Put it this way, when stock markets fall you feel tempted to sell, right? Also once it starts to rally, you are tempted to jump in? That’s why these patterns have a tendency to repeat.
Some investors and traders swear by it and trade solely using technical analysis. I don’t fall into that camp. I view technical analysis like a road map drawn by someone who has already completed a journey to somewhere near where you are planning to drive to. The road map won’t take you exactly to your intended destination, nor will it be entirely accurate. However, it will give you a better sense of what to expect. Then if you decide you like the look of a particular market you can use 80-20 Investor’s ‘Best funds by Sector‘ data to choose an actual fund to invest in.
Latest technical analysis
There are different types of technical analysis, however, I find the most useful guide is to simply highlight the points of resistance and support, as I've done previously. So below I provide technical analysis, looking at areas of support (the green lines in the charts below) and resistance (the red lines), on the key global equity markets and the pound/dollar exchange rate. Click on the charts to enlarge them.
US stock market
The US stock market was at the centre of the market weakness which started in February thanks to a mix of rising volatility, rising bond yields and later a technology stock sell-off. The S&P 500 suffered a technical correction which means that at the end of a given trading day the closing value was more than 10% below its recent high point. However, despite other global stock markets recovering and surpassing their all-time record highs (most notably in US small caps and the FTSE 100) the S&P 500 still remains more than 5% below its own record high of 2,872 set in January.
As you can see from the chart below the S&P 500 entered into a period of consolidation after bouncing along the support level of 2,580. The consolidation period was ultimately constrained by a wedge-shaped triangle (formed from the downward sloping red line and the upward sloping green line) and it squeezed the daily trading ranges. It was critical which way we broke out of the wedge and fortunately it was to the upside. The market has struggled to push higher but has found support at the key 2,682 level (which if you look back at my previous technical analysis pieces is a recurring support/resistance line). It also coincides (labelled A) with the recent upward sloping trend from April's low.
The market has yet to fully recover from February's correction but it is trying to hang on to the uptrend in US equities and investors are appearing to be tentatively buying dips again. The S&P 500 is currently at around 2,720 at the time of writing, where it has been struggling to gain a foothold to push higher. If it can break above 2,780 we can then turn our attention to 2,800 or potentially 2,900 and new all-time highs.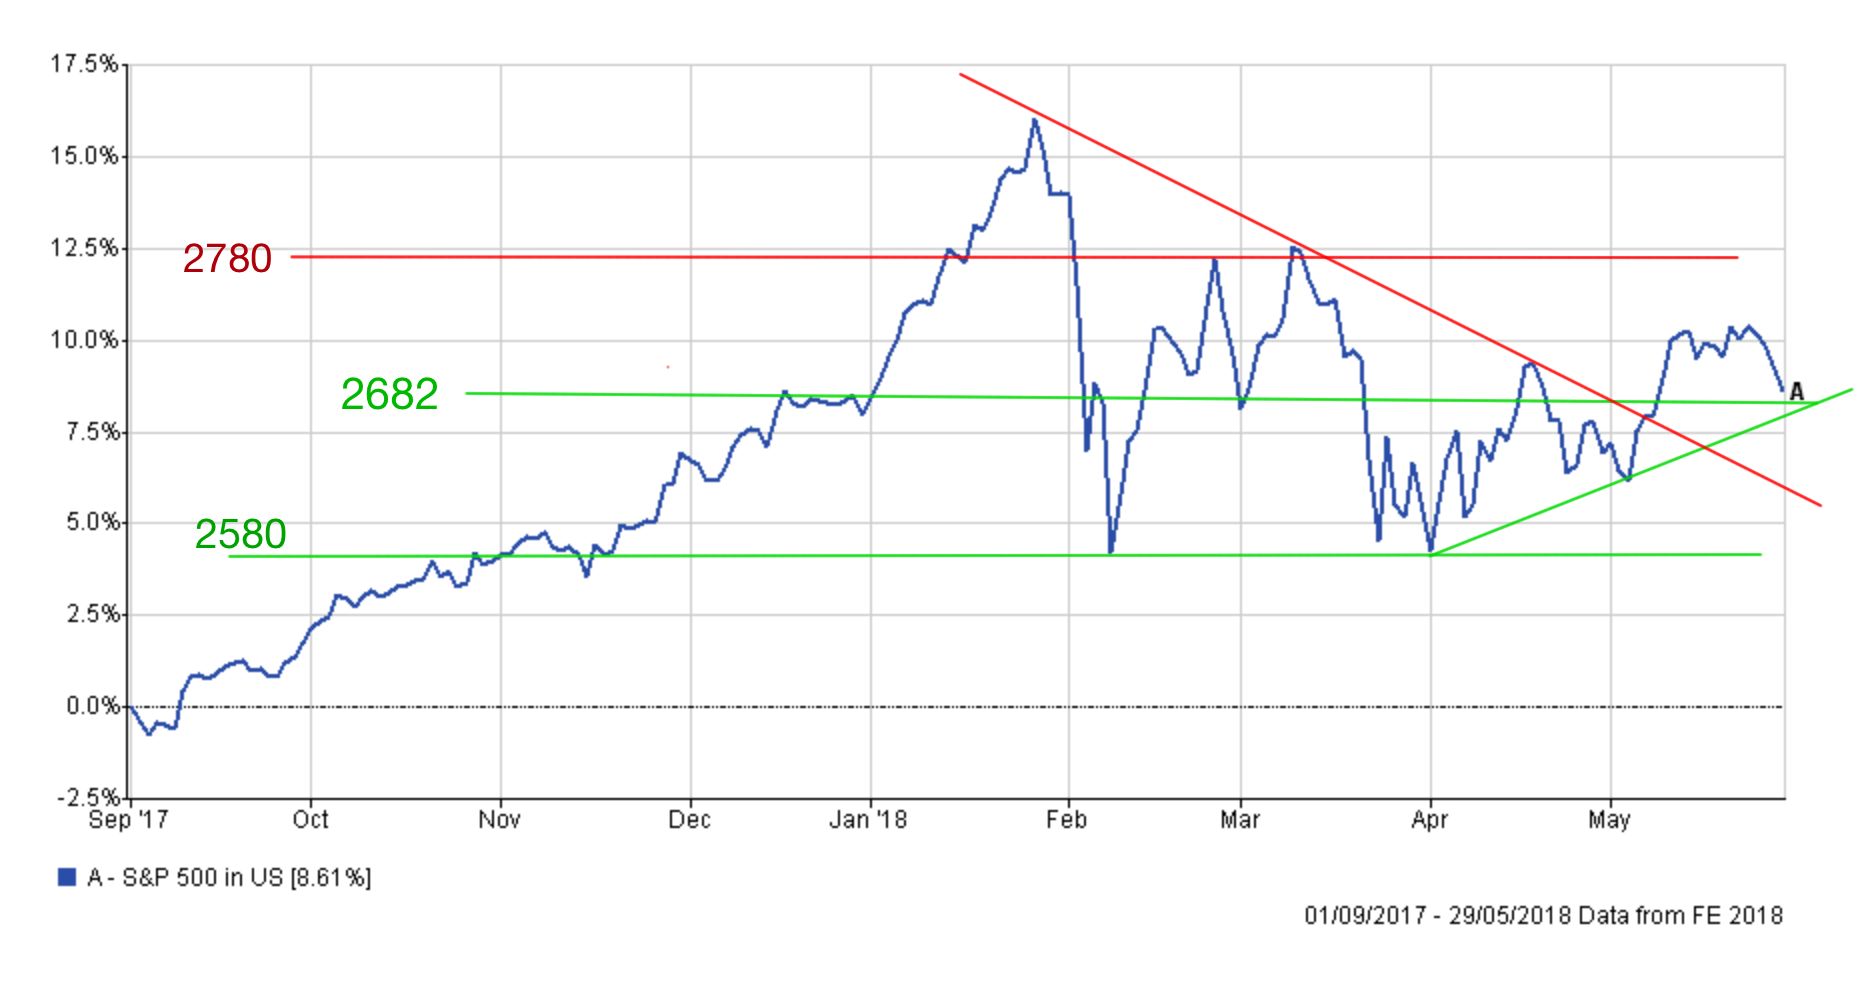
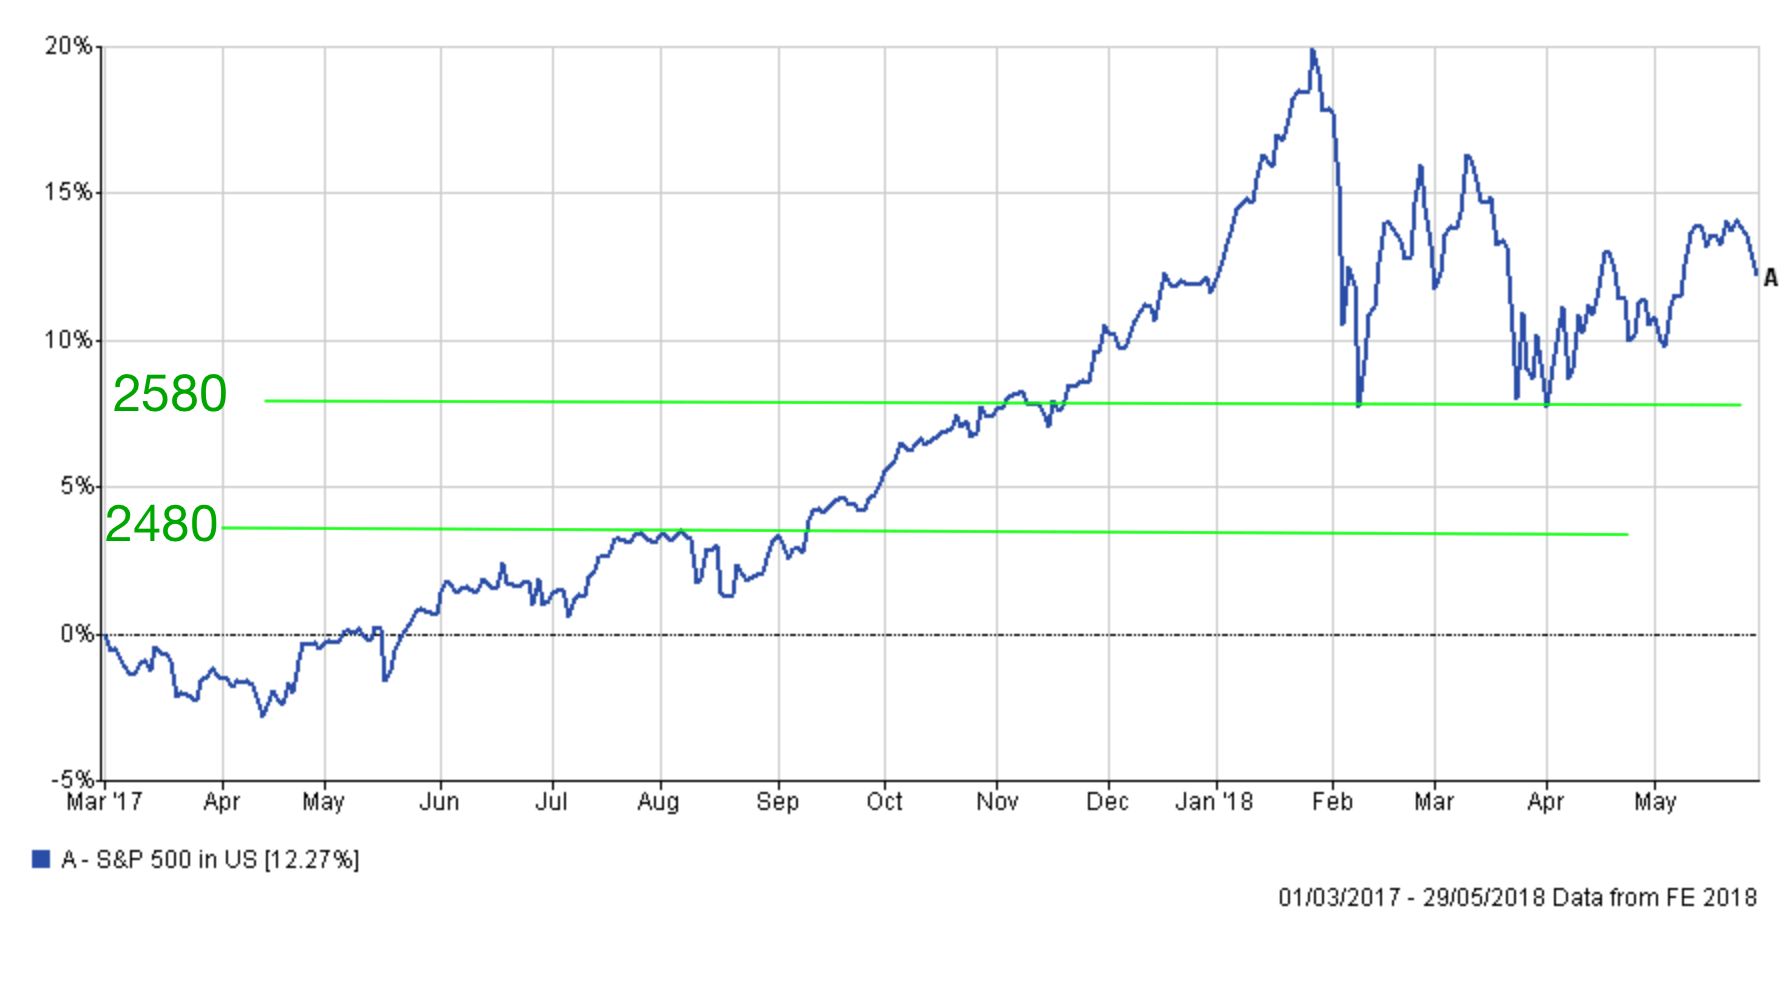
On the downside, if we break lower then 2,580 becomes important again. If we break below there then the uptrend in US equities will be broken and there is not much support until we hit 2,500 and 2,480, as shown in the chart below. That level is 9% below where we are now and we'd be seriously facing the prospect of US equities falling into a bear market. But for now the market is consolidating and ultimately remains in an uptrend
UK stock market
While the FTSE 100 may have been a bit of laggard going into 2018 it did eventually hit a new all-time high in January. The FTSE 100 avoided a technical correction in February (unlike the S&P 500) but did eventually enter correction territory at the end of March after the pound strengthened to near $1.43, a post Brexit high. The FTSE 100 was in a downward trend as shown by the red sloping line below, breaching the psychologically important 7,000 level and heading down through 6,900. However, a dramatic collapse in the value of the pound sent the FTSE 100 bouncing from 6,888 straight towards a new all-time high of 7,877. Clearly, that uptrend was not sustainable and we've seen the FTSE 100 pull back to 7,689 at the time of writing. However, it remains in an uptrend and if the pound continues to weaken (see later section on the outlook for the pound) it could push the FTSE 100 back to new highs with 8,000 the medium-term target. However, 7,900 is likely to prove a resistance hurdle and some quarters question whether a break higher can be sustained without the pound continuing to weaken and the price of oil continuing to rally.
Looking lower, 7,500 is a significant support level which marks the floor of the uptrend. When the market has broken below 7,500 it has tended to be a negative sign with the market quickly heading towards 7,250. Below there we are then looking at 7,200 and 7,093 and ultimately 7,000 for support.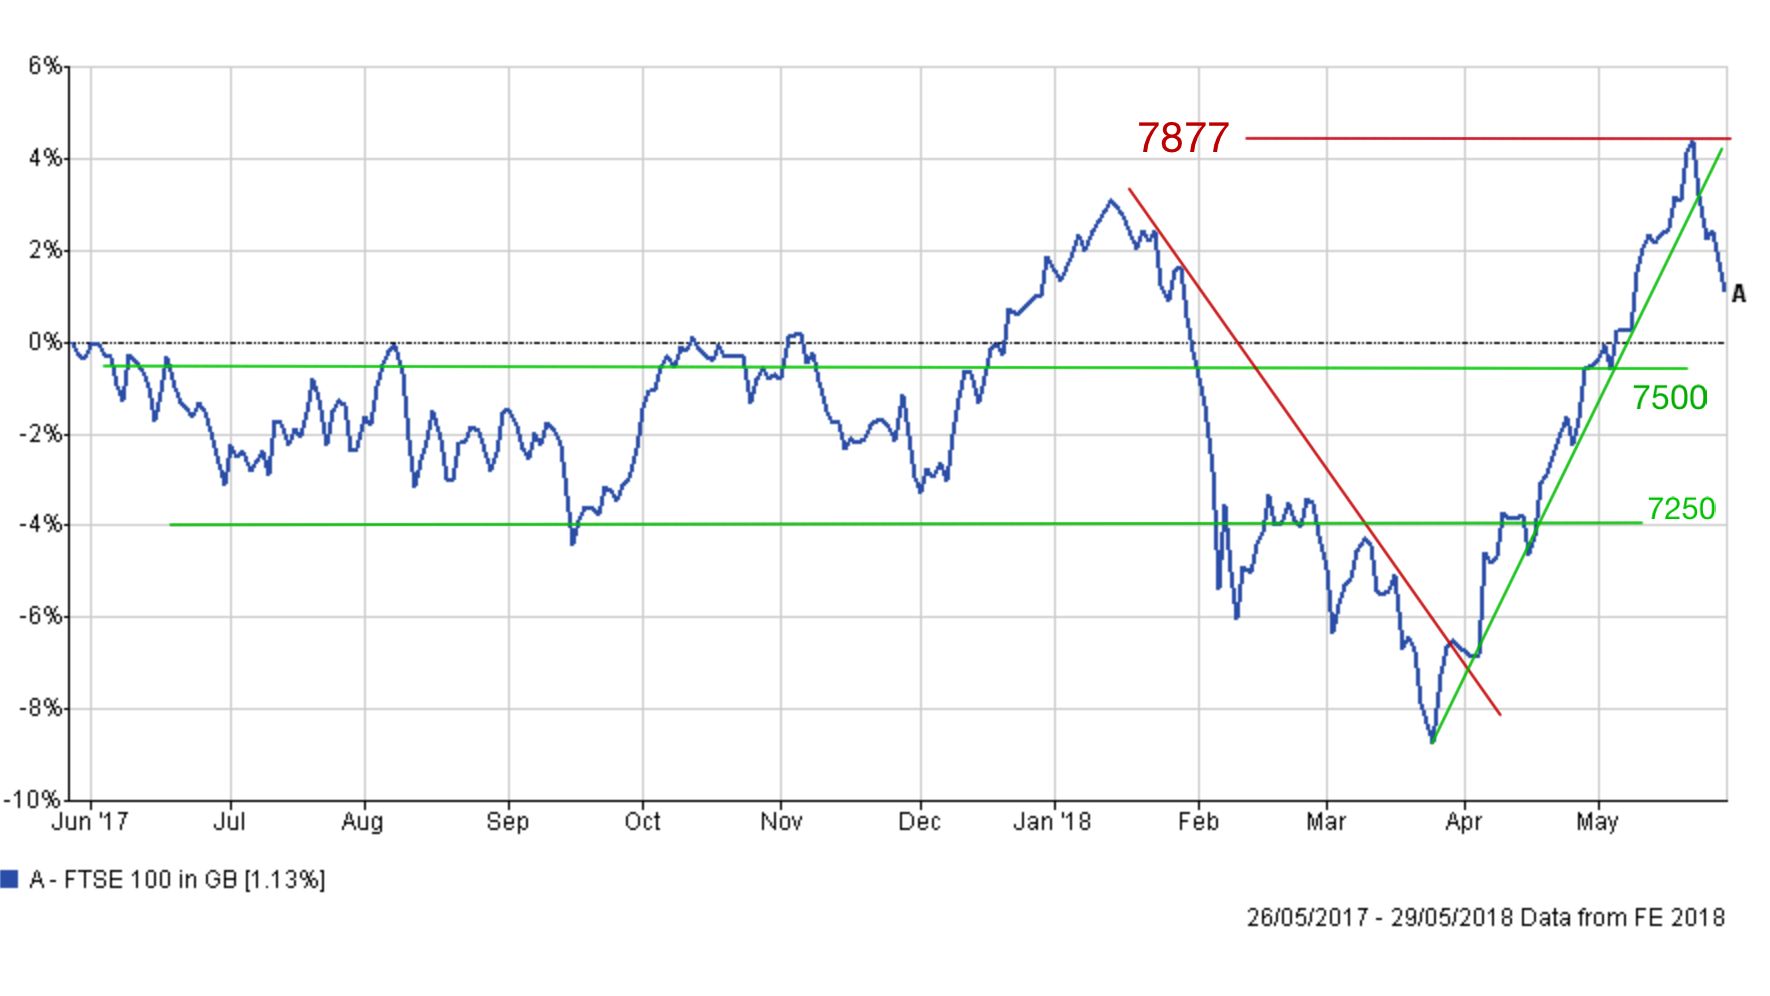
Japanese stock market
Japanese equities have been buffeted by Trump's protectionist policies and the rising yen (the result of bouts of investor risk aversion). The rising yen, in particular, has hampered the performance of the Japanese stock market (a strong yen is bad for exporters) but UK investors have been spared by the boost to their overseas assets provided by the tumbling pound.
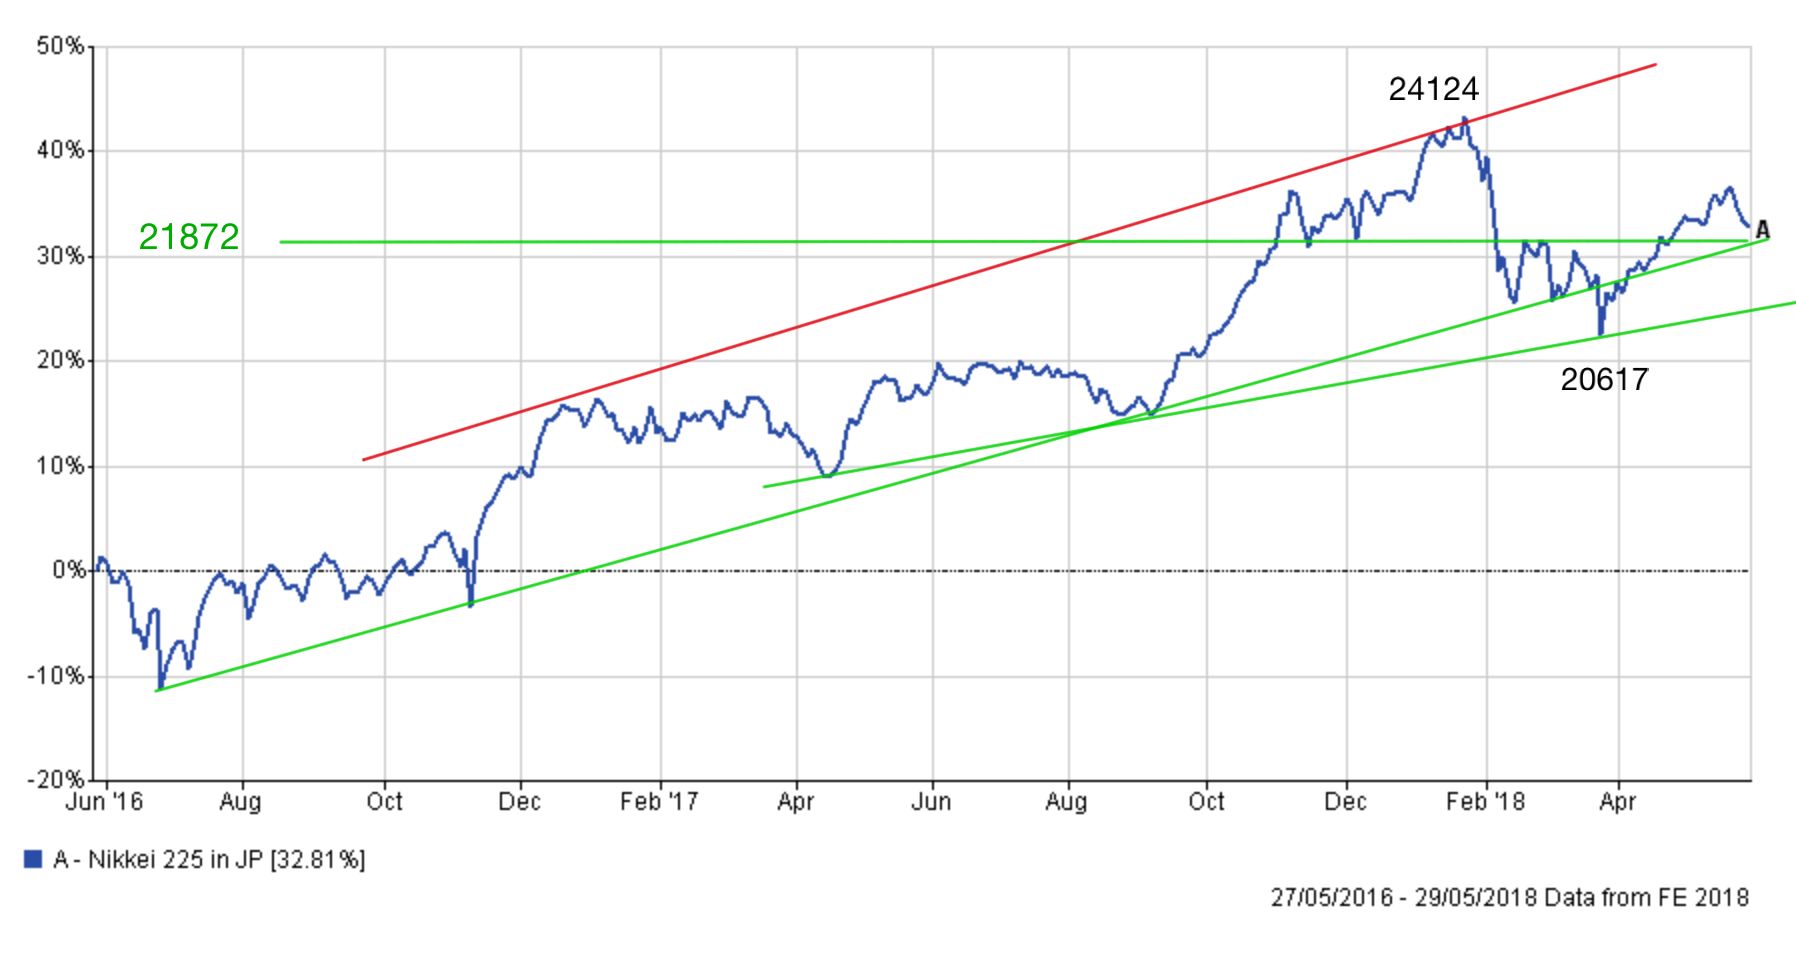
The uptrend in the Nikkei 225 that could be traced back to June 2016 was eventually broken in the sell-off in March and threatened to drag the Nikkei back down towards 20,000 (which is the level it struggled to break above between June and September 2017 in the chart below).
However, the market found support at 20,617 which formed a shallow support line stemming from April 2017. The Nikkei eventually bounced back into the uptrend channel between the red resistance line and the support line from June 2016 which is a bullish sign. But recent weakness means that it is now retesting the critical support level of 21,872 where the two support lines meet (marked with the letter A). If we break below that then the uptrend in Japanese stocks isn't automatically over but it is weakened. So far the retreat has been contained and while the medium to long-term trend remains upwards the short term trend is less certain and the next move is key.
The uptrend floor is likely to be around 20,900 which is 5% below where the Nikkei currently is (22,018). So we want to see the market stay above that. Much depends on the strength of the yen as to where we go next. If we do eventually break above January's high point then the ceiling shown by the red resistance line is around 25,100, but we need to remain above 21,872 and 22,000 to stand any chance of a rally higher.
Pound vs Dollar
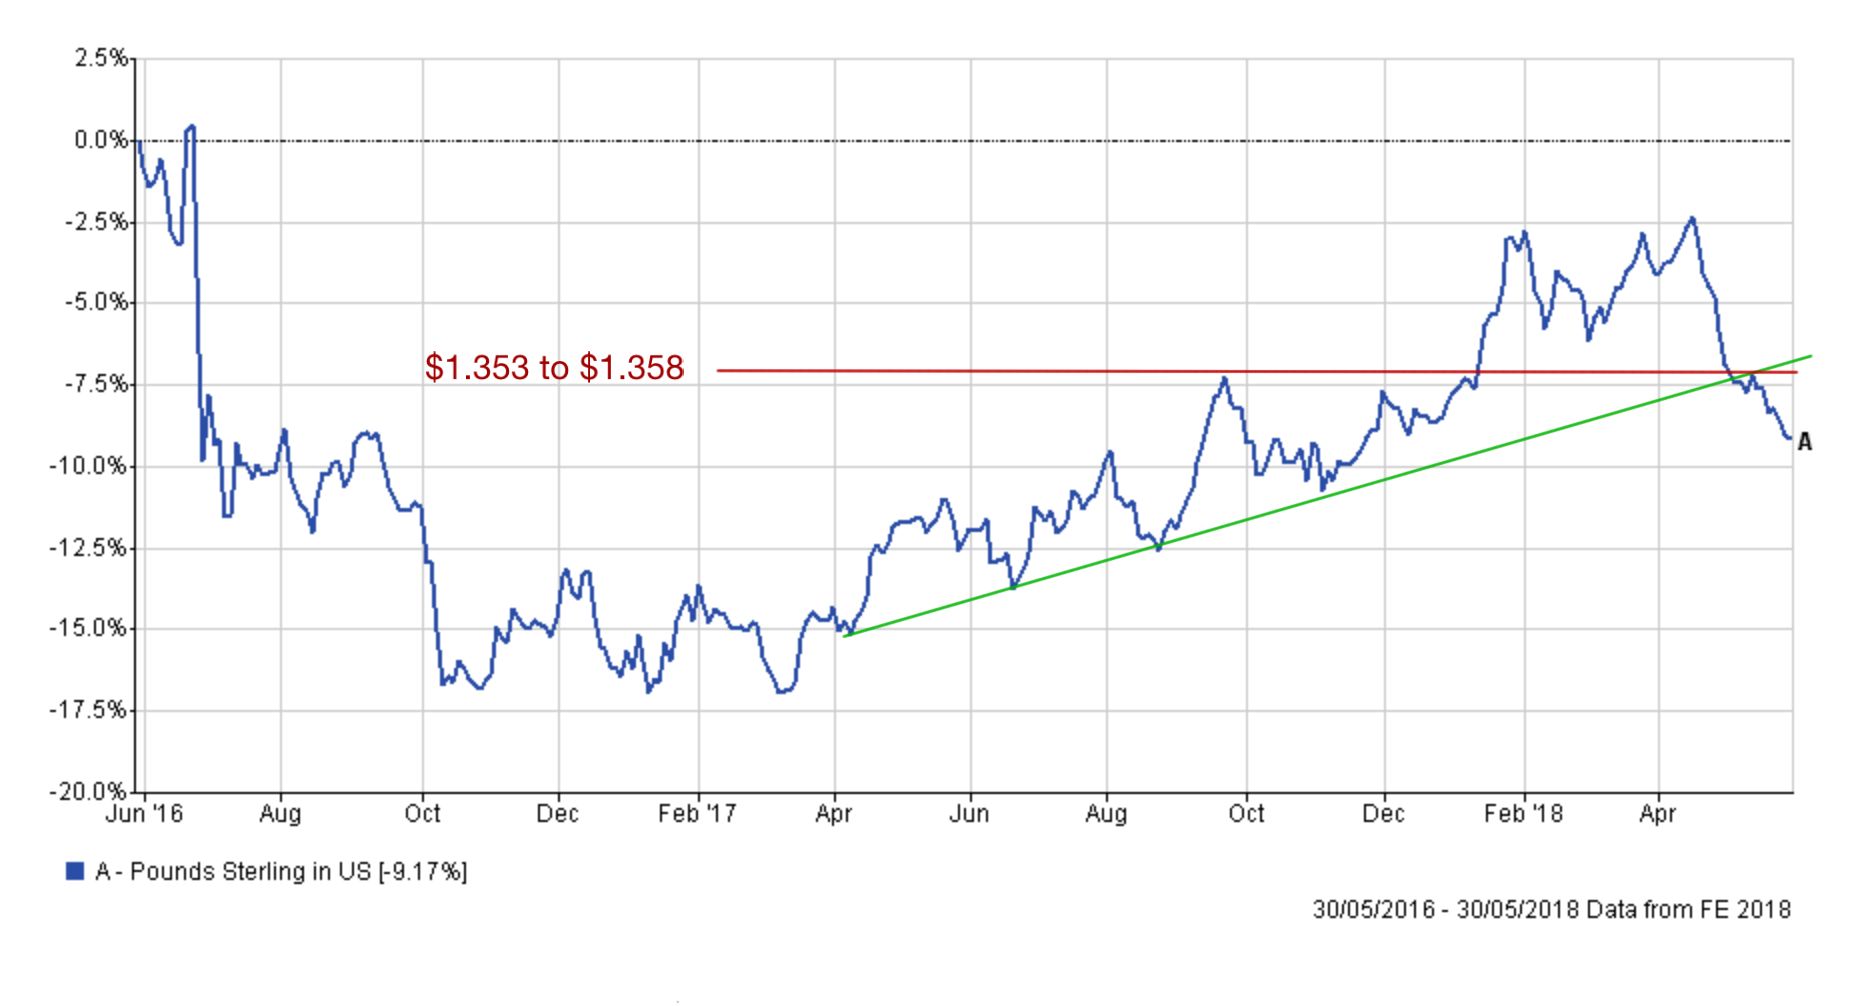
For UK investors the strength of the pound was one of the biggest influences on their returns in 2017 and remains so in 2018. The rollercoaster ride of the pound vs the dollar in recent months has been reflected in the performance of the FTSE 100. We eventually hit the $1.43 level highlighted in my last technical analysis piece but a stronger dollar, renewed political uncertainty in the UK and weak UK economic data hit the pound hard. The chart below shows how the uptrend in the pound versus the dollar was broken sending sterling into a freefall.
On the upside, the pound needs to break back above $1.34, $1.347 and the tougher $1.353 level for it to have any chance of pushing higher once again. On the downside, the pace of the descent has slowed as the pound is trying to find support around the six month low. If we carry on downwards then the $1.3117 level is crucial (we are currently at $1.328) which would make $1.30 increasingly likely. If we do head to that level then $1.30 is a strong resistance level. If the downtrend is to be reversed then it will likely have as much to do with what is happening across the pond (i.e a delay in the US Federal Reserve raising interest rates) as it will do with what happens this side.
Don't forget that when the pound falls any funds or assets held overseas are immediately worth more (ignoring any change in their underlying value) because of the currency exchange rate. Obviously, the converse is also true.

£200 Pension Cashback Offer
Make a qualifying deposit or transfer a pension to our partner Interactive Investor.
- Deposit or transfer a pension of at least £20k and you could earn £200 cashback
- Terms and Fees apply, Capital at risk
- New & Existing customers opening a SIPP
- Offer ends 31st July 2026
Before starting your transfer, check you won't lose any valuable benefits (such as guaranteed annuity rates or a lower protected pension age) and find out what exit fees you might have to pay
