


That is what this piece of research answers. The problem with investment commentators is that they are quick to recite investment mantras and perceived wisdoms. How many times have you heard someone say that you shouldn't panic when markets crash and 'you have to be in it to win it'.
Ask an investment professional to show you the evidence to back their claims and they will clam up. In truth, investment management companies and financial advisers want you to keep your money invested otherwise they don't get paid. Don't forget they get paid by taking a slice (a fee) of your portfolio every month. 80-20 Investor is all about testing facts and analysing markets to produce action points that can stack the odds in your favour.
How to answer the million dollar question
To begin with you need a huge set of historical data to analyse. The main UK stock market, the FTSE 100, has been around since 3rd January 1984. Since that time there has been an incredible 8,216 trading days. In that time we've had huge rallies (such as the dotcom boom) and crashes (including the financial crisis after Lehman Brothers collapsed as well as Black Monday). We've had wars, political upheaval, recessions and even the birth of home computing and the internet. So as far as data sets go it is pretty robust.
So over the course of 3 days I analysed the opening and closing prices of the FTSE 100 for every day over the last 31 years. I also analysed the changes in the FTSE 100 index from day to day.
In very simple terms the perfect investment strategy would be to ensure that you are in the market for the best days and avoided the worst days. If markets behaved in a random way then the best and worst days for investors should be spread out randomly throughout the 31 year period.
For the record the best ever day for the FTSE 100 was 24th November 2008 when the FTSE 100 rose 9.839%. Meanwhile the worst was the day after Black Monday (20th October 1987) when the index fell 12.216% in a single day.
That fact alone gives a tantalising breadcrumb trail to follow and see where it leads. On 15th September 2008 Lehman Brothers (a financial services firm in the US) filed for bankruptcy. This then caused the stock market to collapse and financial markets to go into meltdown.
It may seem surprising that the best ever day of the FTSE 100 was just two months after one of its darkest moments. But upon further investigation the second best ever day for the FTSE 100, with a gain of 8.84%, was 19th September 2008. Just 4 days after the Lehman Brothers collapse!
Best and worst ever days for the FTSE 100
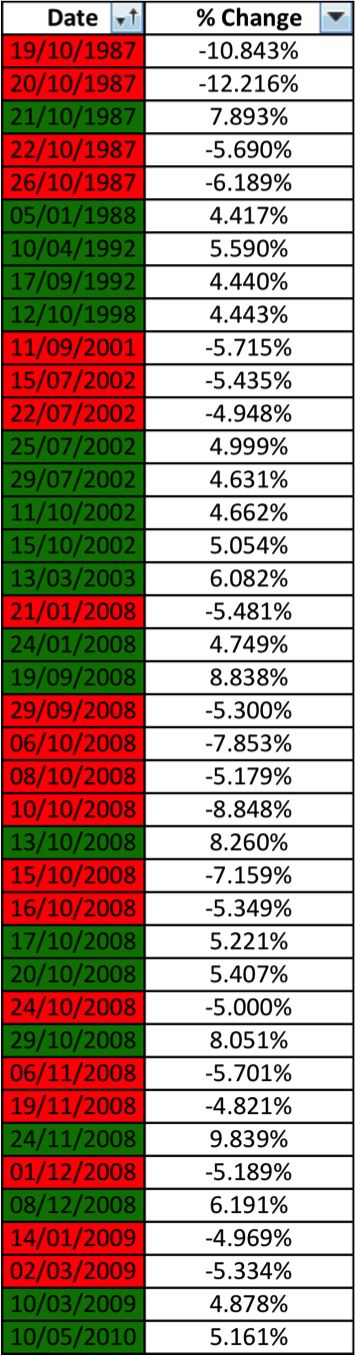
After analysing the daily movements in the FTSE 100 for each day over the last 31 years I compiled a list of the 20 best and 20 worst days in terms of performance. Below I've compiled these lists into a single table sorted by date. The 20 worst days are highlighted in red while the best days are highlighted in green. The daily movement of the FTSE 100 for the day in question is shown in the second column.
If you run down the list you should start to notice a trend beginning to emerge. There is a statiscally significant correlation between the occurrence of the worst days on the FTSE 100 and the best.
It is not random
Clearly the best and worst days don't happen independently of one another. In fact rather than be spread out across the 31 year timeframe the chart below shows that they are mostly grouped into 3 small windows centred around the biggest market corrections in history. The first was Black Monday, the second was the popping of the dotcom bubble and the third was the aftermath of the collapse of Lehman Brothers. These are shown by the greyed out areas in the chart below and represent 32 of the above dates. Click on the chart to enlarge it
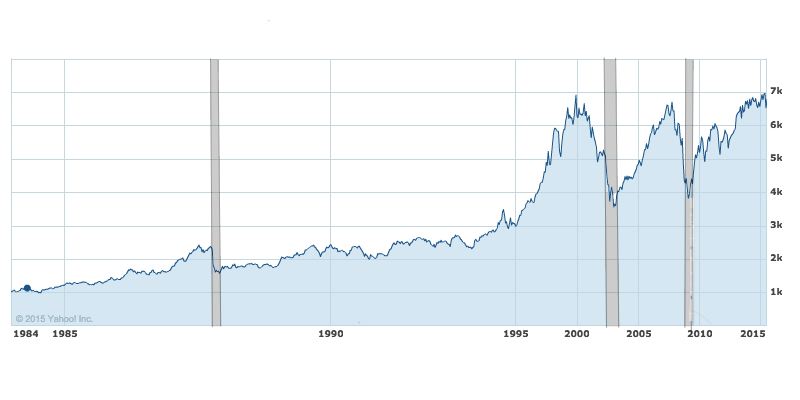
This grouping becomes even more apparent if you extend the analysis to looking at the best 50 days and the worst 50 days for the FTSE 100 Index. So clearly the best and worst days occur near each other. But is there a pattern in the order that they occur?
Somewhat amazingly 30 out of the 50 best days occur within 7-8 days following one of the worst days on the FTSE 100. A lot of these actually occur within a day or two.
Furthermore 36 of the '50 worst days' occur within two weeks of one of the' 50 best days'.
Can you time the market?
Of course there are instances where the time between a terrible day on the FTSE 100 and one of its best days slips into months or occasionally years. But is it possible to determine the typical length of time between one of the worst days and a subsequent bounce?
The answer is yes. In a data set such as this one where there is a lot of bunching with just a few outliers you need to look at the median value. What you find is that following one of the worst days on the FTSE 100 you typically have to wait just 6 days for a one of it's best performing days to appear. Or in other words...
When markets suddenly sell-off typically they will bounce back strongly around 6 days later.
But will you still lose money?
I decided to take the analysis one step further. I looked at where the FTSE 100 index was at the end of a bad day and then where it was after the subsequent 'best' day. Or in other words I was trying to see whether the bounce was worth waiting for.
As you'd expect there was a wide range of outcomes at either extreme but again there was a clustering.
Typically the bounce after a sell-off will take you 1.8-2% above where the FTSE 100 closed on the initial bad day.
Market over-reaction
On the face of it my findings will surprise a lot of investors but they can be explained by investors' biggest weakness, their emotions. If you look back at the chart of the FTSE 100 above you will notice that the greyed out areas, where the best and worst trading days occur, are at the latter stages of a wider market correction. This is because at the start of an unfolding severe market correction investors are in denial and remain in the market. However once the trend becomes entrenched panic sets in and investors bail out en-masse.
This is when the biggest daily falls occur. However, there always comes a point when the market is oversold and eventually bounces back. This is when the best trading days occur as the fearless investors spot the value opportunities and everyone else catches on. The market then continues to climb but in a more tentative fashion as investor confidence returns.
So when the market sell-off dramatically what should you do?
Clearly there is no fool-proof strategy but history suggests that following a severe market correction you would be better off staying in the market, especially if it comes after the market has already been falling. It's a case of holding your nerve as a knee-jerk reaction will crystalise the loss and you'll miss the subsequent bounce.
The evidence seems to back my 'falling glass' analogy when I was recently talking about what to do regarding the Greek debt crisis.
So how does this all relate to our stop loss alerts?
So you might wonder where 80-20 Investor's trailing stop alerts fit into all this. Is the research saying that stop losses alerts are pointless?
No. If you look at the above chart a trailing stop loss would have triggered near the top of the 3 greyed out areas, long before the worst trading days occurred. Had a cautious investor sold then they would have missed the overall market correction and the worst trading days in history.
What this research shows is that if you ignore stop loss alerts and take a long term view you are better off staying in the market and riding the remainder of the storm out. Rather than regretting your earlier decision and selling in a knee-jerk reaction.
The material in any email, the MonetotheMasses.com website, associated pages / channels / accounts and any other correspondence are for general information only and do not constitute investment, tax, legal or other form of advice. You should not rely on this information to make (or refrain from making) any decisions. Always obtain independent, professional advice for your own particular situation. See full Terms & Conditions and Privacy Policy
Neither MoneytotheMasses.com/80-20 Investor nor its content providers are responsible for any damages or losses arising from any use of this information. Past performance is no guarantee of future results.
Funds invest in shares, bonds, and other financial instruments and are by their nature speculative and can be volatile. You should never invest more than you can safely afford to lose. The value of your investment can go down as well as up so you may get back less than you originally invested.
Information provided by MoneytotheMasses.com/80-20 Investor is for general information only and not intended to be relied upon by readers in making (or not making) specific investment decisions.
Appropriate independent advice should be obtained before making any such decisions. Leadenhall Learning (owner of MoneytotheMasses.com/80-20 Investor) and its staff do not accept liability for any loss suffered by readers as a result of any such decisions.
The tables and graphs are derived from data supplied by Trustnet. All rights Reserved.

£200 Pension Cashback Offer
Make a qualifying deposit or transfer a pension to our partner Interactive Investor.
- Deposit or transfer a pension of at least £20k and you could earn £200 cashback
- Terms and Fees apply, Capital at risk
- New & Existing customers opening a SIPP
- Offer ends 31st July 2026
Before starting your transfer, check you won't lose any valuable benefits (such as guaranteed annuity rates or a lower protected pension age) and find out what exit fees you might have to pay
