

The Vanguard LifeStrategy fund range is a popular choice among investors as it provides a way to access low-cost globally diversified bond/equity funds with varying degrees of investment risk. There are five funds within the range with equity exposure ranging from 20% to 100%. These are namely:
- Vanguard Lifestrategy 20% Equity
- Vanguard Lifestrategy 40% Equity
- Vanguard Lifestrategy 60% Equity
- Vanguard Lifestrategy 80% Equity
- Vanguard Lifestrategy 100% Equity
In fact, such is the popularity of the Vanguard Lifestrategy range that the Vanguard Lifestrategy 60% Equity fund is the largest within its sector (Mixed Investment 40-85% Shares) with over £13 billion under management. Across all five Lifestrategy funds there is a total of £35.6 billion under management.
The range of funds has an almost cult-like status among some die-hard investors, largely thanks to strong performance over the long-term, although that performance was hit hard during the bond market rout of 2022. In fact, back in July 2022 I recorded the Money to the Masses podcast episode 378 which covered the downsides to the Lifestrategy funds in more detail.
But there are also those investors who use the Vanguard Lifestrategy funds as core holdings within their portfolio and then invest the rest of their money in other funds, perhaps using 80-20 Investor or their own research. Whether you are a die-hard fan or just using the Lifestrategy funds as a diversifier there is a potential problem once your holding hits a certain size.
FSCS problem
As with any large fund holding there comes a point when your investments are no longer fully covered by the Financial Services Compensation Scheme (the FSCS). This arises when the amount held in a fund exceeds the FSCS coverage limit of £85,000. The Financial Services Compensation Scheme (FSCS) in the UK offers a safety net for investors, which covers a range of financial products including savings accounts and even money invested via a fund platform.
Under the terms of the FSCS, if a fund platform (such as Hargreaves Lansdown or Fidelity International) were to go bust and you were to suffer a loss as a direct result then you would be covered up to £85,000. In reality if a fund platform were to go bust then investors would most likely not incur losses as their money will likely be already invested in designated UK banks or in funds. Full details of the protection can be found on your investment platform's website.
But in this article I am focused on the protection afforded to money already invested into funds. Under the terms of the FSCS your money is protected up to £85,000 per fund provider per person. In short, that means that if you hold any number of Vanguard funds, whether on one platform or across a number of them, then should Vanguard go bust you would only be covered up to a total of £85,000.
While some investors may be unaware of the FSCS limitations, or indeed have faith in the financial stability of the likes of Vanguard, it raises the interesting question of whether it is possible to find other funds that do the same thing as the Lifestrategy funds, which are run by other fund houses? The answer is yes you can if you know how to find them.
So in this research article I show you how I went about finding "ready-made" alternative options to the three most popular Lifestrategy funds, namely:
- Vanguard Lifestrategy 40% Equity
- Vanguard Lifestrategy 60% Equity
- Vanguard Lifestrategy 80% Equity
I then briefly explain how you can make your own alternatives from scratch.
Methodology
The first thing to point out is that when it comes to finding Lifestrategy alternatives I focused on UK domiciled OEICs and unit trusts. That is because funds domiciled outside of the UK are not covered by the FSCS, instead they are covered by whatever consumer protection is in place in the jurisdiction of where the fund is domiciled. Furthermore it is also unlikely that investments in an investment trust or an ETF would be covered under the FSCS because both are effectively investments into company shares (i.e. more akin to direct share holdings). Furthermore most ETFs are domiciled overseas anyway which excludes them from the protection of the FSCS. So to find Vanguard Lifestrategy alternatives I looked at the OEIC/unit trust universe exclusively.
For each Lifestrategy fund I then calculated the correlation coefficients over the last five years between it and all of the other funds within its sector. While calculating the correlation coefficient is complicated, its application isn't. The correlation coefficient (CC) can range between -1 and 1. A figure of 1 would suggest that the two objects follow each other in lockstep (so when one moves up so does the other) while a score of -1 suggests that as one rises the other falls and vice versa. A score of 0 means that two funds are not correlated.
Or in other words by using this statistical measure, and only considering funds with a CC above 0.95 I was able to produce shortlists of funds that moved in the same way as the three respective Lifestrategy funds.
However, just because they move in almost the same way doesn't mean that they move in EXACTLY the same way, and small differences can still lead to huge divergences in performance over time. Therefore I pruned the shortlists further by looking at the 5 year, 3 year and 1 year performance figures for each fund. I considered the similarity (or difference) in performance figures, paying particular attention to the 5 year performance numbers. By doing this I was able to produce 3 final lists of funds.
But what was fascinating was the Vanguard Lifestrategy 60% Equity fund was the trickiest fund to find an alternative option for. However, I eventually managed to do this by looking at the CC between it and the funds from another sector, the more cautious Mixed Shares 20-60% Shares sector. Within that sector there is a fund with a 57% equity exposure which behaves almost identically to the Vanguard Lifestrategy 60% Equity fund. In fact, the "alternative" has outperformed the Vanguard fund over 1 month, 3 month, 6 month, 1 year, 3 year and 5 year timeframes.
Now bear in mind, there are other funds that could be viewed as possible alternatives but those listed below were the closest fit under my methodology. In each scenario I provide a chart showing the 1 year, 3 year and 5 year performance of the funds for comparison purposes. You can see that during certain periods some funds outperform others.
I also include the asset mix of each fund, to show how they are different to the Lifestrategy fund itself. As such, the 'alternatives' can also be seen as options for those investors wanting something like a Lifestrategy fund but with more exposure to a certain asset class, such as Emerging markets equities for example. Or the information can be used to find alternatives that exclude certain assets, such as UK equities. The information provides a starting point for further research.
The eagle-eyed among you will notice that a number of the alternatives have made appearances in recent BFBS tables.
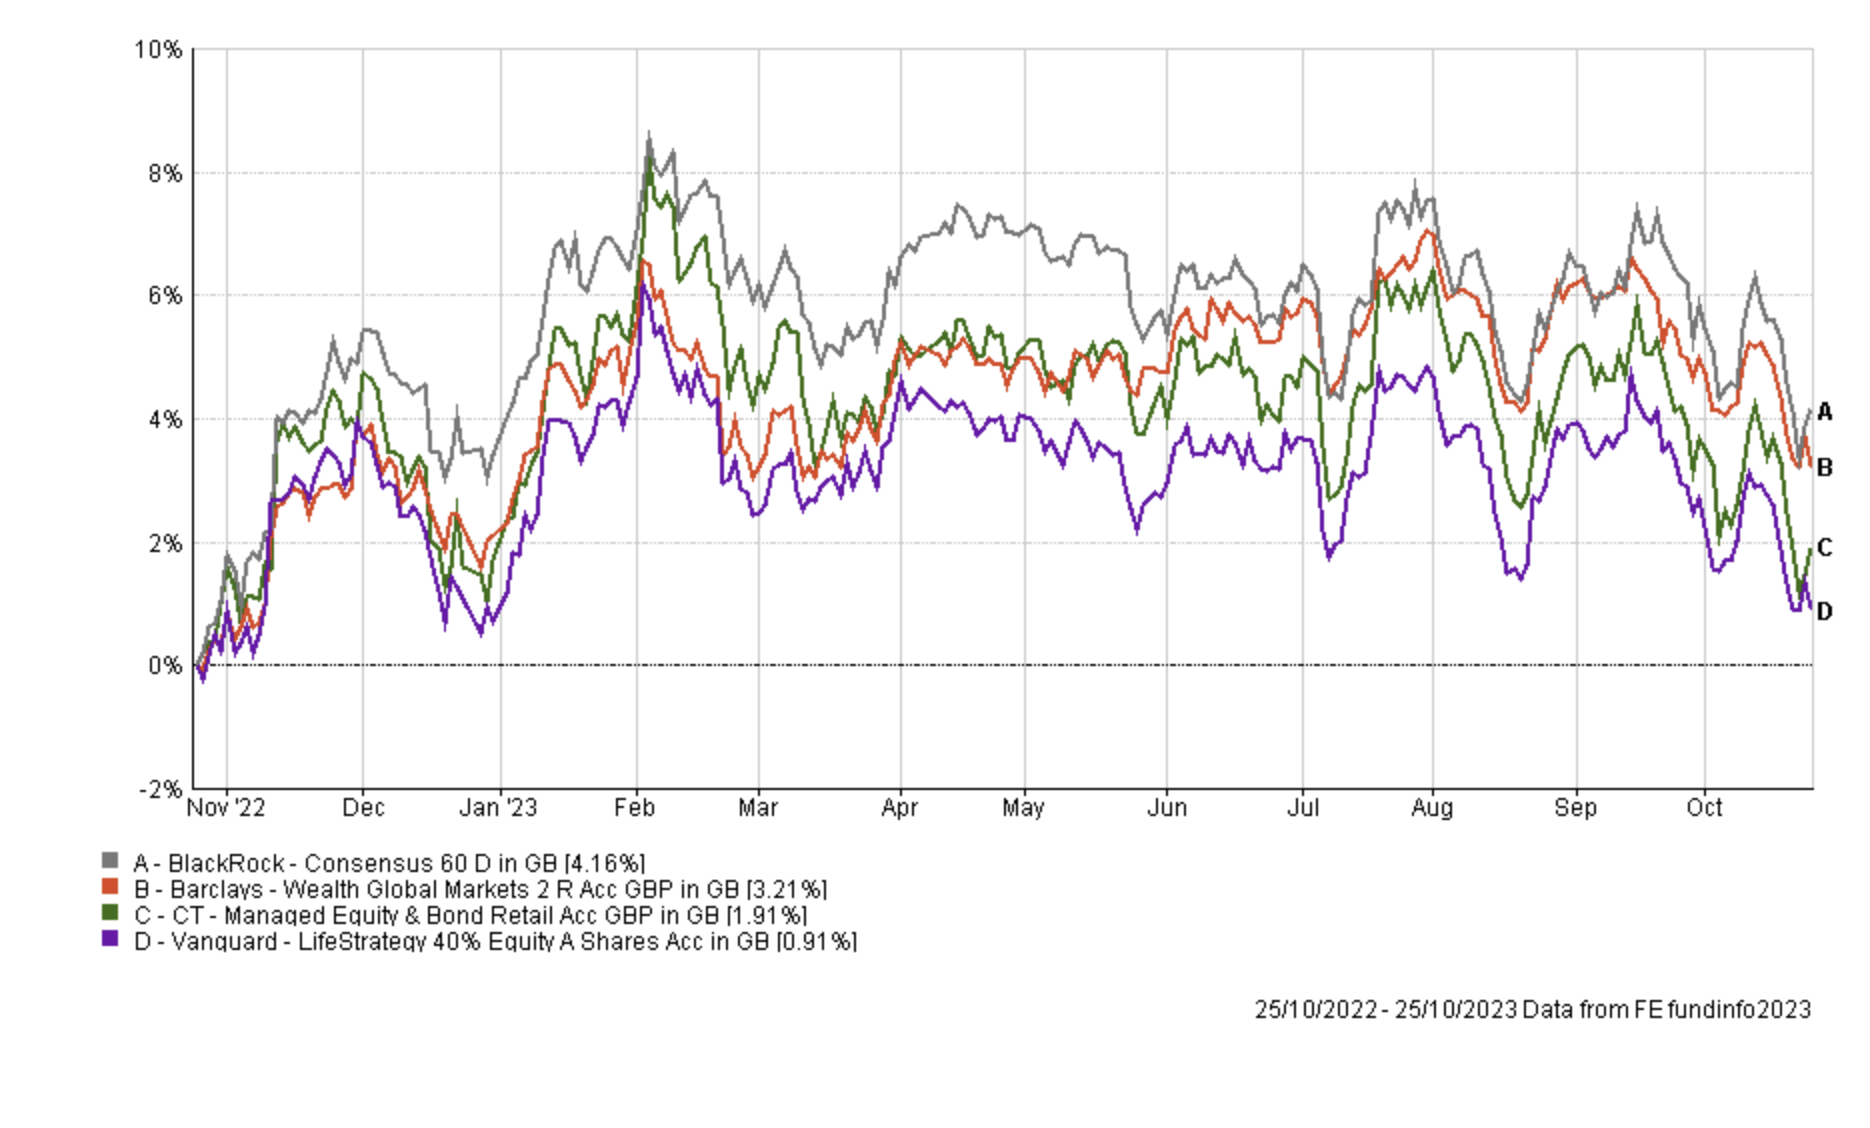
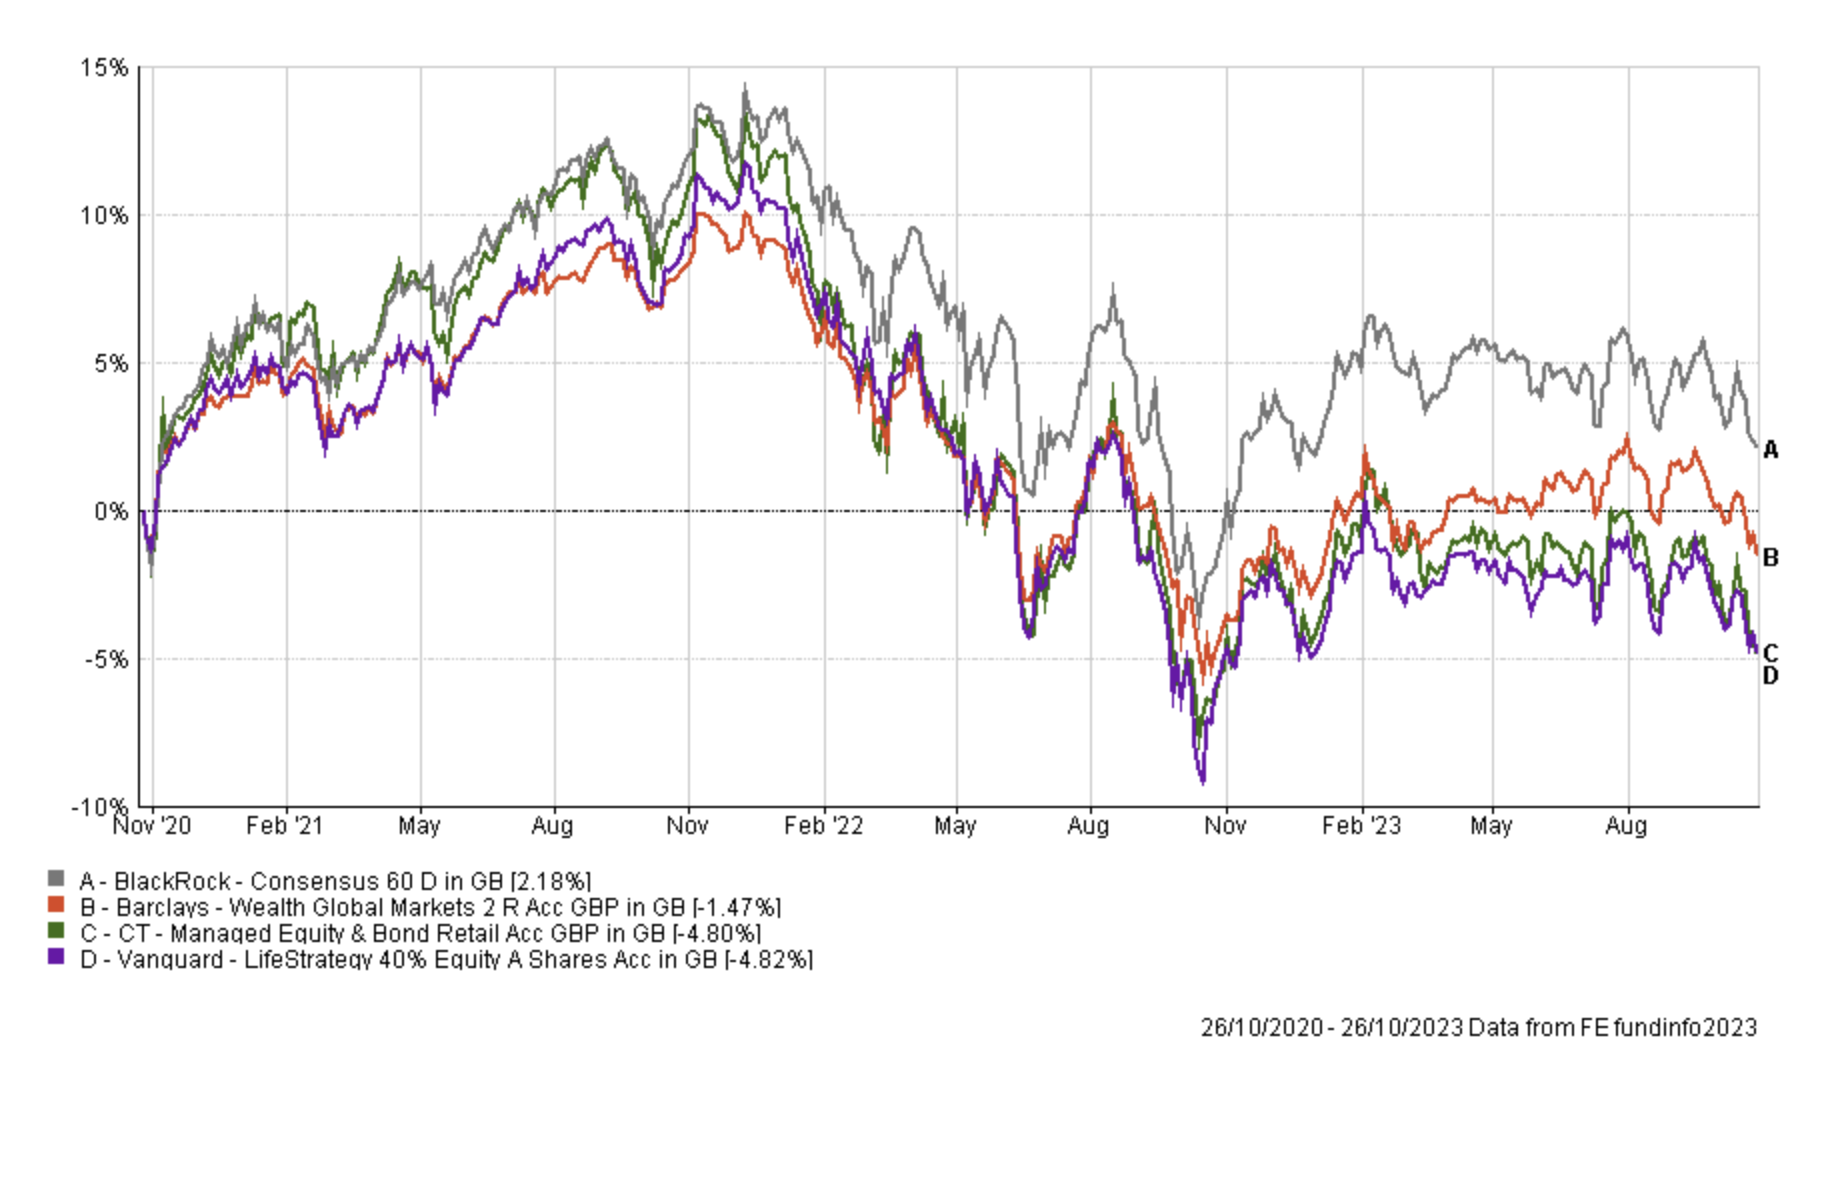
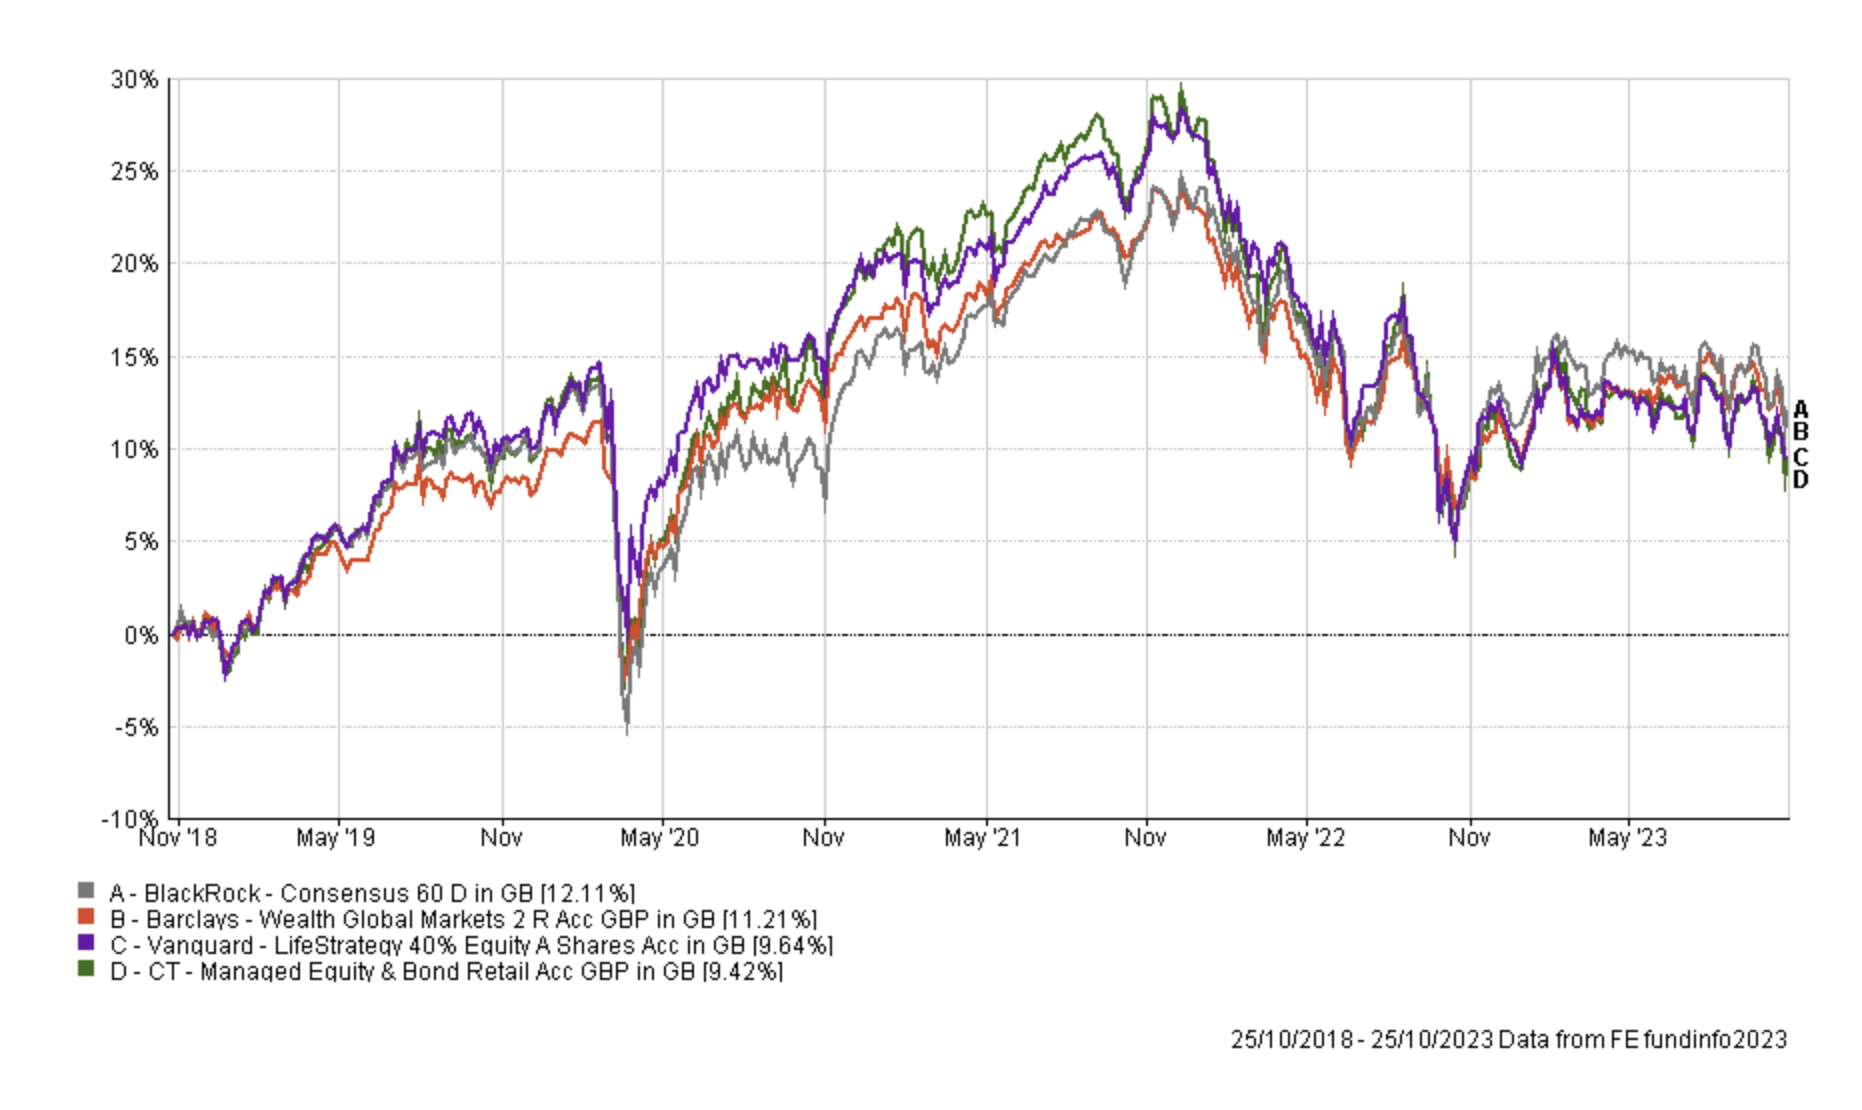
Vanguard Lifestrategy 40% Equity alternatives
Asset mix
| Asset | Barclays Wealth Global Markets 2 | BlackRock Consensus 60 | CT Managed Equity & Bond | Vanguard LifeStrategy 40% Equity |
| % North American Equities | 28 | 11 | 13 | 20 |
| % Asia Pacific Equities | 0 | 0 | 2 | 1 |
| % Japanese Equities | 0 | 2 | 2 | 2 |
| % European Equities | 0 | 7 | 1 | 4 |
| % UK Equities | 0 | 20 | 14 | 10 |
| % Global Emerging Market Equities | 11 | 0 | 18 | 3 |
| % UK Fixed Interest | 0 | 0 | 9 | 6 |
| % UK Gilts | 0 | 10 | 14 | 9 |
| % UK Index-Linked | 0 | 0 | 0 | 5 |
| % Global Fixed Interest | 35 | 40 | 26 | 40 |
| % Money Market | 26 | 7 | 0 | 0 |
| % Alternative | 0 | 3 | 0 | 0 |
Performance
(top performer for each time period is in green)
| Fund | 1month % return | 3month % return | 6month % return | 1yr % return | 3yr % return | 5yr % return |
| Barclays Wealth Global Markets 2 | -1.73 | -3.02 | -1.27 | 3.28 | -1.27 | 11.88 |
| BlackRock Consensus 60 | -2.45 | -3.23 | -3.12 | 3.47 | 2.18 | 11.91 |
| CT Managed Equity & Bond | -3 | -4.46 | -3.58 | 0.86 | -4.8 | 8.44 |
| Vanguard LifeStrategy 40% Equity | -2.01 | -3.48 | -2.63 | 1.13 | -4.61 | 9.83 |
Performance chart - 1 year
Performance chart - 3 year
Performance chart - 5 year
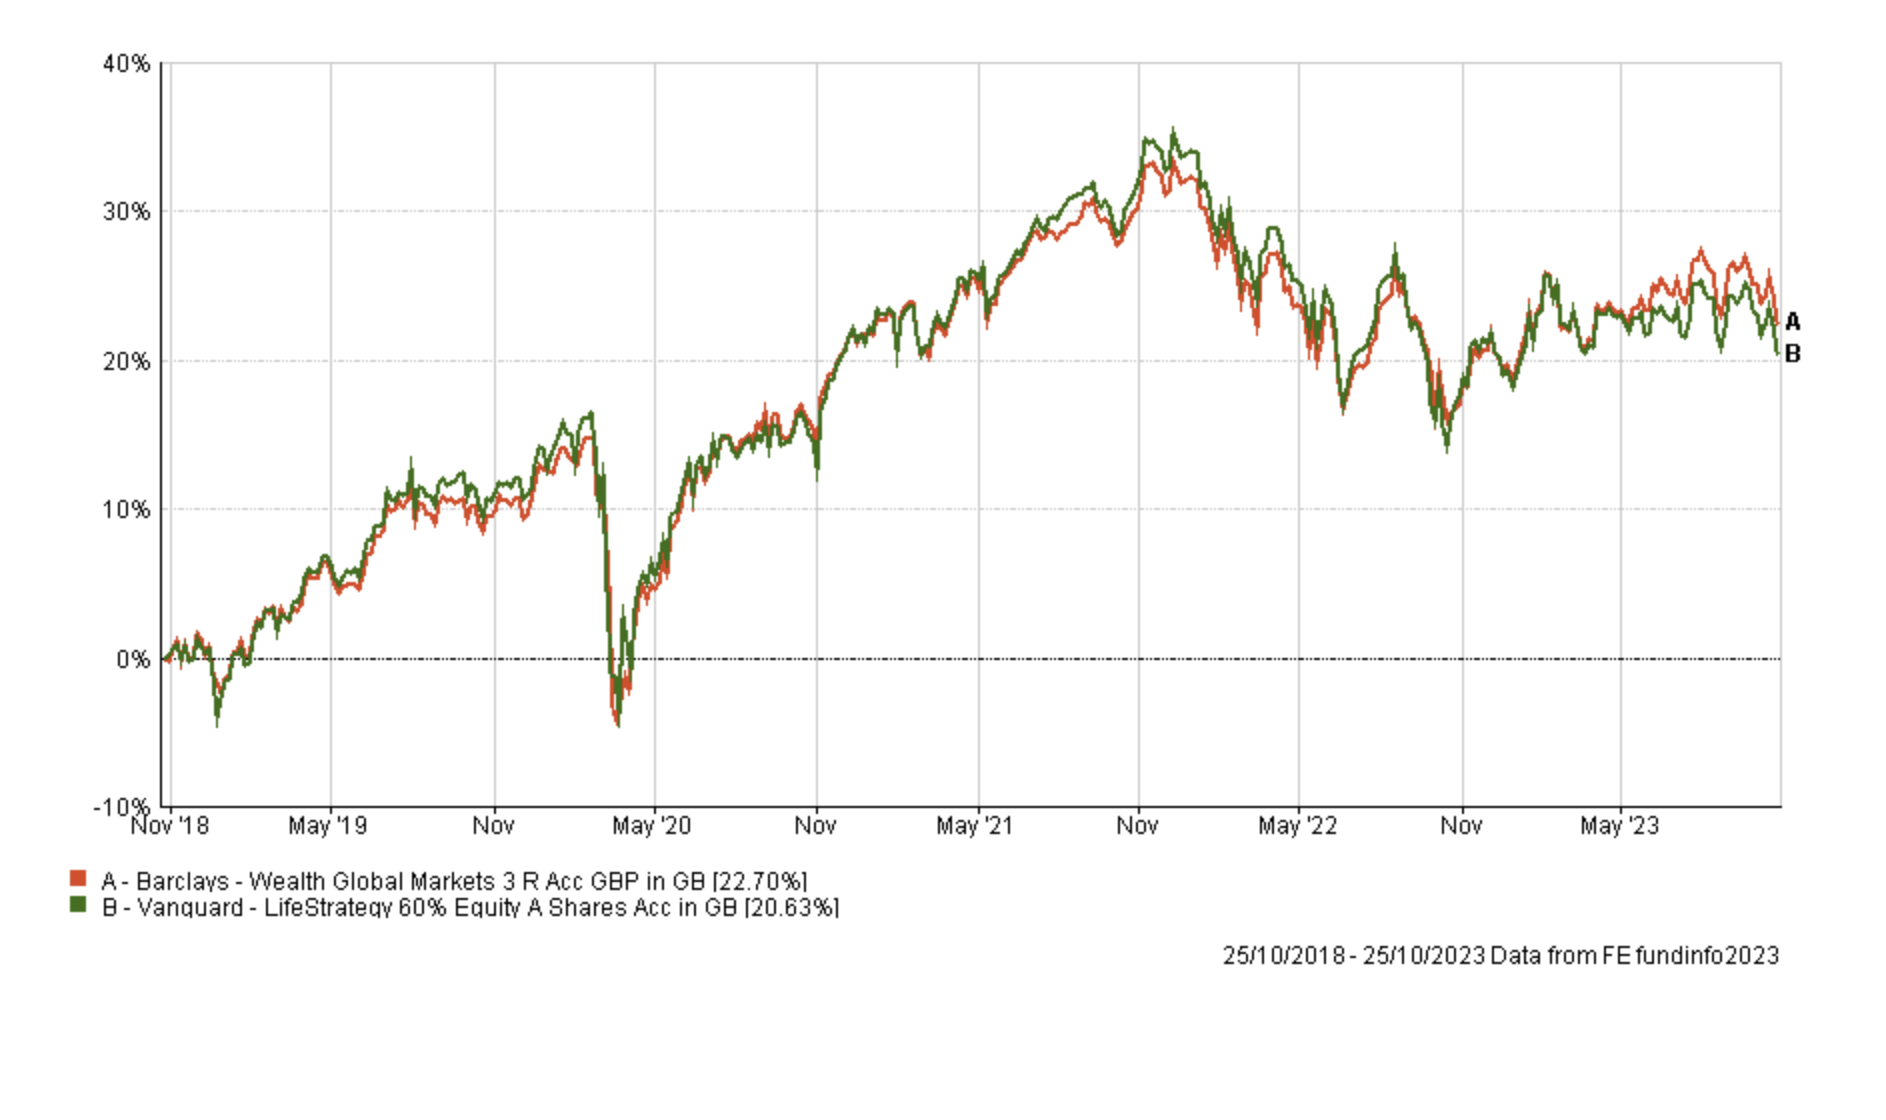
Vanguard Lifestrategy 60% Equity alternative
Asset mix
| Asset | Barclays Wealth Global Markets 3 | Vanguard LifeStrategy 60% Equity |
| % North American Equities | 30 | 30 |
| % Asia Pacific Equities | 0 | 2 |
| % Japanese Equities | 3 | 3 |
| % European Equities | 6 | 6 |
| % UK Equities | 0 | 15 |
| % Global Emerging Market Equities | 16 | 5 |
| % International Equities | 1 | 0 |
| % UK Corporate Fixed Interest | 0 | 4 |
| % UK Gilts | 0 | 6 |
| % UK Index-Linked | 0 | 3 |
| % Global Fixed Interest | 42 | 27 |
| % Money Market | 2 | 0 |
Performance
(top performer for each time period is in green)
| Fund | 1month % return | 3month % return | 6month % return | 1yr % return | 3yr % return | 5yr % return |
| Barclays Wealth Global Markets 3 | -1.91 | -3.07 | 0.11 | 5.14 | 6.07 | 23.63 |
| Vanguard LifeStrategy 60% Equity A Shares | -2.18 | -3.4 | -1.44 | 2.88 | 5.01 | 21.24 |
Performance chart - 1 year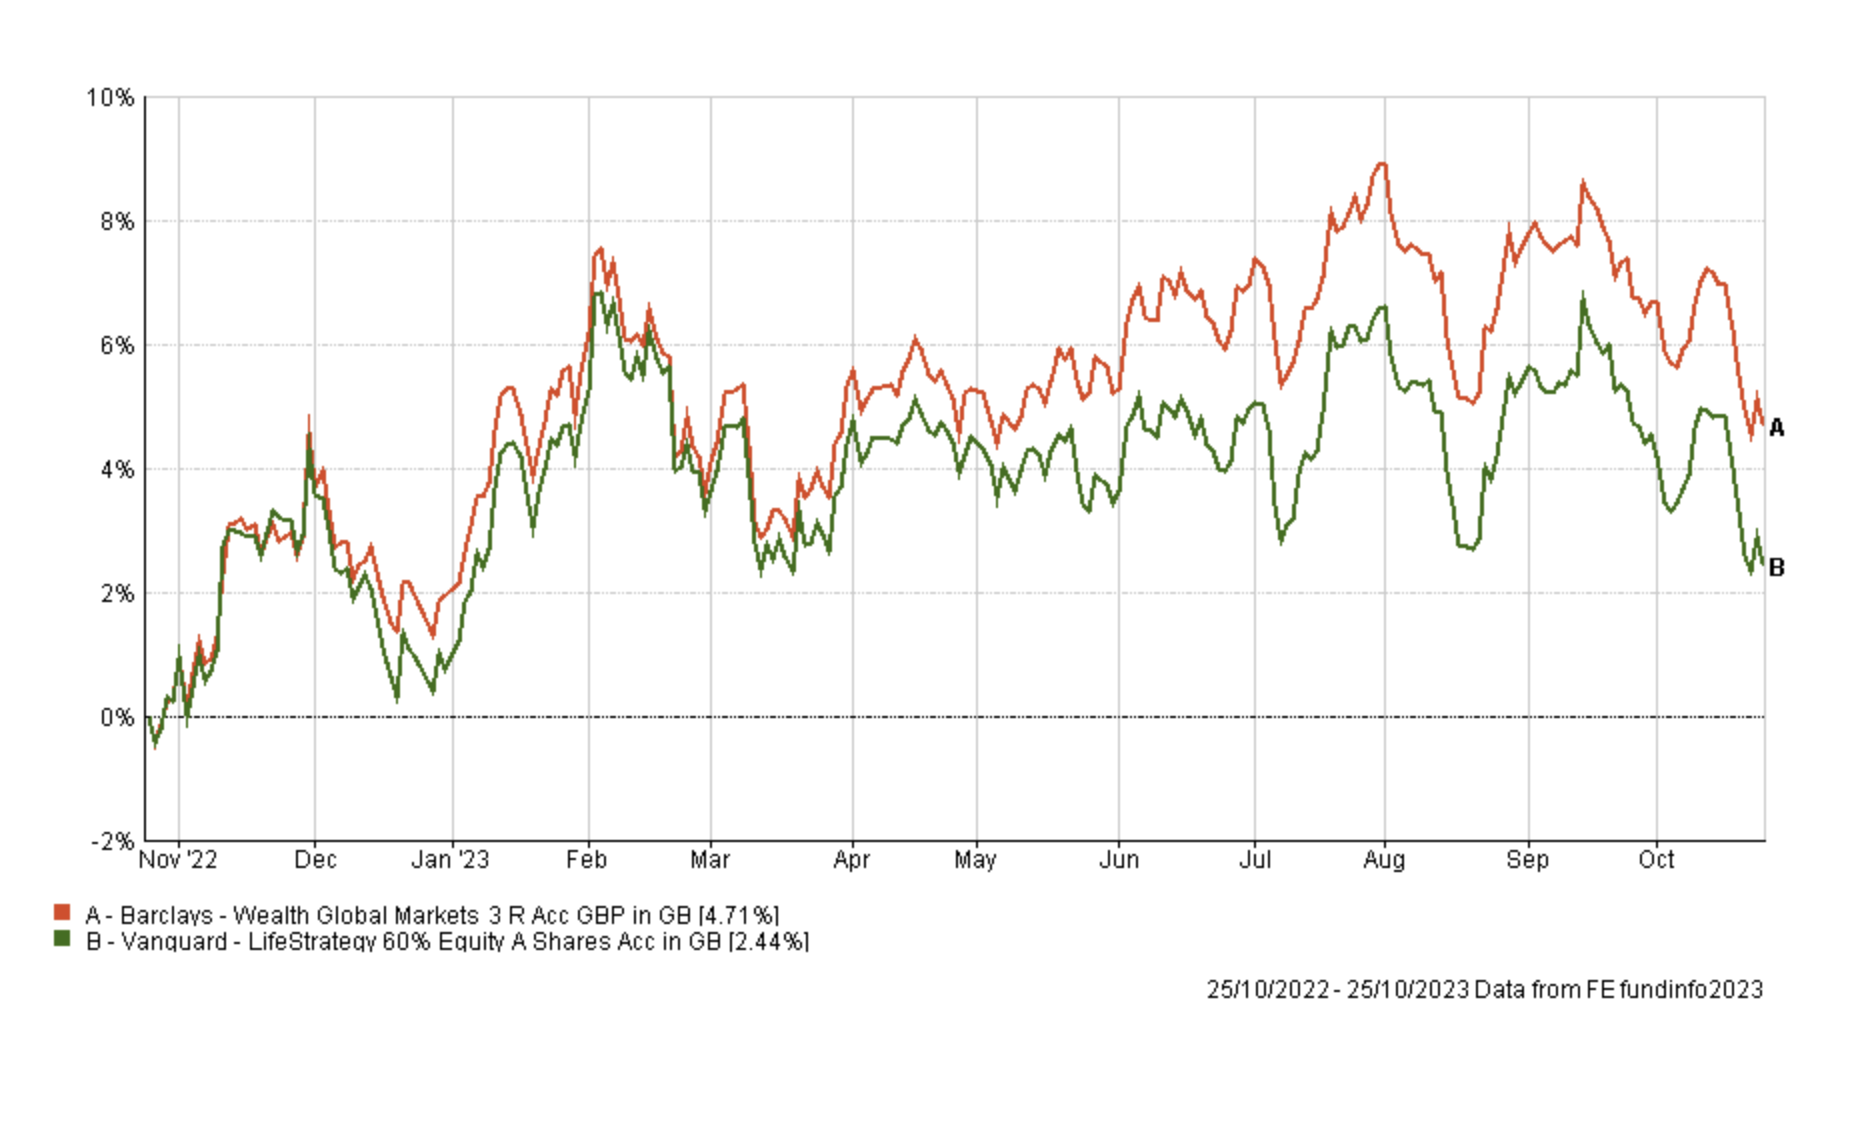
Performance chart - 3 year
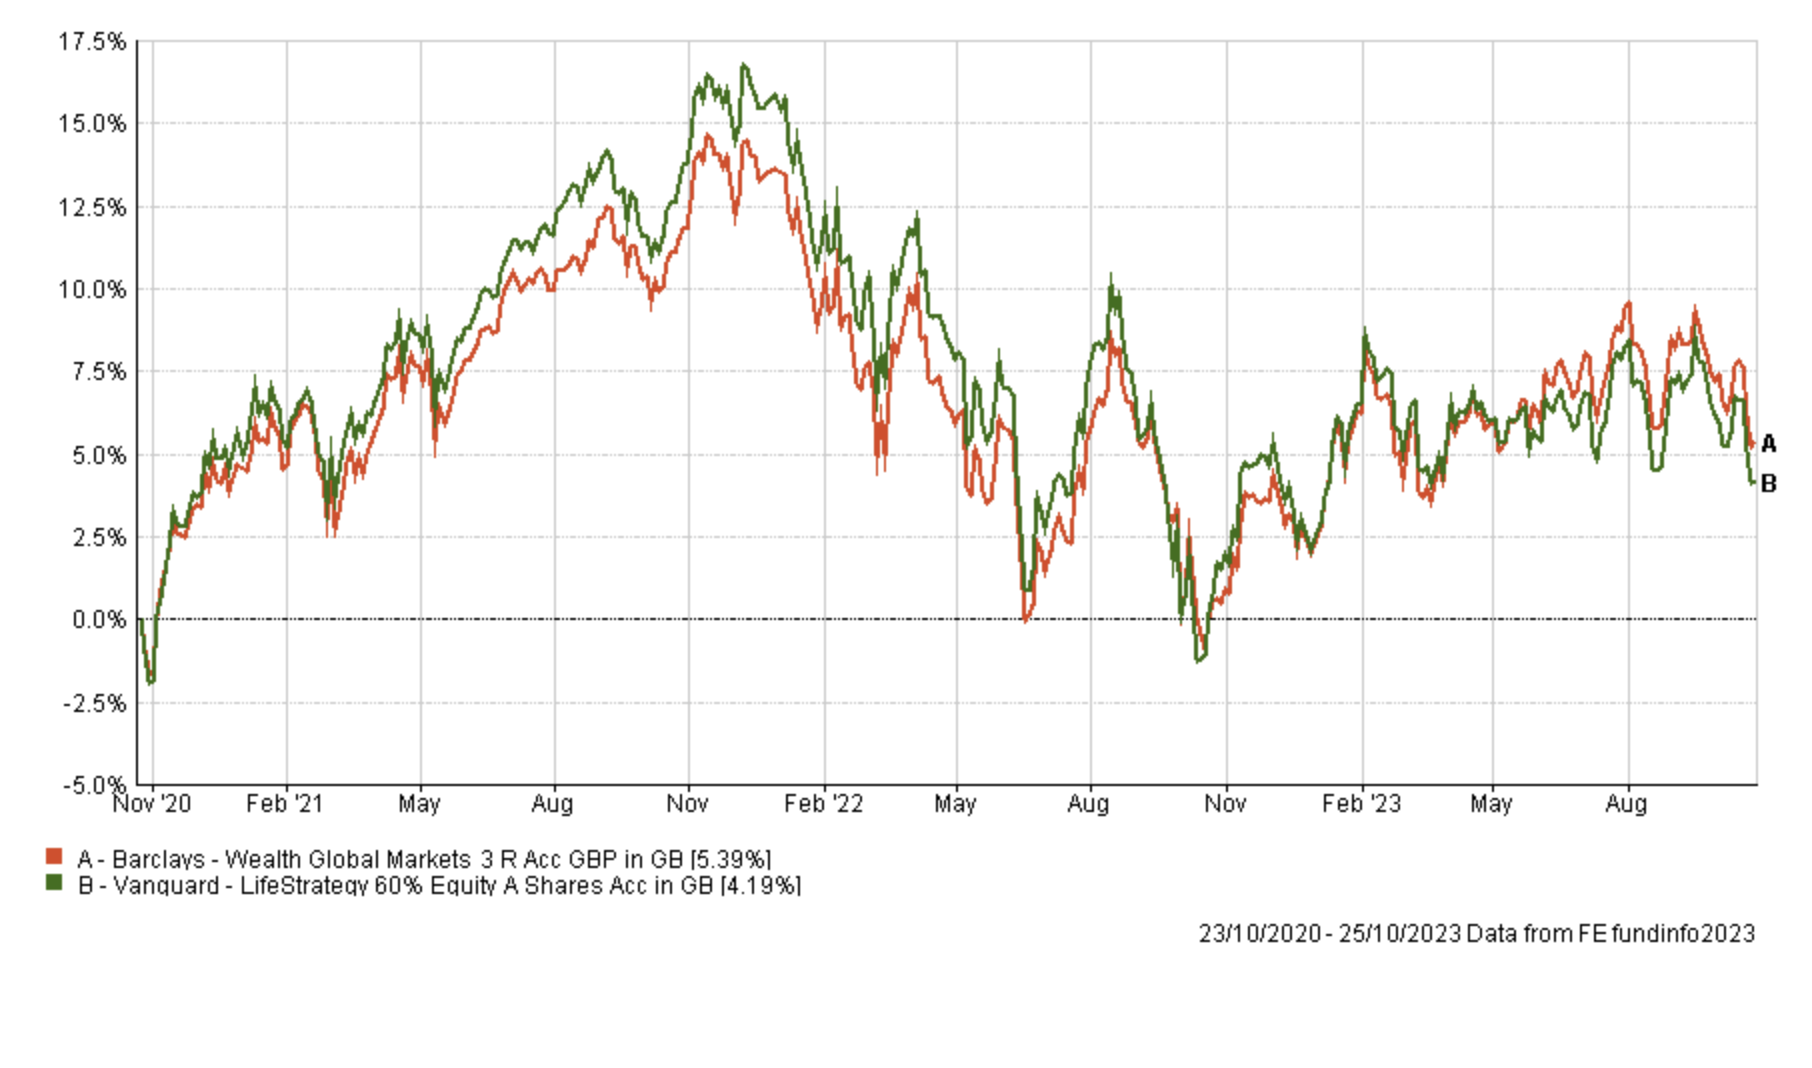
Performance chart - 5 year
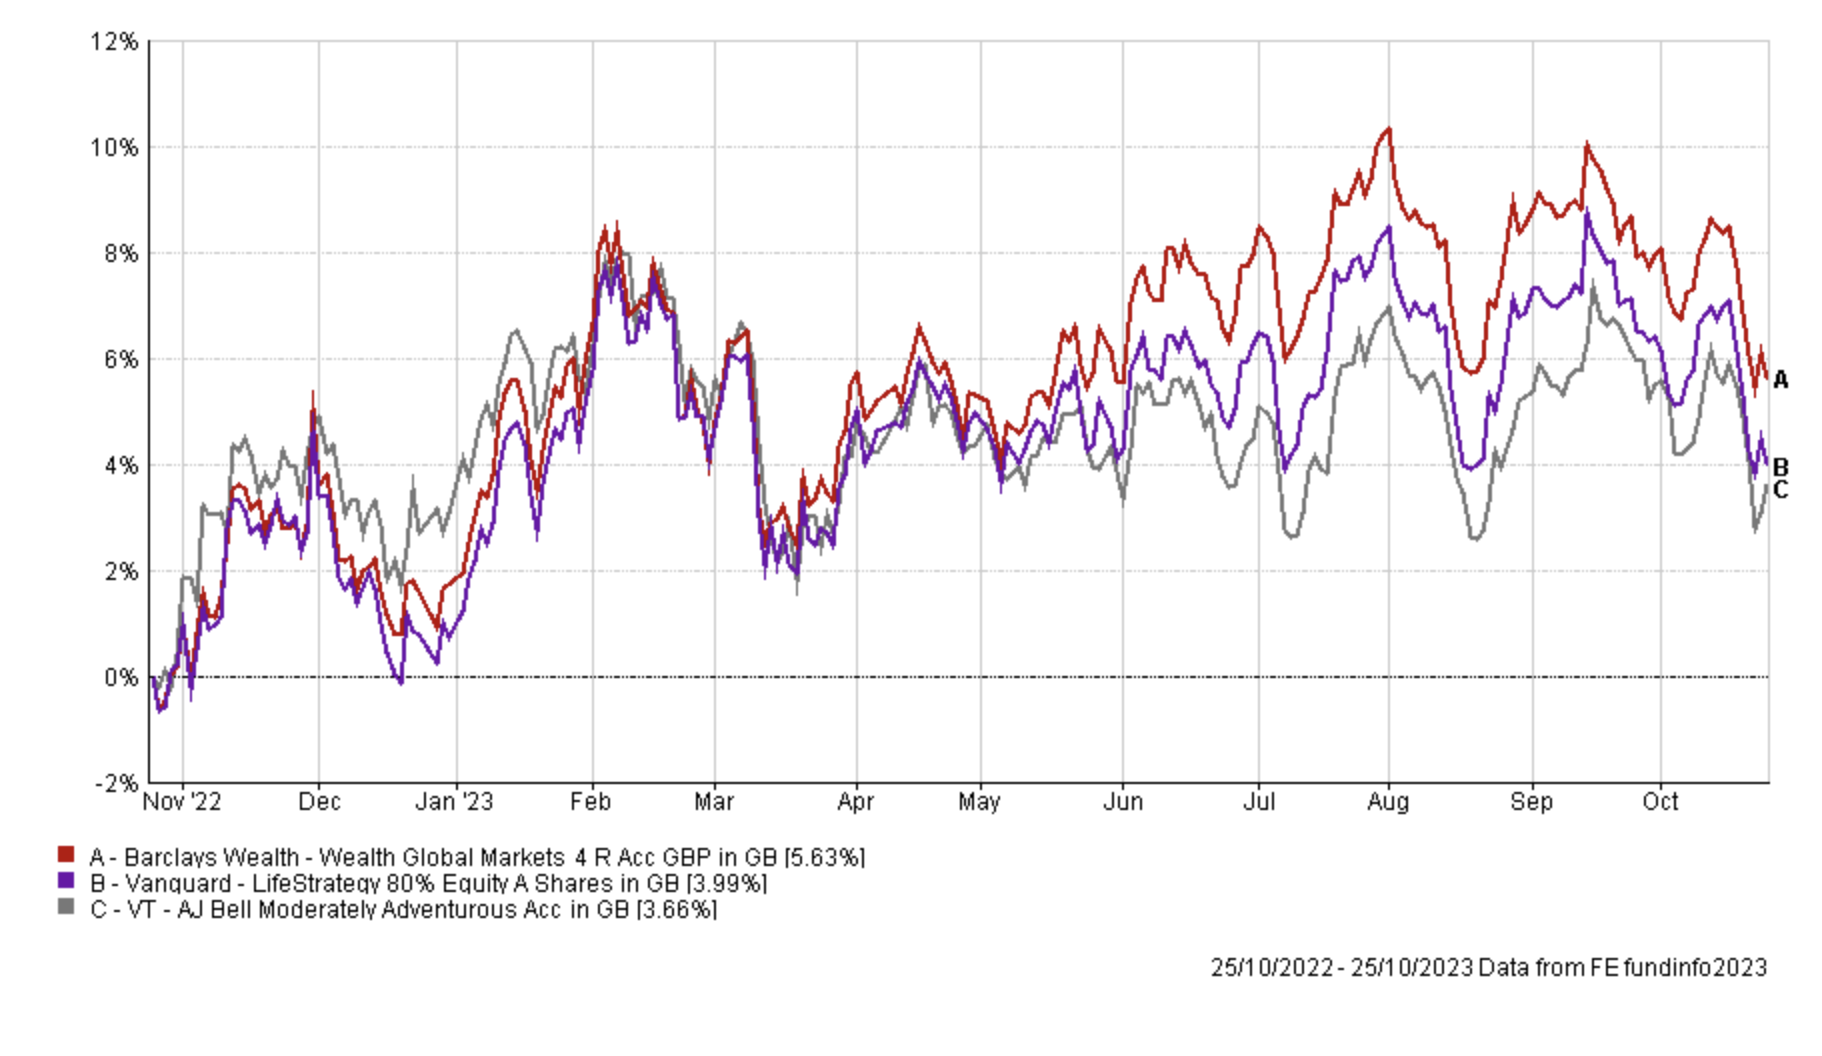
Vanguard Lifestrategy 80% Equity alternatives
Asset mix
| Asset | Barclays Wealth Wealth Global Markets 4 | Vanguard LifeStrategy 80% Equity | VT AJ Bell Moderately Adventurous |
| % North American Equities | 36 | 40 | 20 |
| % Asia Pacific Equities | 0 | 2 | 2 |
| % Japanese Equities | 2 | 4 | 5 |
| % European Equities | 9 | 8 | 3 |
| % UK Equities | 2 | 20 | 20 |
| % Global Emerging Market Equities | 24 | 6 | 20 |
| % UK Corporate Fixed Interest | 0 | 2 | 7 |
| % UK Gilts | 0 | 3 | 1 |
| % UK Index-Linked | 0 | 2 | 0 |
| % Global Fixed Interest | 25 | 14 | 18 |
| % Other | 0 | 0 | 3 |
| % Money Market | 2 | 0 | 2 |
Performance
(top performer for each time period is in green)
| Fund | 1month % return | 3month % return | 6month % return | 1yr % return | 3yr % return | 5yr % return |
| Barclays Wealth Wealth Global Markets 4 | -2.11 | -3.17 | 1.09 | 6.29 | 13.37 | 34.03 |
| Vanguard LifeStrategy 80% Equity | -2.34 | -3.33 | -0.26 | 4.66 | 15.64 | 33.58 |
| VT AJ Bell Moderately Adventurous | -2.79 | -2.78 | -1.15 | 3.23 | 16.98 | 33.61 |
Performance chart - 1 year
Performance chart - 3 year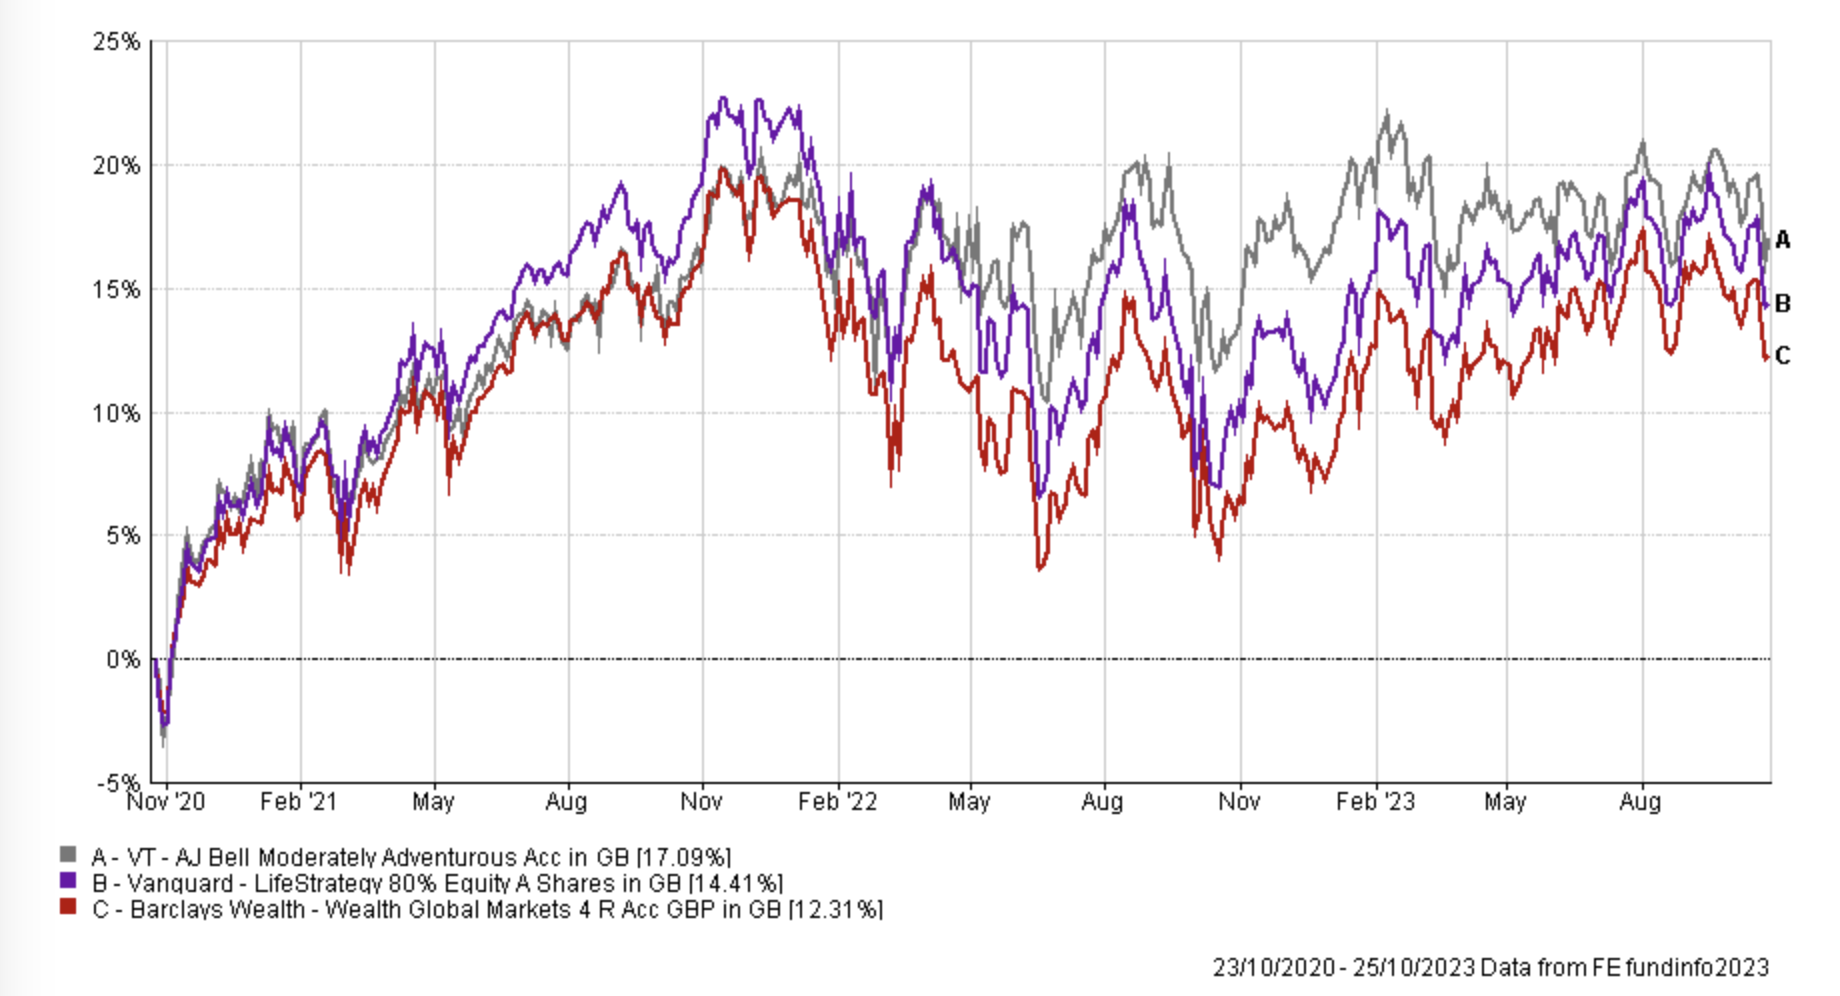
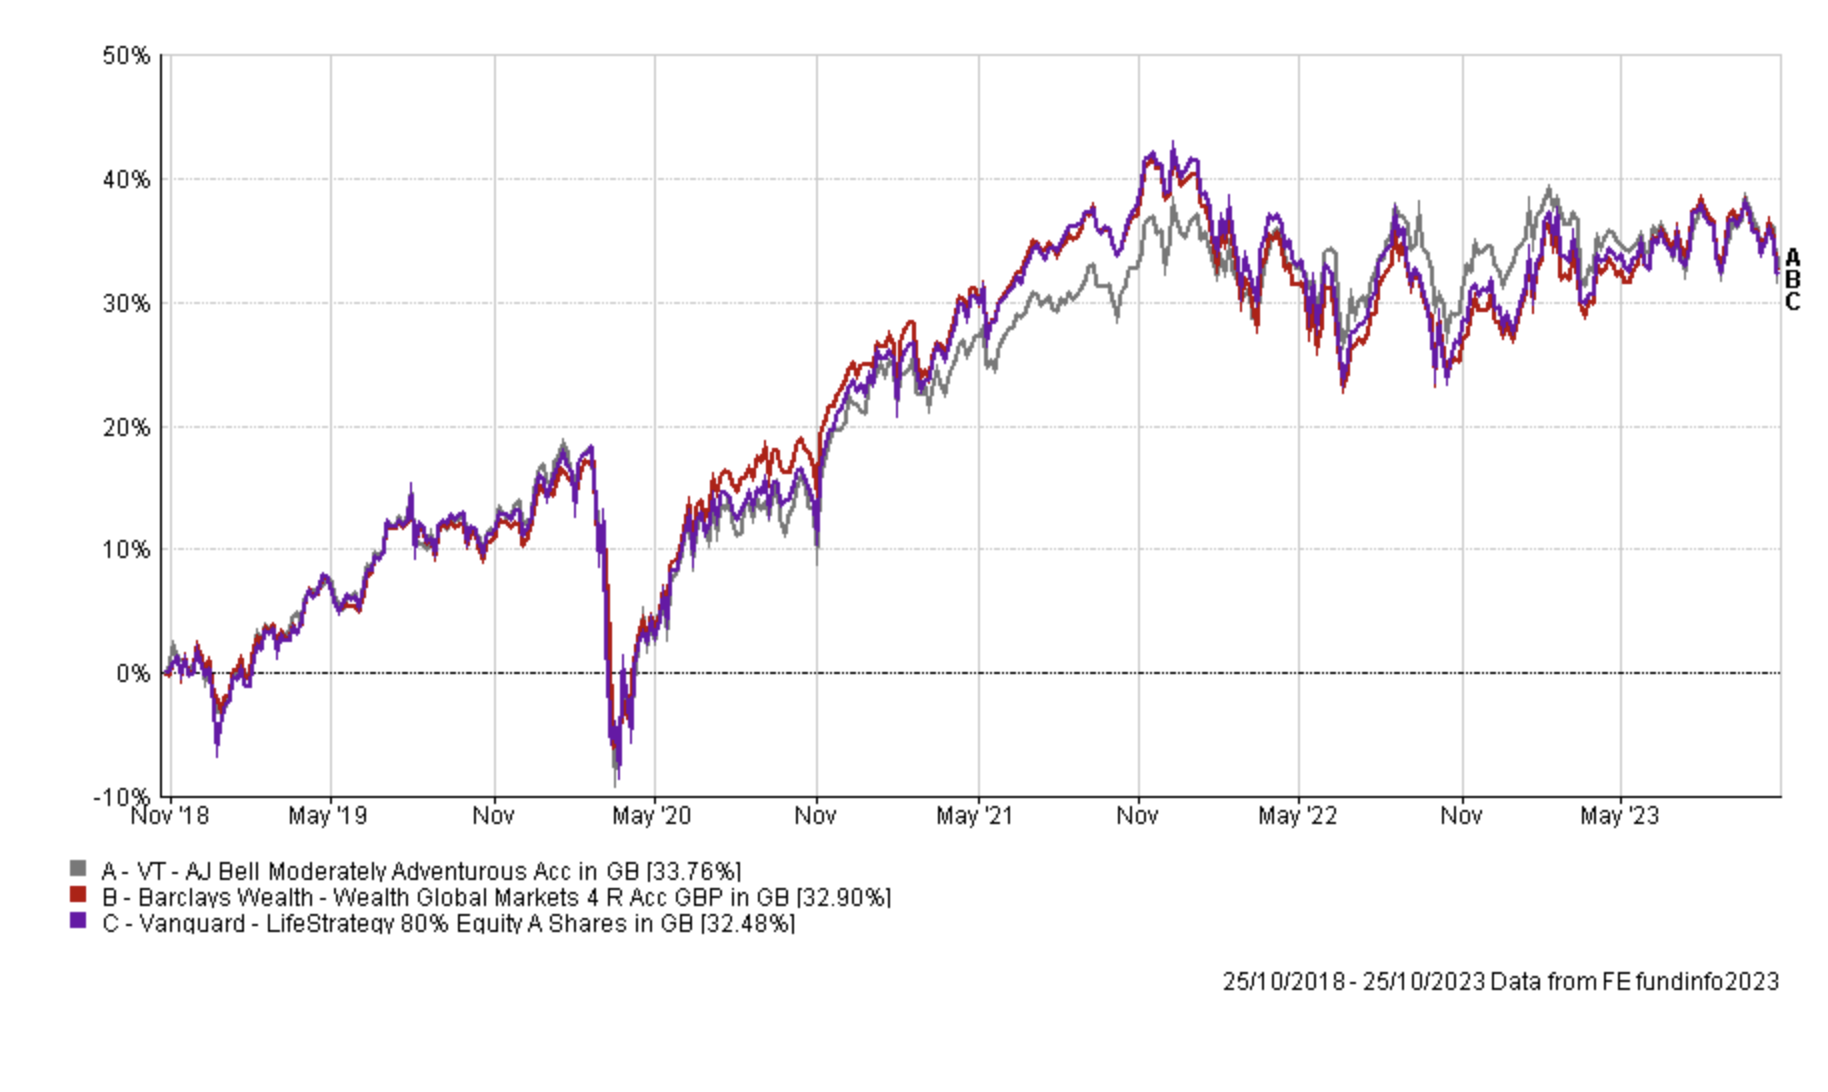
Build your own Vanguard Lifestrategy alternatives
Using the asset mix information above it is now possible to build your own Lifestrategy alternatives using a range of funds to reproduce the asset mix. For example to recreate the Vanguard Lifestrategy 60% Equity fund you would need a 30% exposure to US equities and 15% exposure to UK equities. Therefore a starting point would be to have a 30% exposure to US equity fund(s) and 15% to a UK equity fund(s) etc. In this way you could recreate the asset mix and therefore likely achieve a similar performance but using a range of funds from different fund management houses.

£200 Pension Cashback Offer
Make a qualifying deposit or transfer a pension to our partner Interactive Investor.
- Deposit or transfer a pension of at least £20k and you could earn £200 cashback
- Terms and Fees apply, Capital at risk
- New & Existing customers opening a SIPP
- Offer ends 31st July 2026
Before starting your transfer, check you won't lose any valuable benefits (such as guaranteed annuity rates or a lower protected pension age) and find out what exit fees you might have to pay
