

Periodically I review global stock markets to see which offer good value based on historical data. The last time I did this was almost a year ago in August 2023. Since then we've seen a divergence in fortunes for stock markets globally, largely the result of the market's anticipation of a divergence in monetary policy from global central banks.
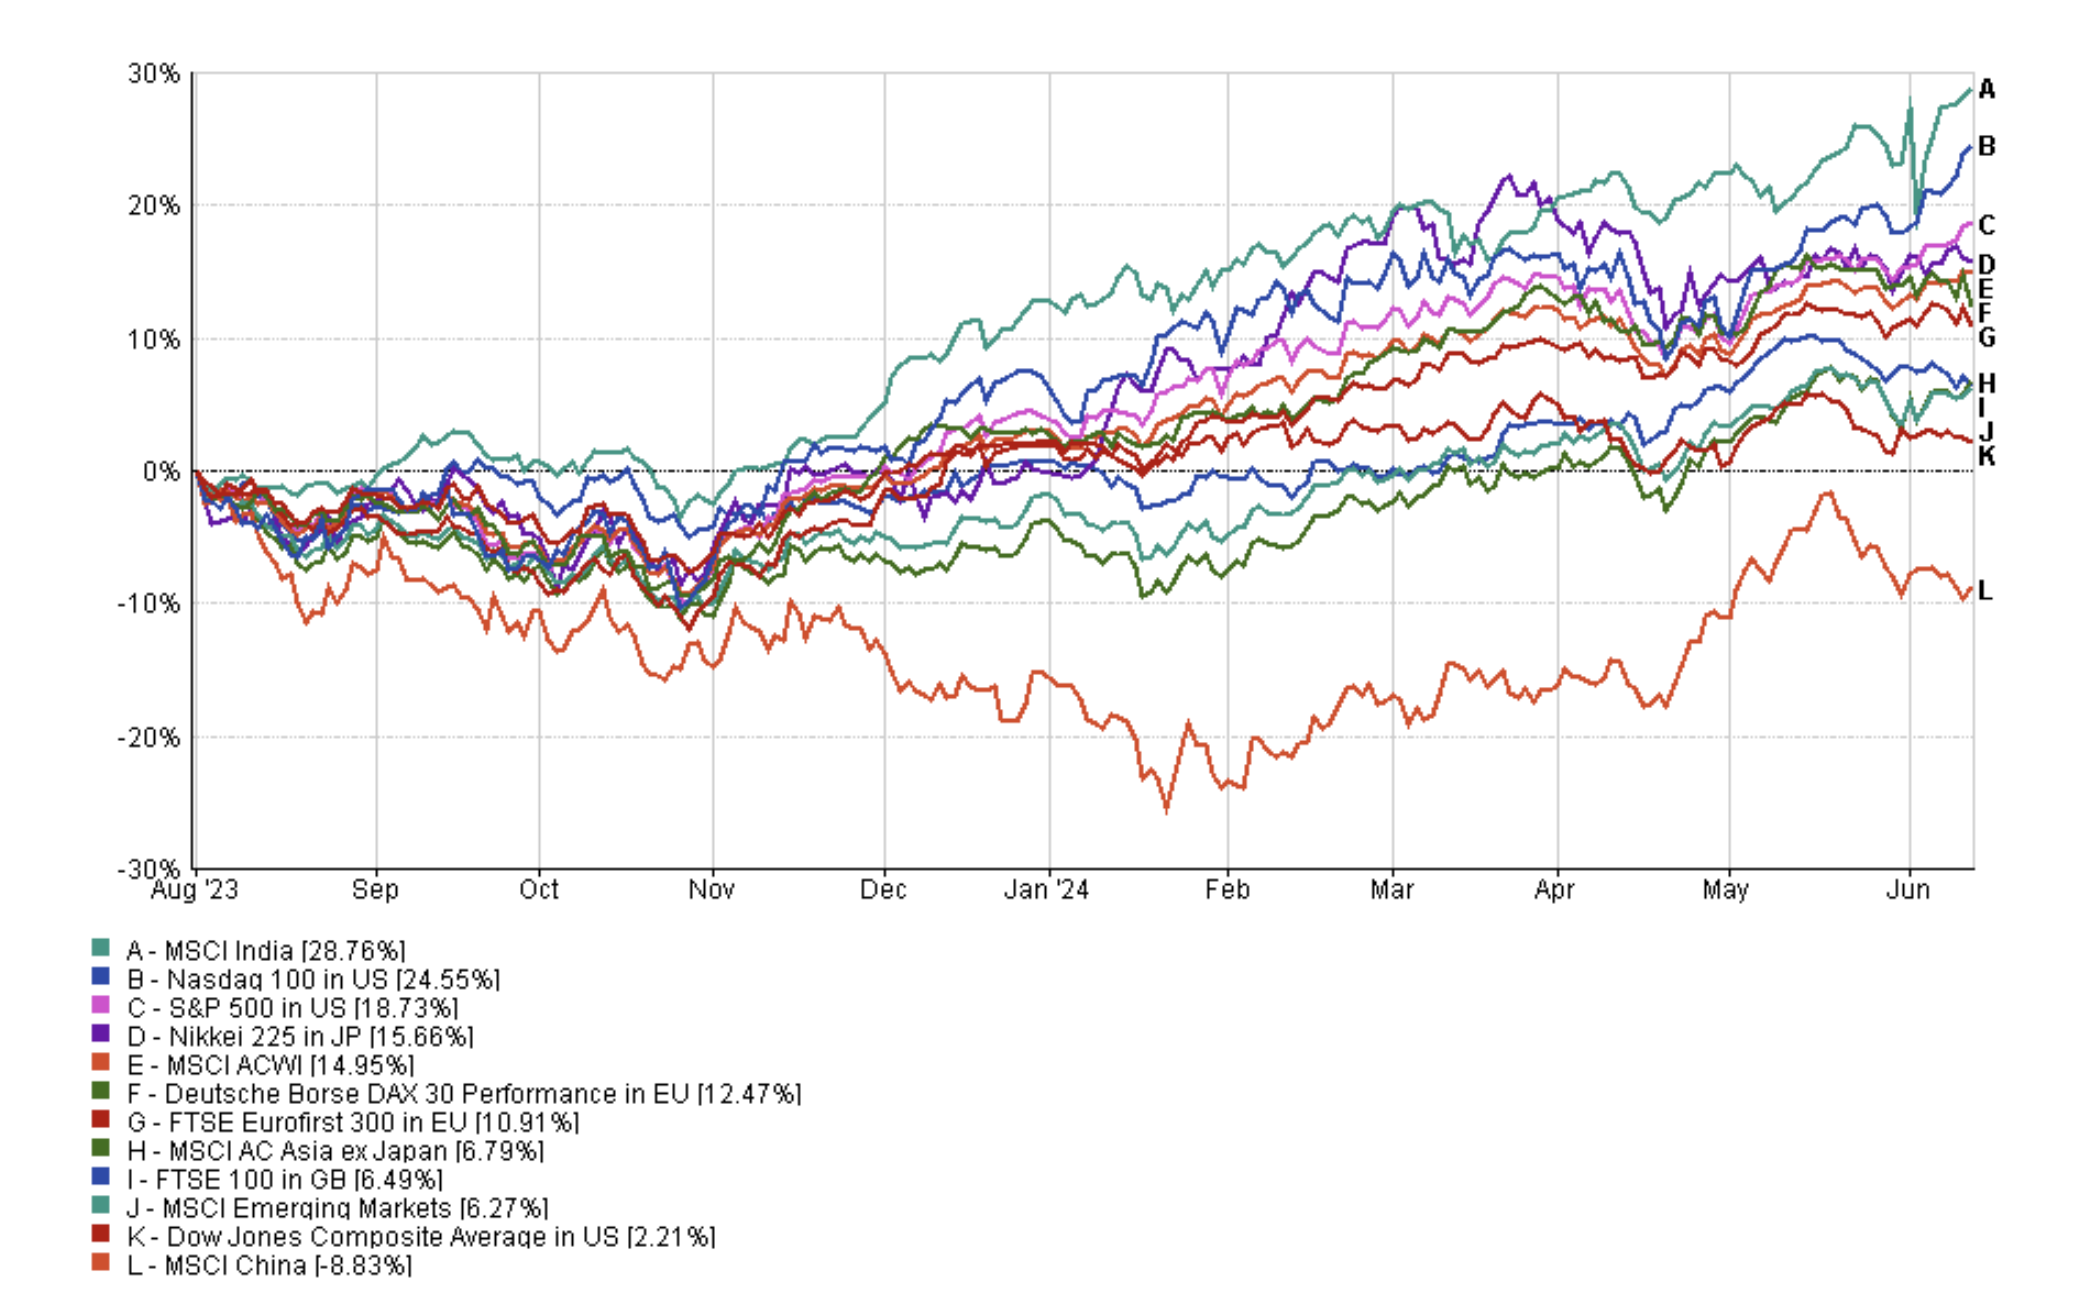
The chart below shows the performance of key stock markets since August 2023, with Indian equities and the tech-heavy Nasdaq 100 leading the way.
So how have the stock market moves affected stock market 'value' around the globe? In this article, I answer that question before going on to determine the value of individual equity sectors in the US. But first, let me recap on what value investing is.
What is 'value investing'
A value investor buys shares in companies that he/she believes are undervalued by the market on the assumption that when reality catches up with the company fundamentals the share price will be revalued and they will make a profit.
Finding value involves scrutinising company balance sheets and accounts looking for the value that others can’t see, the earning potential that your peers are overlooking. However, determining ‘value’ is subjective and can be hit and miss. The investment landscape is littered with investors who misread the ‘value’ signs and got it wrong. Sometimes things are cheap for a reason and get cheaper as a result. Even value investing gurus like Warren Buffet get it wrong sometimes.
The 80-20 Investor algorithm was developed based around momentum, yet ultimately encapsulates the positives of value investing. A value investor may have identified a fund previously, yet will be waiting for the market to catch on. When it finally does the share price will go up, climbing up the share performance tables. At this point 80-20 Investors will buy it and ride the wave upwards.
Yet, the biggest drawback of value investing is finding simple reliable information with which to determine 'value'.
The best measure of 'value'
There is a wide range of measures that can be used to help determine a company's value yet perhaps the most reliable measure, and the one I favour, is something called the Cyclically Adjusted Shiller P/E (or CAPE) for short.
It is a measure of value created by Nobel prize-winning economist Robert Shiller and received much attention when it effectively predicted the US stock market crash of the late 1990s.
In a nutshell, the CAPE measure looks at the price of a share compared to its earnings ability over the last 10 years. The bigger the number the more expensive (poor value) the share is while the lower the CAPE the cheaper (better value) the share is.
You can even use the CAPE for entire stock markets to get an overall measure of how expensive the market is, much like Shiller did before the stock market bubble burst in 2000. If a market is hugely expensive versus history then it could be a sign of an impending market correction. Similarly, if a market is cheap it could be a sign of better days ahead. It all hinges on the market reverting back and forth across a historic median. The CAPE is sometimes also used to predict future returns for stock markets based on history, although that has to be taken with a pinch of salt.
However, it's not just about how big or small the CAPE figure is but how it compares to the market's (or company's) long term median. So you can see although it is a relatively simple measure, getting hold of the information is difficult.
Yet you must bear in mind CAPE is not a crystal ball. Eight years ago the US stock market had a CAPE of 27.74, well above the long term average of 16.4. This made US shares eye-wateringly expensive and implied an expected annual return of less than zero over the next few years, or in other words to lose investors money. However, as we know the US stock market hit new all-time highs, eventually hitting a CAPE of 38.7 in October 2021. Therein lies the problem with value measures and is why I may only use CAPE to help guide my decisions, rather than being the sole basis upon which any decision is made.
The cheapest stock markets in the world
The table below summarises the CAPE values for stock markets around the world. The table is in alphabetical order. However, I have highlighted in green those markets that are cheaper than their historical median, while those that are more expensive are in red. I have also included the CAPE for each market as at June 2024 when I last reviewed the value of global stock markets. The "August 2023 CAPE" column is colour coded with reference to the Median CAPE value that was applicable back in August 2023. I have also included an inception date for each market which states the date from which data has been available. Clearly, the older the inception date the more robust the analysis is, which has always been a snag when using CAPE for emerging markets where historical data is limited.
| Market | Current CAPE | August 2023 CAPE | Median CAPE | Inception Date |
| Australia | 17.4 | 17.6 | 16.7 | 1969 |
| Brazil | 9.8 | 12.6 | 13.9 | 1994 |
| Canada | 20.4 | 19.6 | 19.6 | 1969 |
| China | 10.2 | 11.1 | 15.1 | 1995 |
| France | 23.2 | 23.7 | 19.7 | 1971 |
| Germany | 15.9 | 14.7 | 17.4 | 1969 |
| India | 35 | 30.2 | 21.9 | 1994 |
| Indonesia | 15 | 17.3 | 19.2 | 1992 |
| Italy | 19.3 | 19.1 | 18.4 | 1984 |
| Japan | 23.8 | 21.2 | 32.5 | 1969 |
| Malaysia | 14.1 | 12.7 | 19.9 | 1992 |
| Mexico | 16.5 | 17.7 | 21.5 | 1992 |
| Poland | 9.8 | 8.5 | 11.2 | 1995 |
| South Africa | 13.5 | 15.3 | 18.1 | 1995 |
| South Korea | 12.5 | 12.7 | 14.2 | 1995 |
| Spain | 15.6 | 14.6 | 14.2 | 1980 |
| Sweden | 18.8 | 17.2 | 19.8 | 1969 |
| Switzerland | 22.4 | 22.5 | 21.5 | 1969 |
| Taiwan | 25.2 | 21.3 | 20.3 | 1995 |
| Thailand | 14.1 | 15.7 | 17.4 | 1992 |
| Turkey | 10.5 | 11.5 | 10.7 | 1992 |
| US | 34 | 31.6 | 16.5 | 1871 |
| UK | 14.9 | 13.2 | 14.7 | 1969 |
Regional Summaries
| Market | Current CAPE | August 2023 CAPE | Median CAPE |
| Emerging Markets | 15 | 14.6 | 15 |
| Europe | 18.7 | 17.6 | 16.9 |
| Global Developed | 28.9 | 26.5 | 23.9 |
Stock market value changes since August 2023
Below I highlight some of the key trends:
- Whilst most markets became more expensive in August 2023 vs August 2022, this year the picture is more mixed with 11 of the 23 stock markets becoming cheaper over the past year. The most notable falls were China, Indonesia, Mexico, Brazil, Thailand, Turkey and South Africa.
- US and India equities remain the most expensive markets based on their historical medians.
- The UK is the only market that has gone from cheap to expensive over the course of the last year.
- Chinese equities remain cheap by historical valuations despite their rally in the the first half of 2024
- Global Developed equites as a group have become ever more expensive relative to their historical valuations. Emerging markets still remain good value in comparison.
Value by equity sector
It is also possible to discern which individual equity sectors are deemed good value or expensive, which could be used when choosing individual funds or comparing performance. The table below shows the value of various sectors within the S&P 500 and obviously while the data is US-specific it is generally reflective of wider trends within global equity markets. Where the current CAPE is deemed cheap based on history it is coloured green. Where it is deemed expensive the current CAPE is coloured red.
Most S&P 500 sectors are more expensive this time around with the most notable being the Technology sector which is significantly more expensive than in August 2023. Technology stocks include the likes of Apple as well as AI plays such as Microsoft and Nvidia which have rallied strongly in 2024. In contrast, Financial Services and Real Estate sectors continue to remain cheaper relative to their historical averages.
| S&P 500 Sector | Number of Stocks | Current CAPE | August 2023 CAPE | 10-year average CAPE |
| Basic Materials | 22 | 27.6 | 25.1 | 26.5 |
| Communication Services | 23 | 36.6 | 29.8 | 37.4 |
| Consumer Cyclical | 58 | 43.9 | 41.4 | 34.6 |
| Consumer Defensive | 37 | 25.7 | 24.8 | 23.7 |
| Energy | 23 | 29.5 | 29.3 | 19.4 |
| Financial Services | 67 | 17.3 | 15.1 | 20.1 |
| Healthcare | 66 | 30.7 | 29.7 | 30.1 |
| Industrials | 71 | 28.4 | 26.1 | 24.8 |
| Real Estate | 31 | 40 | 39.7 | 51.2 |
| S&P 500 | 500 | 34.1 | 30.5 | 20.3 |
| Technology | 75 | 56.8 | 41.3 | 32.5 |
| Utilities | 30 | 28.2 | 25.4 | 25.7 |
All performance figures are net of fund charges. The material in any email, the MoneytotheMasses.com website, associated pages / channels / accounts and any other correspondence are for general information only and do not constitute investment, tax, legal or other form of advice. You should not rely on this information to make (or refrain from making) any decisions. Always obtain independent, professional advice for your own particular situation. See full Terms & Conditions and Privacy Policy
Neither MoneytotheMasses.com/80-20 Investor nor its content providers are responsible for any damages or losses arising from any use of this information. Past performance is no guarantee of future results.
Funds invest in shares, bonds, and other financial instruments and are by their nature speculative and can be volatile. You should never invest more than you can safely afford to lose. The value of your investment can go down as well as up so you may get back less than you originally invested.
Information provided by MoneytotheMasses.com/80-20 Investor is for general information only and not intended to be relied upon by readers in making (or not making) specific investment decisions.
Appropriate independent advice should be obtained before making any such decisions. Leadenhall Learning (owner of MoneytotheMasses.com/80-20 Investor) and its staff do not accept liability for any loss suffered by readers as a result of any such decisions.
The tables and graphs are derived from data supplied by Trustnet. All rights Reserved.

£200 Pension Cashback Offer
Make a qualifying deposit or transfer a pension to our partner Interactive Investor.
- Deposit or transfer a pension of at least £20k and you could earn £200 cashback
- Terms and Fees apply, Capital at risk
- New & Existing customers opening a SIPP
- Offer ends 31st July 2026
Before starting your transfer, check you won't lose any valuable benefits (such as guaranteed annuity rates or a lower protected pension age) and find out what exit fees you might have to pay
