

Back in 2019 I carried out a piece of research to help shed light on the conundrum of how often you should make changes to your portfolio. Should you make changes every month, every 3 months, every 6 months or even once a year for the optimum portfolio performance?
You can read the full research piece here as well as its findings - "The lazy 80-20 Investor – how often should you change funds?"
To tackle the question I created a monthly, a three-monthly, a six-monthly and an annual portfolio. The names reflect the frequency with which I changed funds within them to reflect those held within the BOTB at a given moment in time. The research found that...
- the more frequently you reviewed/changed your portfolio the more it boosted returns
- however, there was clearly a law of diminishing returns in doing so. In fact, the performance of the monthly portfolio versus the three-monthly portfolio was basically identical.
... or in other words the research suggested it was ok to take a more 'lazy' approach to portfolio changes. Long-time 80-20 Investor members will know I have since reflected this approach during my own portfolio reviews. While the reviews themselves may be published monthly I sometimes don't make any fund changes at all. If I do then I typically only change one or two funds at a time. It therefore means that funds remain in my portfolio for months (and sometimes even years) at a time.
So here we are, five years on from the original piece of research but do the findings still hold true? After all, we now have 10 years' worth of real-world data to look back on and analyse.
The lazy 80-20 Investor - 10 years in the field
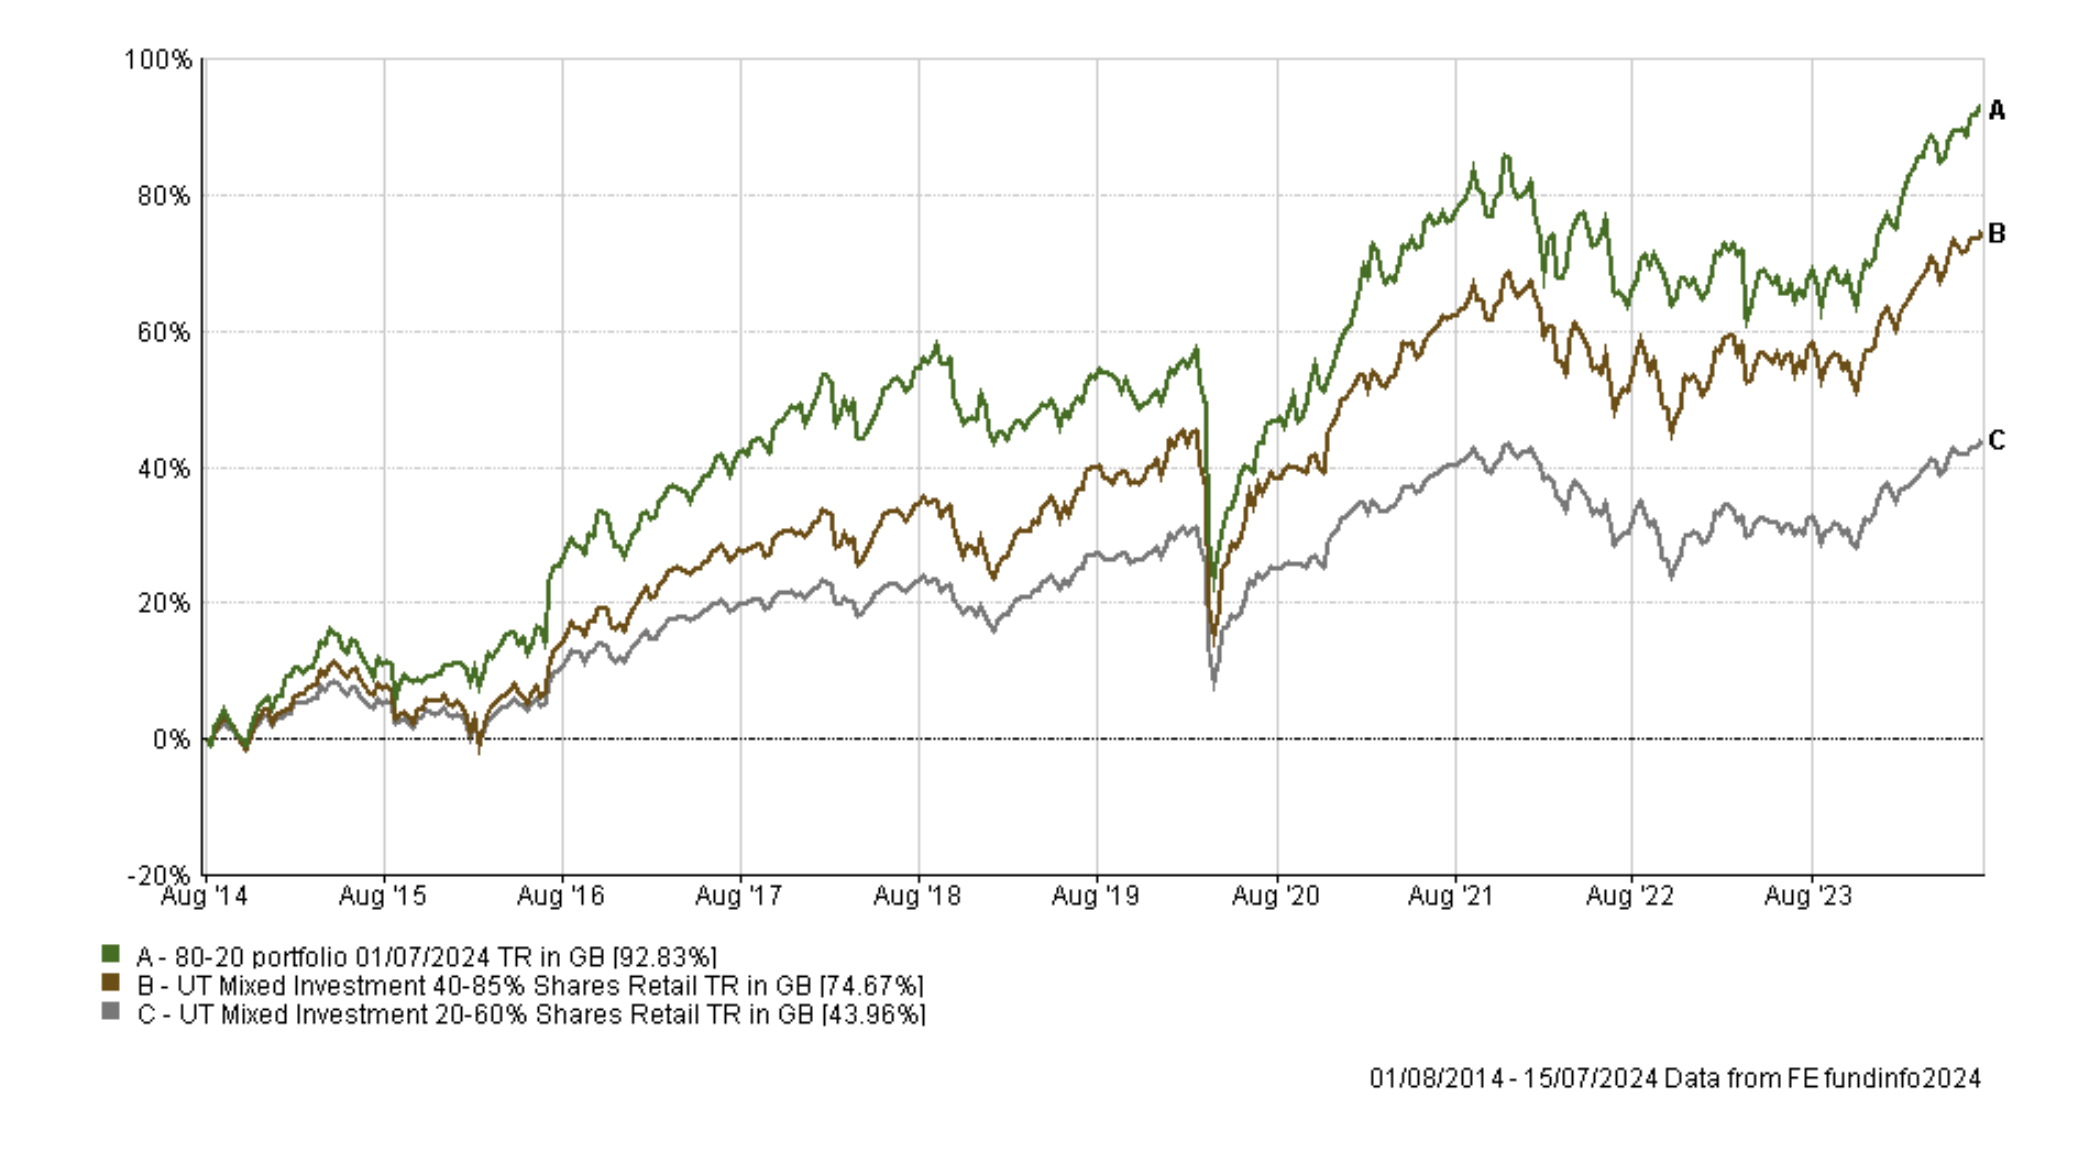
As stated above, this is an update to the original research carried out five years ago, so my methodology remains the same. The first ever BOTB selection was produced in August 2014, almost 10 years ago which means there have been almost 120 monthly updates. The chart below shows the indicative performance of the BOTB over that time (the green line). It is only indicative as it assumes that someone buys every fund within the BOTB each month and then switches every time a new BOTB is produced. The portfolio return is also compared to that of the average performance of funds within the two key professionally managed multi-asset sectors, just for comparison purposes and to highlight the outperformance.
The next step was to recreate what would have happened if the BOTB was updated just every three months (the blue line), every six months (the red line) and annually (the black line). Click on the chart below to enlarge it.
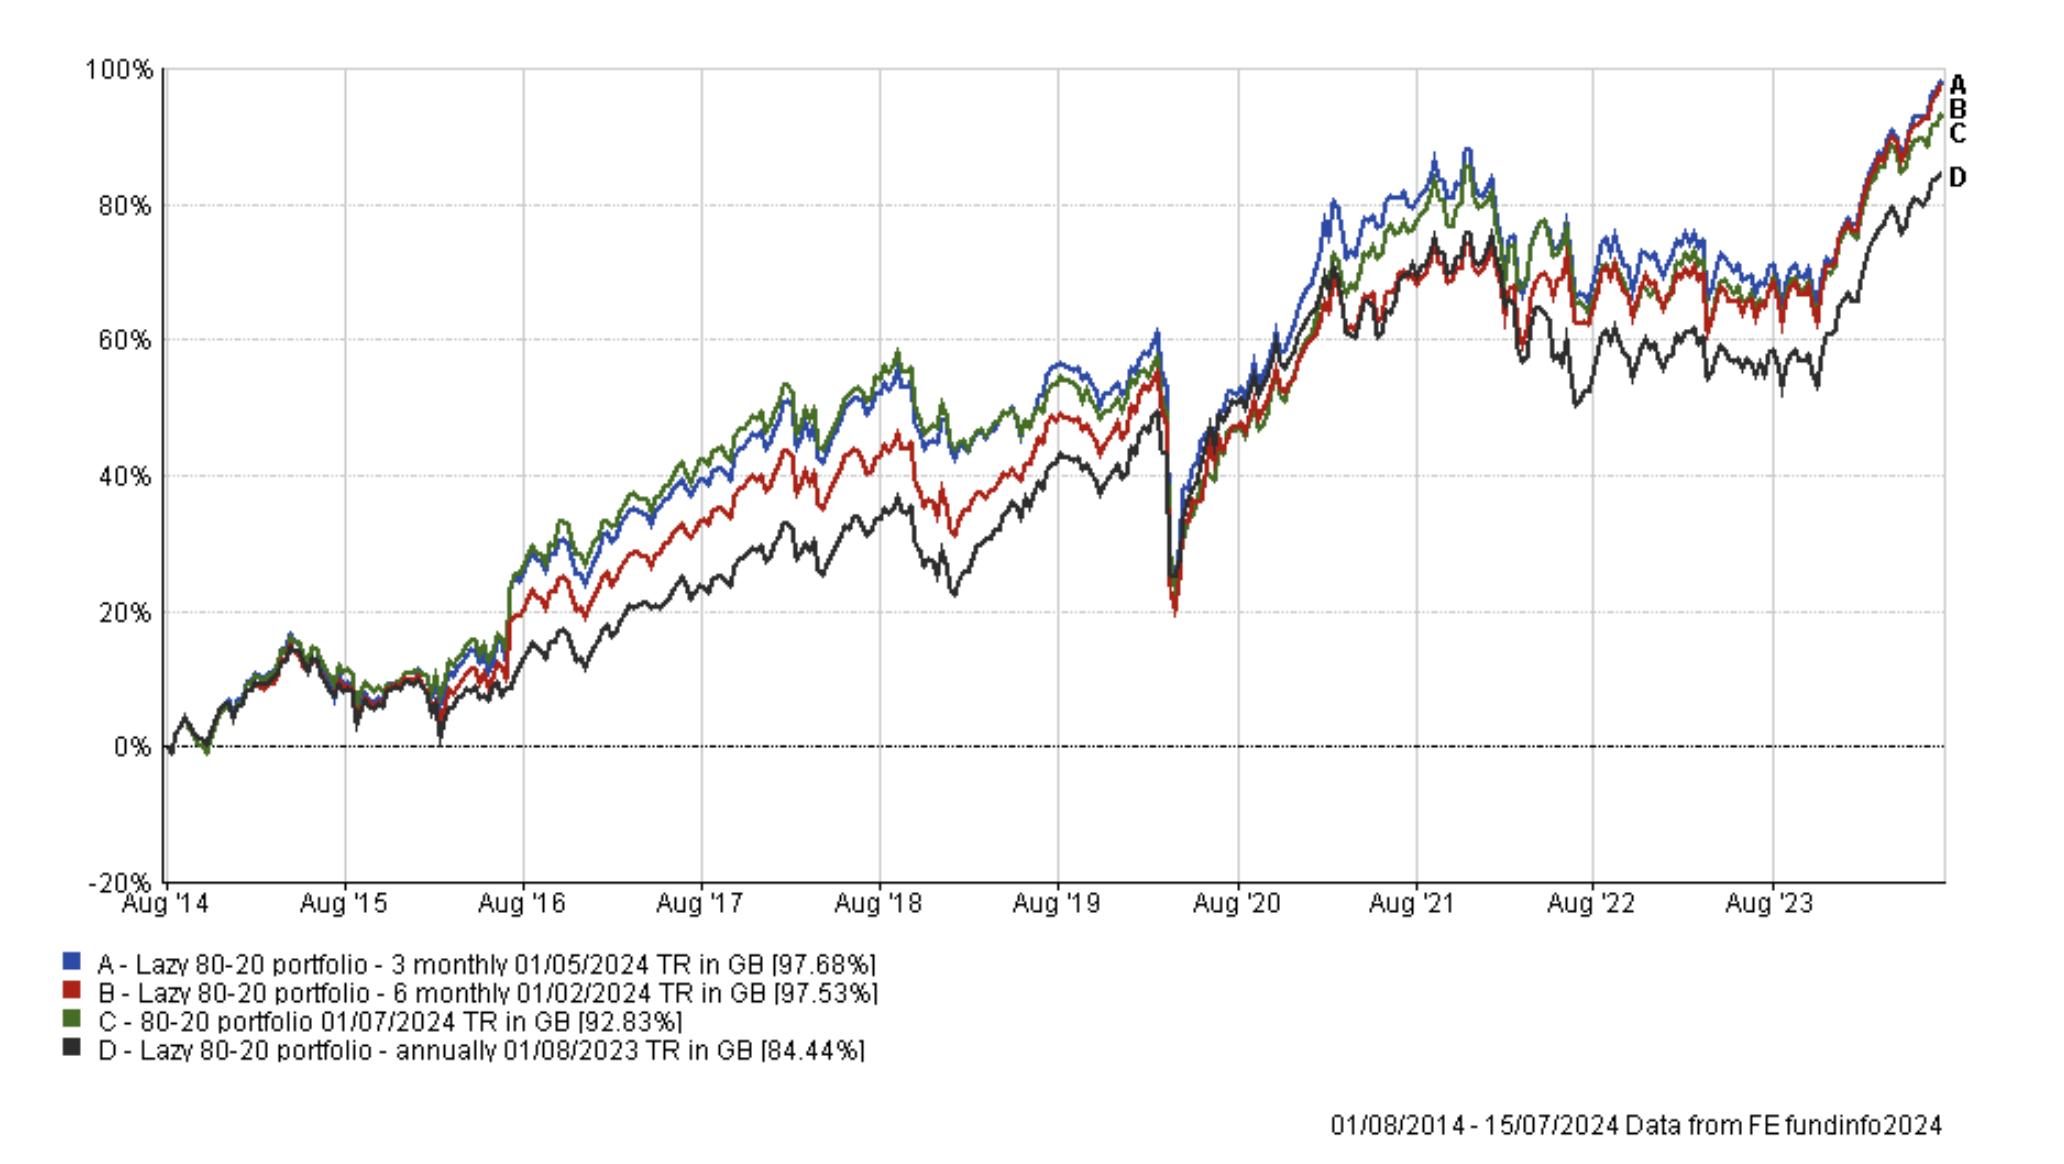
The outcome is interesting and is not the same as the original research. The result differs in that the monthly reviewed portfolio comes third rather than first. But if you look closely at the chart you can see that the monthly performance has only really started to lag the others since April 2024. Also, this time around there is essentially no real difference in the return for the 3-month portfolio versus the 6-month portfolio.
Long-term 80-20 Investor members should take comfort from this. When I first built the original 80-20 Investor algorithm the research that underpinned it allowed for funds to be held for up to 6 months at a time. The fact that this has been shown to work in the field over a 10 year period emphasises the robustness of the 80-20 Investor process.
Also, the result reinforces the fact that you don't have to make changes to your portfolio on a monthly basis in order to invest using momentum. The fact that there's not much difference between the portfolios' returns over a 10 year period (excluding the annual version) shows the robustness of the algorithm and the selection process behind 80-20 Investor. The algorithm contains a risk screen which reduces the volatility of the BOTB selection each month. It means that an element of consistency in performance is favoured which also goes a long way to explain the result above. The algorithm tries to identify consistently strong performers with momentum that can be held for up to six months at a time.
Of course, I have to acknowledge that the above chart focuses on just one period of 10 years with a specific start date and end date. The portfolios' performances varied throughout that time and the 3 month version wasn't necessarily the top performer at any given point. By way of example, the annual portfolio was the top-performing portfolio across the pandemic slump as shown below.
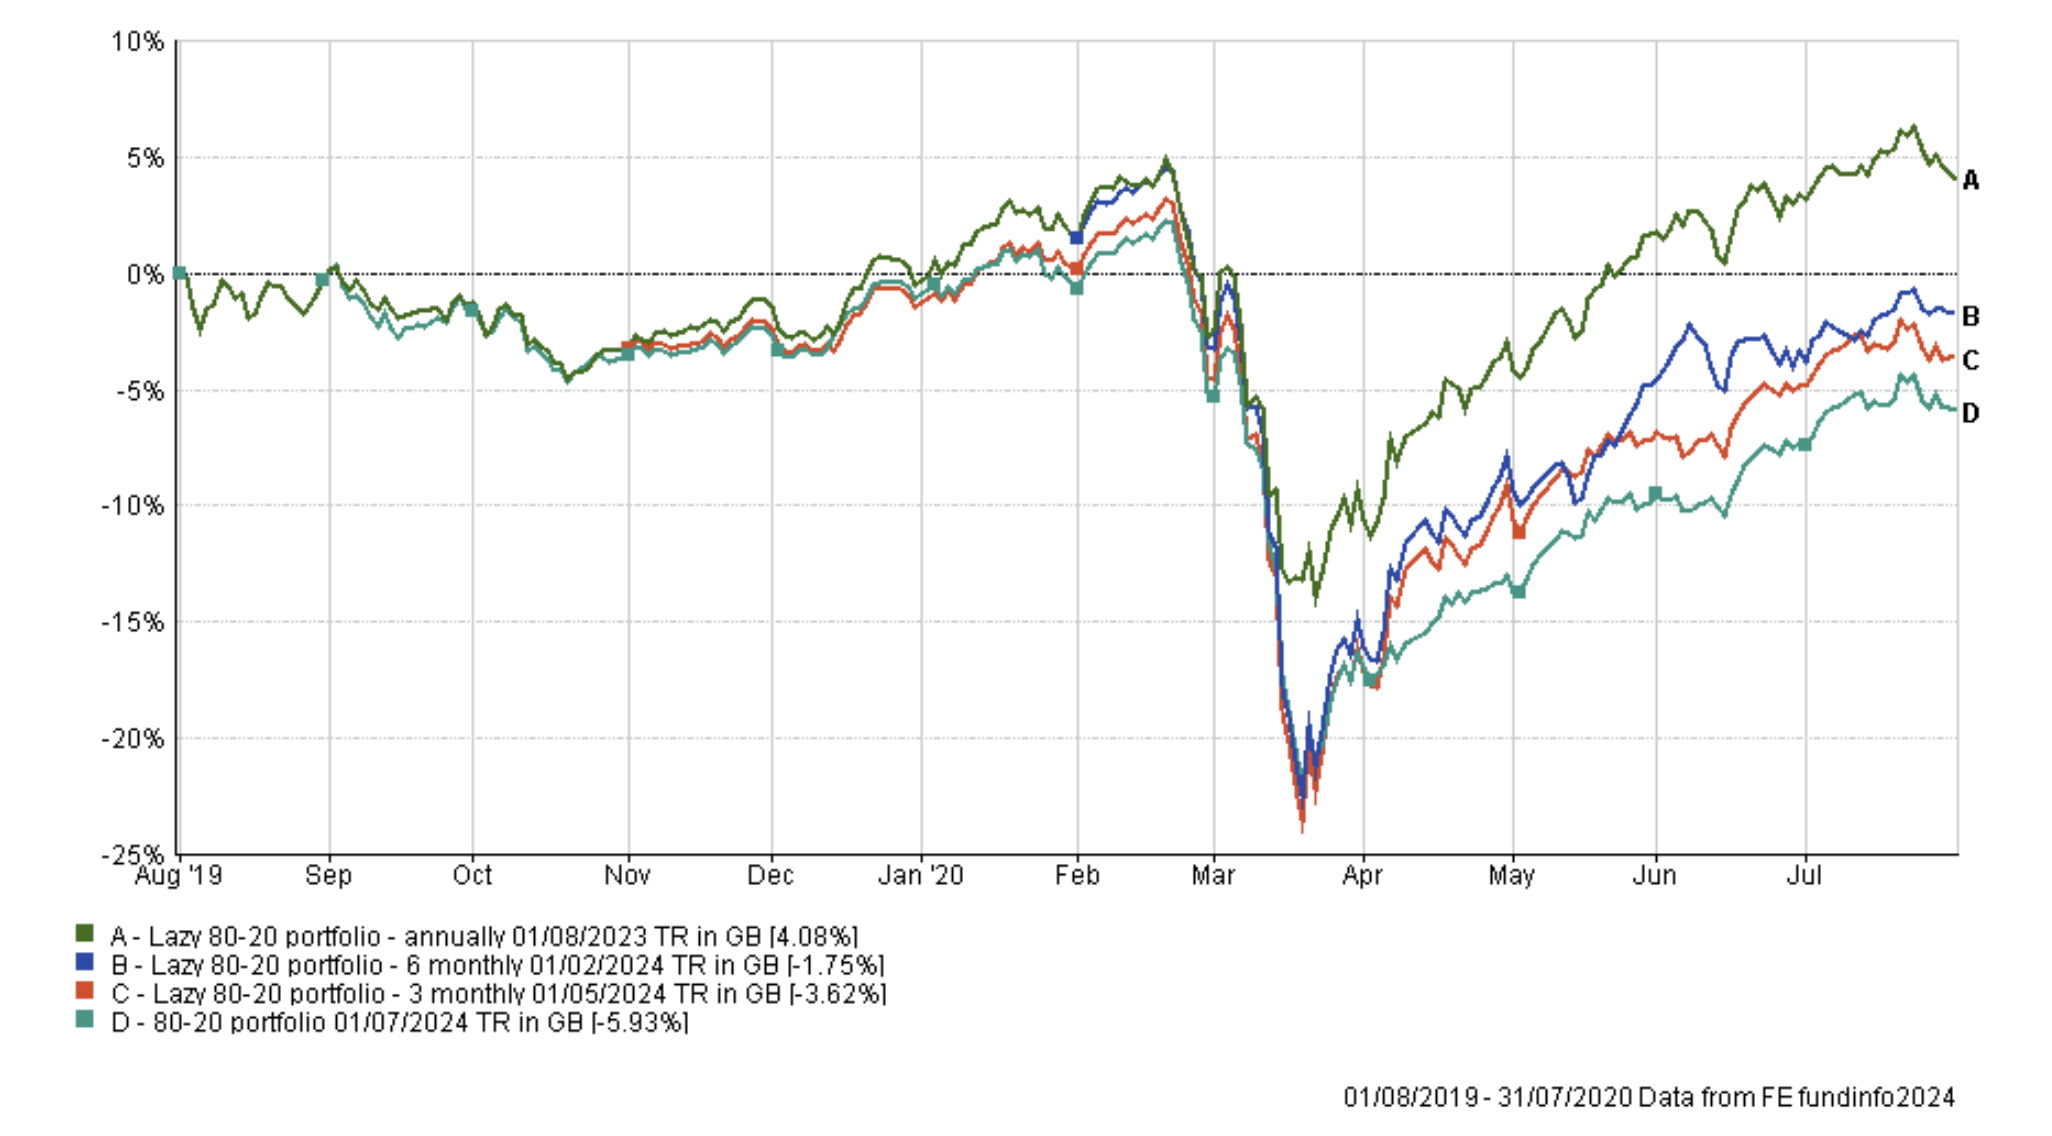
That's because the annual portfolio was still invested in defensive equity sectors and bonds following its update in 2019. Meanwhile, the more regularly reviewed portfolios had shifted towards more cyclical assets (those whose fortunes are more aligned with the health of the economy). When the pandemic effectively shut down entire economies, cyclical equity sectors crashed the most while defensive sectors fared better.
But despite this short period of outperformance across the pandemic the annual portfolio still underperformed across the full 10 year period. That's because the annual portfolio significantly underperformed the other portfolios during the Brexit referendum in 2016. In the immediate aftermath, the pound crashed against other major currencies which provided a performance boost for any funds that held overseas assets. Unfortunately for the annual portfolio, it was mostly invested in UK bonds and UK equity funds and so didn't benefit from the fall in sterling. Meanwhile, the more regularly reviewed portfolios had pivoted into global equities, especially in Europe and the US, prior to the vote and so benefited from the slump in the value of the pound .
The annual portfolio still hasn't fully recovered from that initial setback. The annual portfolio's performance across both of these historic events show that perhaps luck plays a more significant part in the performance of this portfolio than the more regularly reviewed portfolios. The latter are able to adapt to unfolding events more readily. This is especially true over shorter timeframes which is why the monthly portfolio was perhaps the top-performing portfolio in the first five years of existence.
For completeness, the table below shows the sharpe and alpha ratios for each of the portfolios. Interestingly the sharpe ratios have converged and are the same for the more regularly reviewed portfolios. Or in other words, the regularly reviewed portfolios are producing the same extra return for the risk that they are taking. The monthly portfolio does have the highest alpha figure which would suggest that the performance is more down to skill rather than luck, when compared to the other portfolios. Given my observation regarding the annual portfolio's performance over previous key market events then that does make sense.
| Portfolio | Alpha | Sharpe |
| 80-20 portfolio | 0.77 | 0.36 |
| Lazy 80-20 portfolio 3 monthly | 0.44 | 0.36 |
| Lazy 80-20 portfolio 6 monthly | 0.51 | 0.36 |
| Lazy 80-20 portfolio annually | 0.51 | 0.31 |
So overall, it is pleasing to see that over the last 10 years the 80-20 Investor process has worked 'in the field'. The results once again justify the light touch approach that was part of the original design, which I also champion in my own £50k portfolio. Typically, funds are held for at least 3 months in my portfolio (sometimes as long as 18 months) as I prefer to prune and weed rather than overhaul. The message is, that it is ok to take a more lazy approach even when applying momentum to your investments, even over the long-term.

£200 Pension Cashback Offer
Make a qualifying deposit or transfer a pension to our partner Interactive Investor.
- Deposit or transfer a pension of at least £20k and you could earn £200 cashback
- Terms and Fees apply, Capital at risk
- New & Existing customers opening a SIPP
- Offer ends 31st July 2026
Before starting your transfer, check you won't lose any valuable benefits (such as guaranteed annuity rates or a lower protected pension age) and find out what exit fees you might have to pay
