

Long-term 80-20 Investor members may remember that nine years ago I embarked on a research endeavour to find the Perfect ISA Portfolio.
In simple terms, I was trying to work out the Perfect ISA Portfolio asset mix (or whether one even existed) that met all the following criteria:
- There would be no constraint over which assets could be included or in what proportions they could be held
- The portfolio must have made money every tax year since the market peak back in 2000
- and not lost money
- It had to at least beat a FTSE 100 Index tracker over the entire time period and
- The asset allocation had to remain constant throughout that time (with annual rebalancing to ensure this)
So, in essence, I wanted to find the perfect 'buy and forget' asset allocation.
Just to recap...
The portfolio had to achieve the above aims irrespective of the actual funds you'd bought. So to make sure I was only looking at the asset allocation I always used the sector average return for each asset type. The original analysis covered 27 sectors covering a range of asset types (see the original article for the full list).
The number of possible combinations was mind-blowing but eventually one stood out. The Perfect ISA portfolio is split as follows:
- 9% cash
- 71% UK Gilts
- 20% UK Equity Income
Since that time I have revisited the Perfect ISA Portfolio each year to see how it has fared in the real world. While the aim of the original research piece was to determine a 'Perfect' asset allocation based on the above rules it was also to determine whether one even existed and to educate 80-20 Investor members on how to go about finding one. One of my aims with 80-20 Investor has always been to spark an inquisitive nature in members and show them how to carry out their own research. It is all about building a hypothesis, working out the best way to test it and then analysing the results. It may well be that you reach a final conclusion. Sometimes it may be that you don't. That is part of the fun and it may surprise you that some of my 80-20 Investor research never sees the light of day because I can't support the hypothesis.
Also some research never ends, such as the Perfect ISA Portfolio because it is constantly being tested in the field every year.
How has the Perfect ISA Portfolio fared since April 2021?
The last time I carried out an annual review of the Perfect ISA portfolio was towards the end of the 2021/22 tax year (i.e. two years ago). At that stage the Perfect ISA Portfolio was on the verge of losing its "Perfect" record of making money in every tax year since the market peak back in 2000. The updated table below summarises the returns of the portfolio since 2000:
| Tax Year (the starting year) | FTSE 100 return % |
Perfect ISA Portfolio return %
|
| 2000 | -11.13 | 3.26 |
| 2001 | -4.11 | 0.33 |
| 2002 | -24.52 | 0.51 |
| 2003 | 21.30 | 5.56 |
| 2004 | 14.46 | 6.65 |
| 2005 | 26.34 | 10.43 |
| 2006 | 9.37 | 2.17 |
| 2007 | -3.63 | 1.86 |
| 2008 | -29.94 | 0.59 |
| 2009 | 50.49 | 8.43 |
| 2010 | 7.95 | 4.67 |
| 2011 | -1.74 | 9.84 |
| 2012 | 13.44 | 7.31 |
| 2013 | 11.04 | 0.60 |
| 2014 | 5.73 | 10.96 |
| 2015 | -6.35 | 0.99 |
| 2016 | 23.44 | 7.77 |
| 2017 | 2.26 | 0.03 |
| 2018 | 8.27 | 2.78 |
| 2019 | -21.84 | 2.91 |
| 2020 | 26.30 | 2.54 |
| 2021 | 15.28 | -2.25 |
| 2022 | 5.95 | -10.18 |
As you can see, as inflation started to bite globally, interest rates began to rise which hammered long duration assets such as gilts, which are the core holding within the Perfect ISA Portfolio. As such, the performance of the average gilt fund dragged down the overall performance of the portfolio in 2022 and 2023. In 2022 the average UK gilt fund fell -14.78% while the average UK equity income fund fell -0.32%. As 80-20 Investor members know from reading the research and newsletters over the last few years, 2022 and 2023 were terrible years for bond investors. 2022 alone saw the worst year for bond returns in more than a century. My own £50k portfolio outperformed its benchmarks because it was underweight in bonds and had no exposure to gilts.
But before I declare the death of the Perfect ISA portfolio, how is the Perfect ISA Portfolio faring so far in this tax year?
How has the Perfect ISA Portfolio fared so far in the 2023/24 tax year
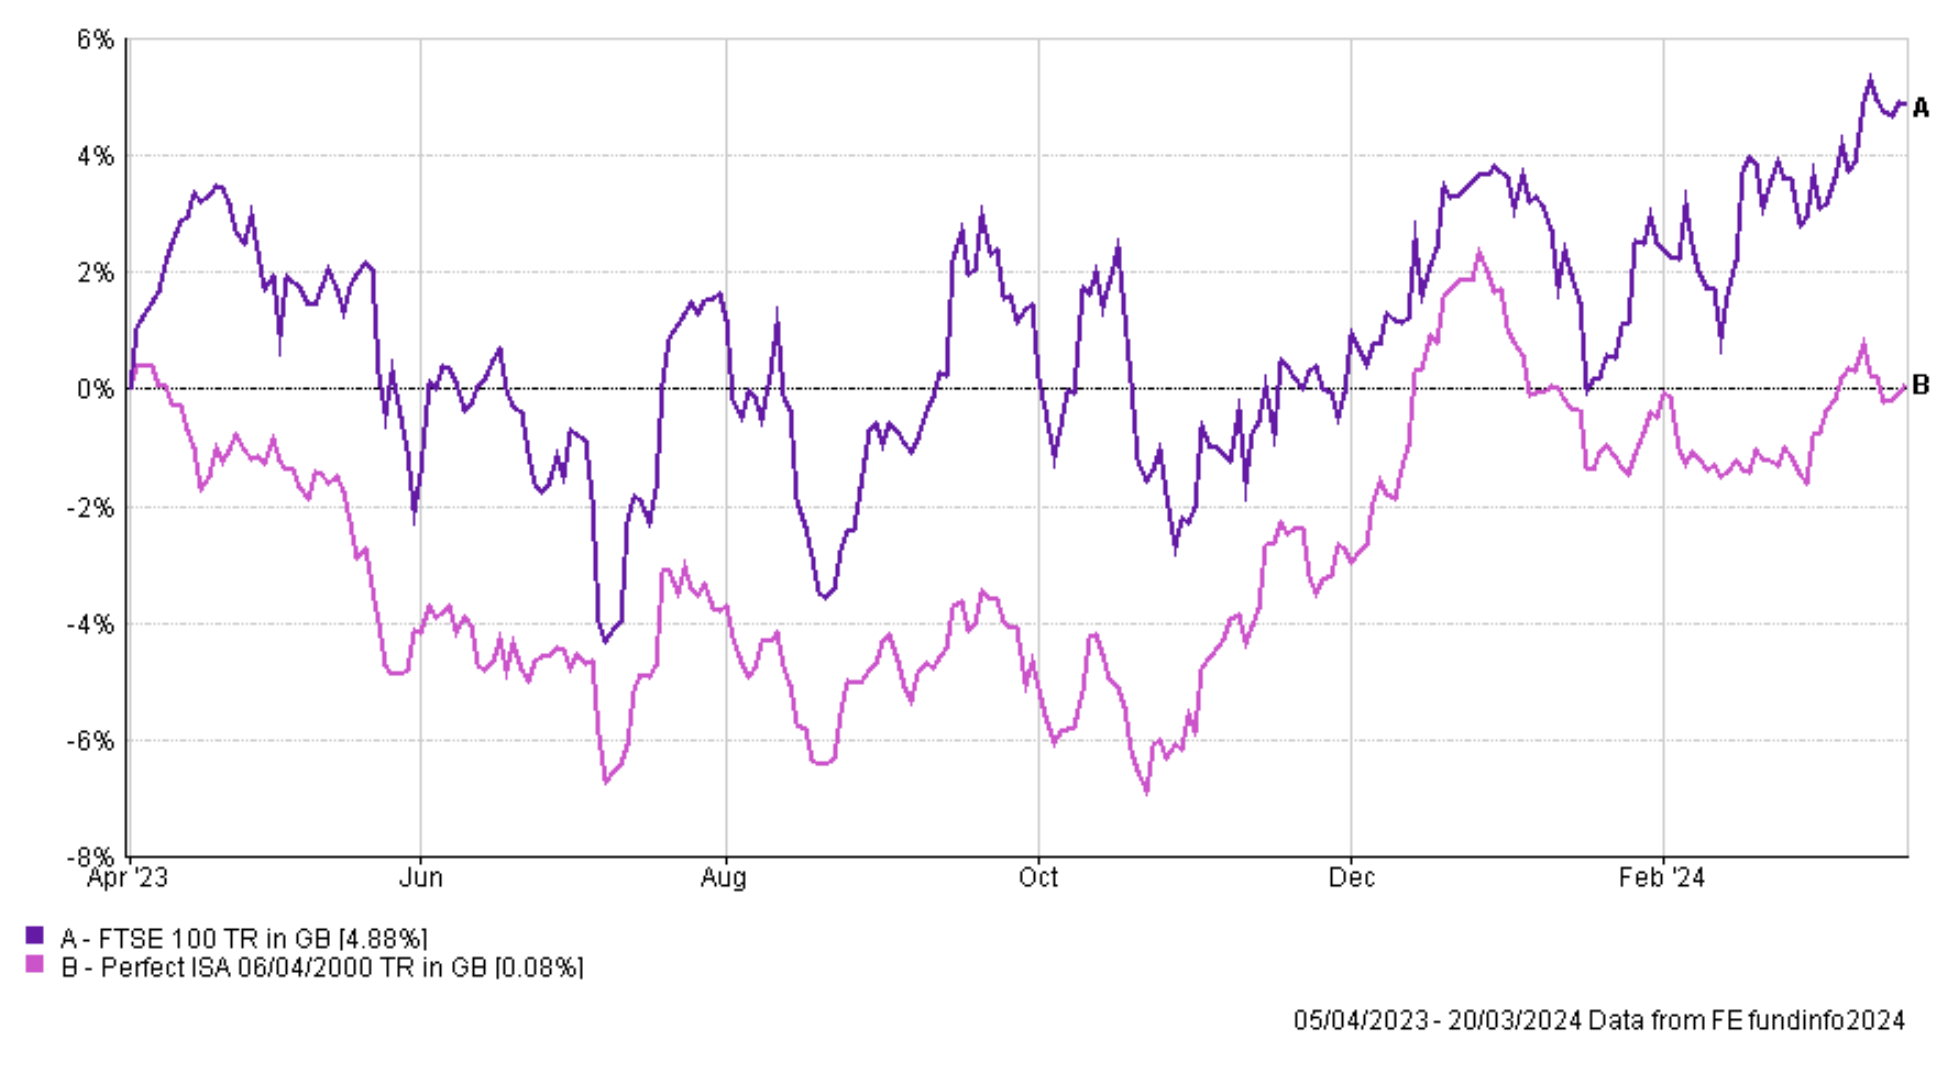
The chart below shows how the Perfect ISA Portfolio (the pink line) is faring so far this tax year versus the FTSE 100 (in purple). You can see that as bond markets have rebounded so too has the Perfect ISA Portfolio and it is now sitting in positive territory heading into the final days of the tax year. So is this a comeback for the Perfect ISA Portfolio?
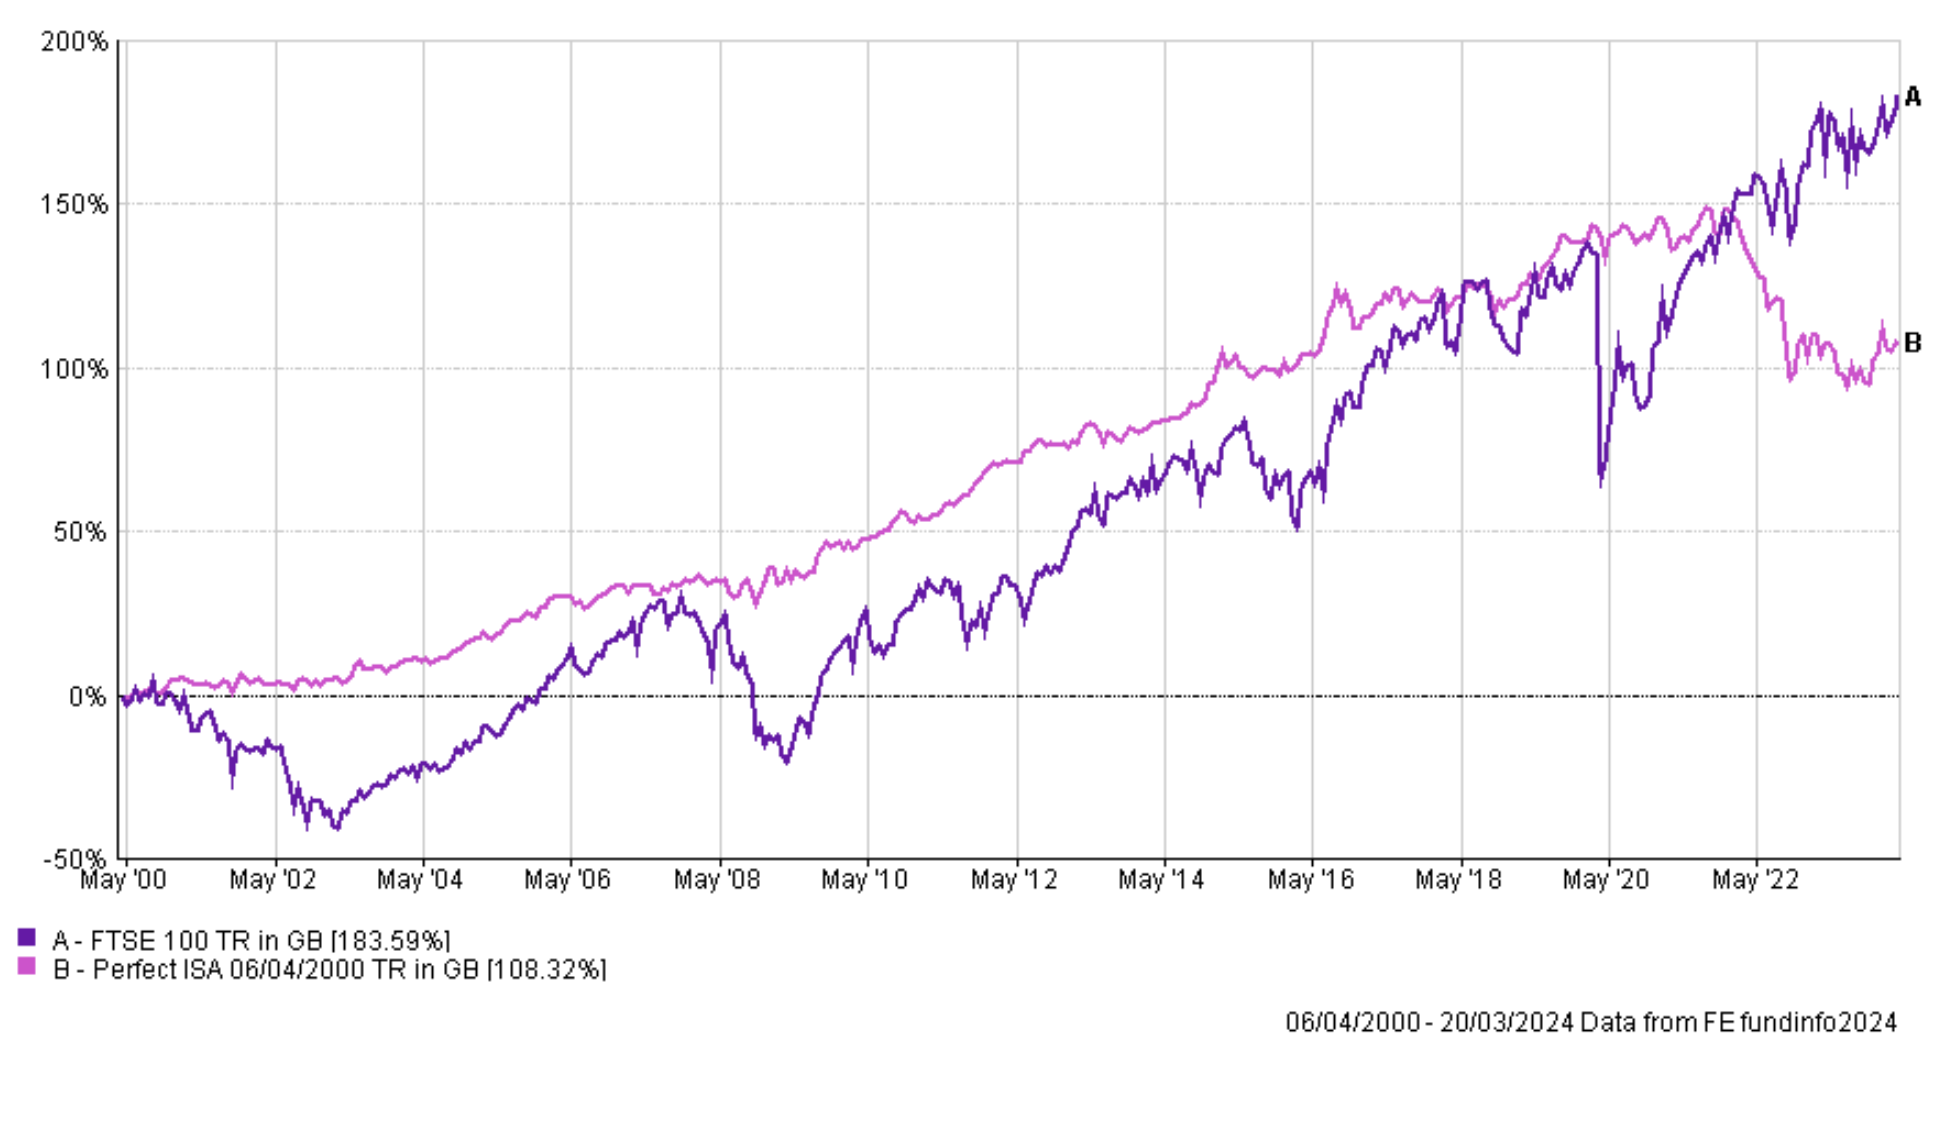
The chart below shows the performance of the Perfect ISA portfolio since 2000 and you can see that it now lags well behind the FTSE 100.
So, whether we are seeing a resurgence or not in the current tax year doesn't really matter. Given the strict criteria that the Perfect ISA Portfolio has failed to meet, the party is over. Of course I could just move the goal posts by perhaps removing the benchmark of the FTSE 100, or the static nature of the asset mix or the need to have never lost money in a given tax year. However, I'd rather see how far we can push the concept by revisiting and expanding the original analysis. Perhaps there is a better asset mix that could more closely achieve the original portfolio goals?
The original research included 27 asset classes and I have now expanded this to 35, with the most notable addition being gold. Here is a full list of the different asset classes/unit trust sectors that I have now analysed.
- Asia Pacific Excluding Japan
- China/Greater China
- Commodity/Natural Resources
- Europe Excluding UK
- European Smaller Companies
- Financials and Financial Innovation
- Flexible Investment
- Global Bonds
- Global EM Bonds Blended
- Global EM Bonds Hard Currency
- Global Emerging Markets
- Global Equity Income
- Global
- Healthcare
- Infrastructure
- Japan
- Latin America
- Mixed Investment 0-35% Shares
- Mixed Investment 20-60% Shares
- Mixed Investment 40-85% Shares
- North America
- North American Smaller Companies
- Property Other
- Sterling Corporate Bond
- Sterling High Yield
- Sterling Strategic Bond
- Technology & Technology Innovation
- UK All Companies
- UK Direct Property
- UK Equity Income
- UK Gilts
- UK Index Linked Gilts
- UK Smaller Companies
- Cash
- Gold
Interestingly, in my last Perfect ISA Portfolio review I explored building a Perfect Portfolio with gold in it, which I called the Perfect Gold Portfolio. Of course in 2022, gold performed strongly and so helped propel this new portfolio higher. The only difference between the Perfect Gold Portfolio and the original version is that instead of cash you invest in gold.
So the Perfect Gold Portfolio has an asset mix that looks like this:
- 9% gold
- 71% UK Gilts
- 20% UK Equity Income
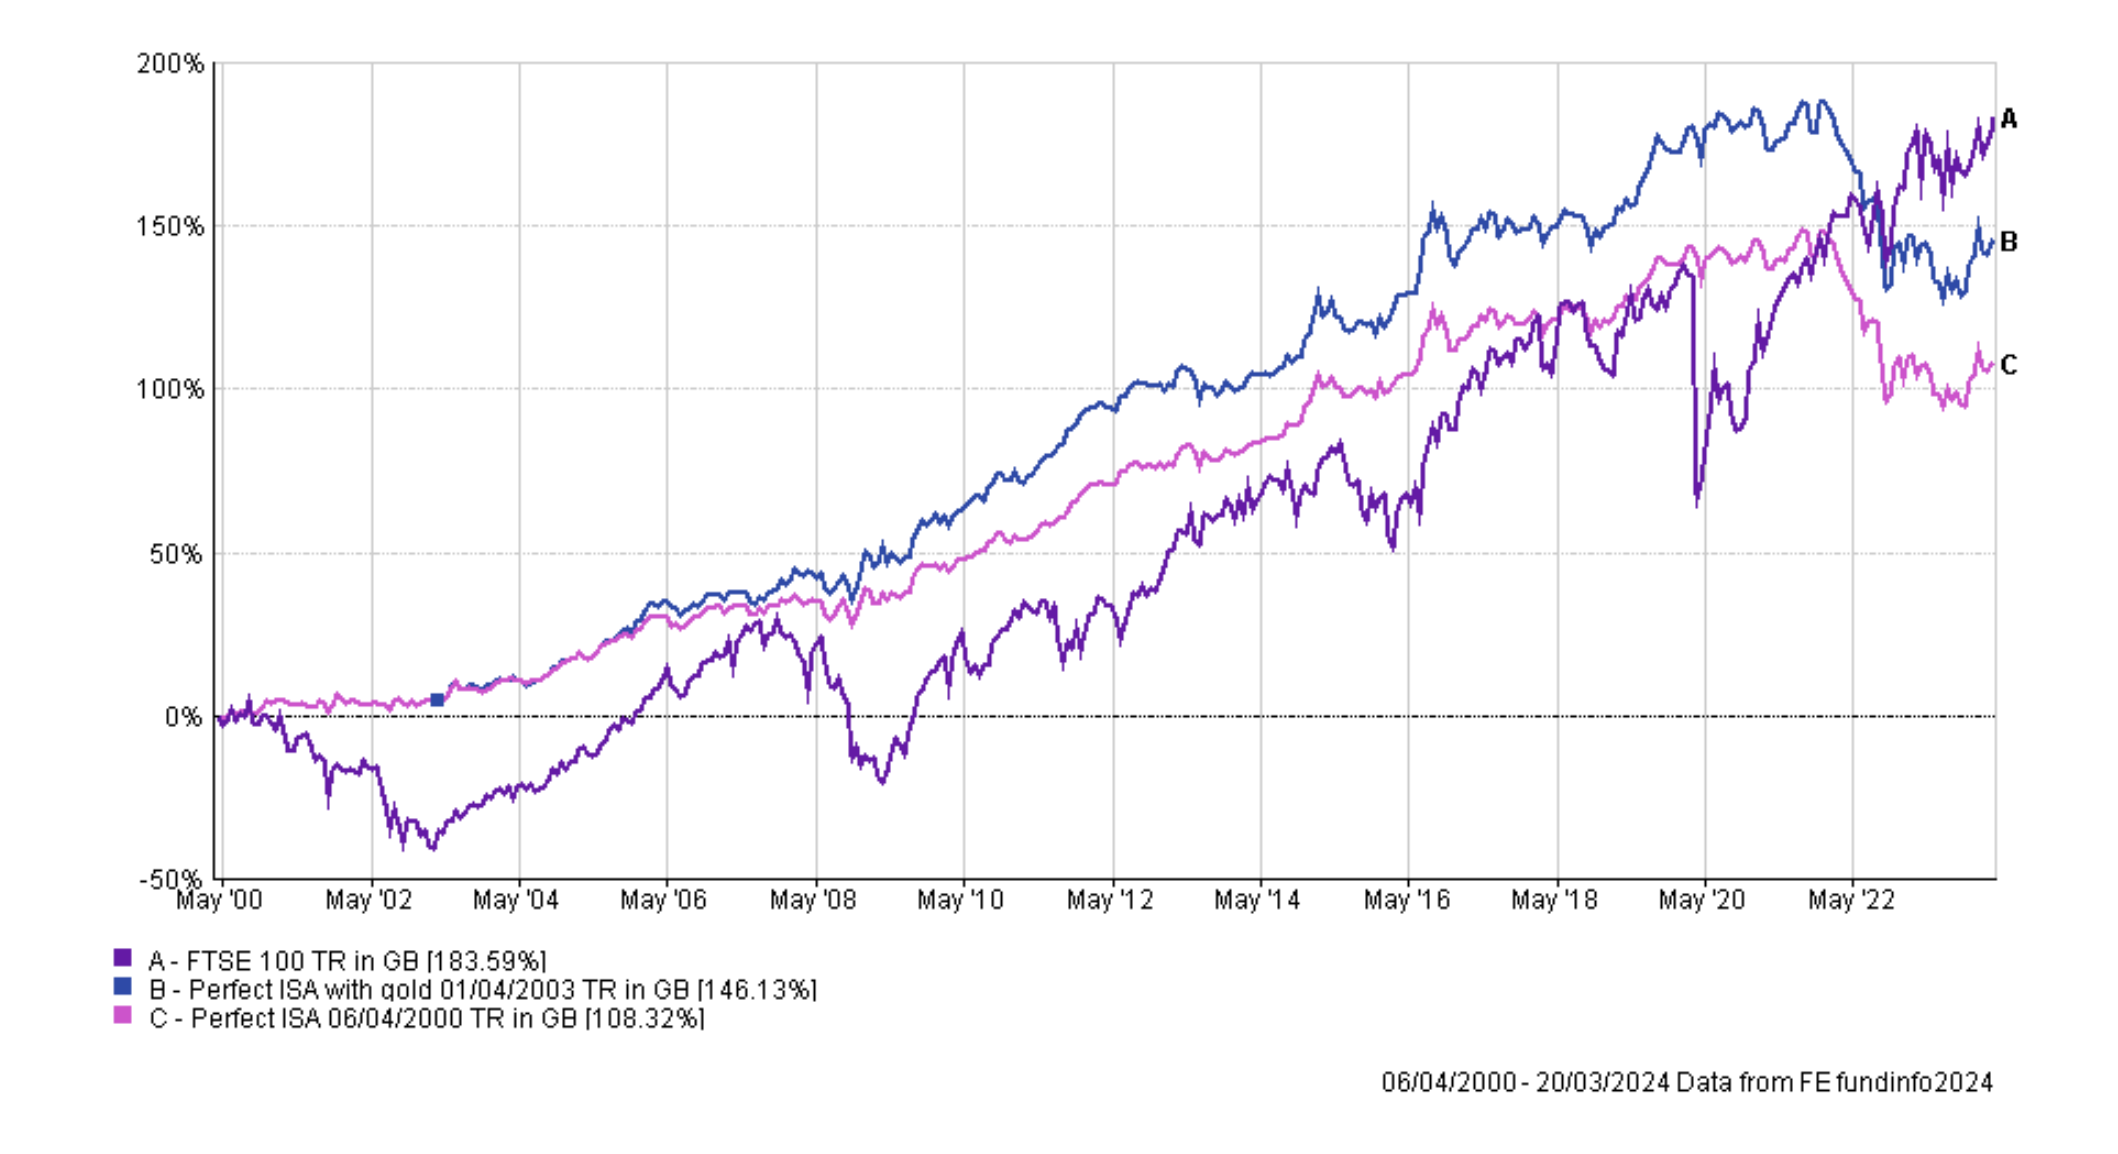
If I overlay the long-term performance of that portfolio onto the earlier chart you can see that despite the boost provided by gold, the performance still slumped during 2022 and 2023 because of its gilt exposure.
The other thing to note is that in four tax years the Perfect Gold Portfolio lost money (in 2013, 2017, 2021 and 2022) and in the 2022 tax year the portfolio lost -9.40% which was not much of an improvement on the original Perfect ISA Portfolio.
But the lessons of successfully managing my own £50k portfolio throughout 2022 and 2023 were the importance of:
- globally diversifying any equity holdings
- globally diversifying any bond holdings
- managing bond duration risk
- investing in assets other than bonds and equities (e.g. gold)
The trouble with trying to find a Perfect ISA Portfolio now is that the data set includes a 100 year event in 2022 plus, of course, the financial crisis in 2008. The reality is that any portfolio I construct will only have made a profit in 2022 if it was solely comprised of cash, gold, European equities, Japanese Equities and Global Equity Income funds. However, these will not have made a profit (as a portfolio) in a number of other tax years, most notably 2013 and in the early 2000s.
The possible permutations for a portfolio comprised from the 35 sectors listed above are almost limitless and after weeks of analysis the closest I could come to achieving a Perfect ISA Portfolio still lost money during the 2013 and 2022 tax years, as shown below.
| Tax Year (the starting year) | FTSE 100 return% |
Original Perfect ISA Portfolio return %
|
New Perfect ISA Portfolio return %
|
| 2000 | -11.13 | 3.26 | 1.81 |
| 2001 | -4.11 | 0.33 | 0.82 |
| 2002 | -24.52 | 0.51 | 0.01 |
| 2003 | 21.30 | 5.56 | 8.14 |
| 2004 | 14.46 | 6.65 | 4.51 |
| 2005 | 26.34 | 10.43 | 12.96 |
| 2006 | 9.37 | 2.17 | 1.37 |
| 2007 | -3.63 | 1.86 | 3.88 |
| 2008 | -29.94 | 0.59 | 0.1 |
| 2009 | 50.49 | 8.43 | 16.51 |
| 2010 | 7.95 | 4.67 | 4.13 |
| 2011 | -1.74 | 9.84 | 4.13 |
| 2012 | 13.44 | 7.31 | 3.99 |
| 2013 | 11.04 | 0.60 | -0.62 |
| 2014 | 5.73 | 10.96 | 5.37 |
| 2015 | -6.35 | 0.99 | 0.99 |
| 2016 | 23.44 | 7.77 | 8.18 |
| 2017 | 2.26 | 0.03 | 0.62 |
| 2018 | 8.27 | 2.78 | 2.28 |
| 2019 | -21.84 | 2.91 | 3.06 |
| 2020 | 26.30 | 2.54 | 6.65 |
| 2021 | 15.28 | -2.25 | 0.04 |
| 2022 | 5.95 | -10.18 | -1.58 |
Here is the chart of the new portfolio's long term performance (the red line) versus the FTSE 100, the original Perfect ISA Portfolio and the Perfect Gold Portfolio.
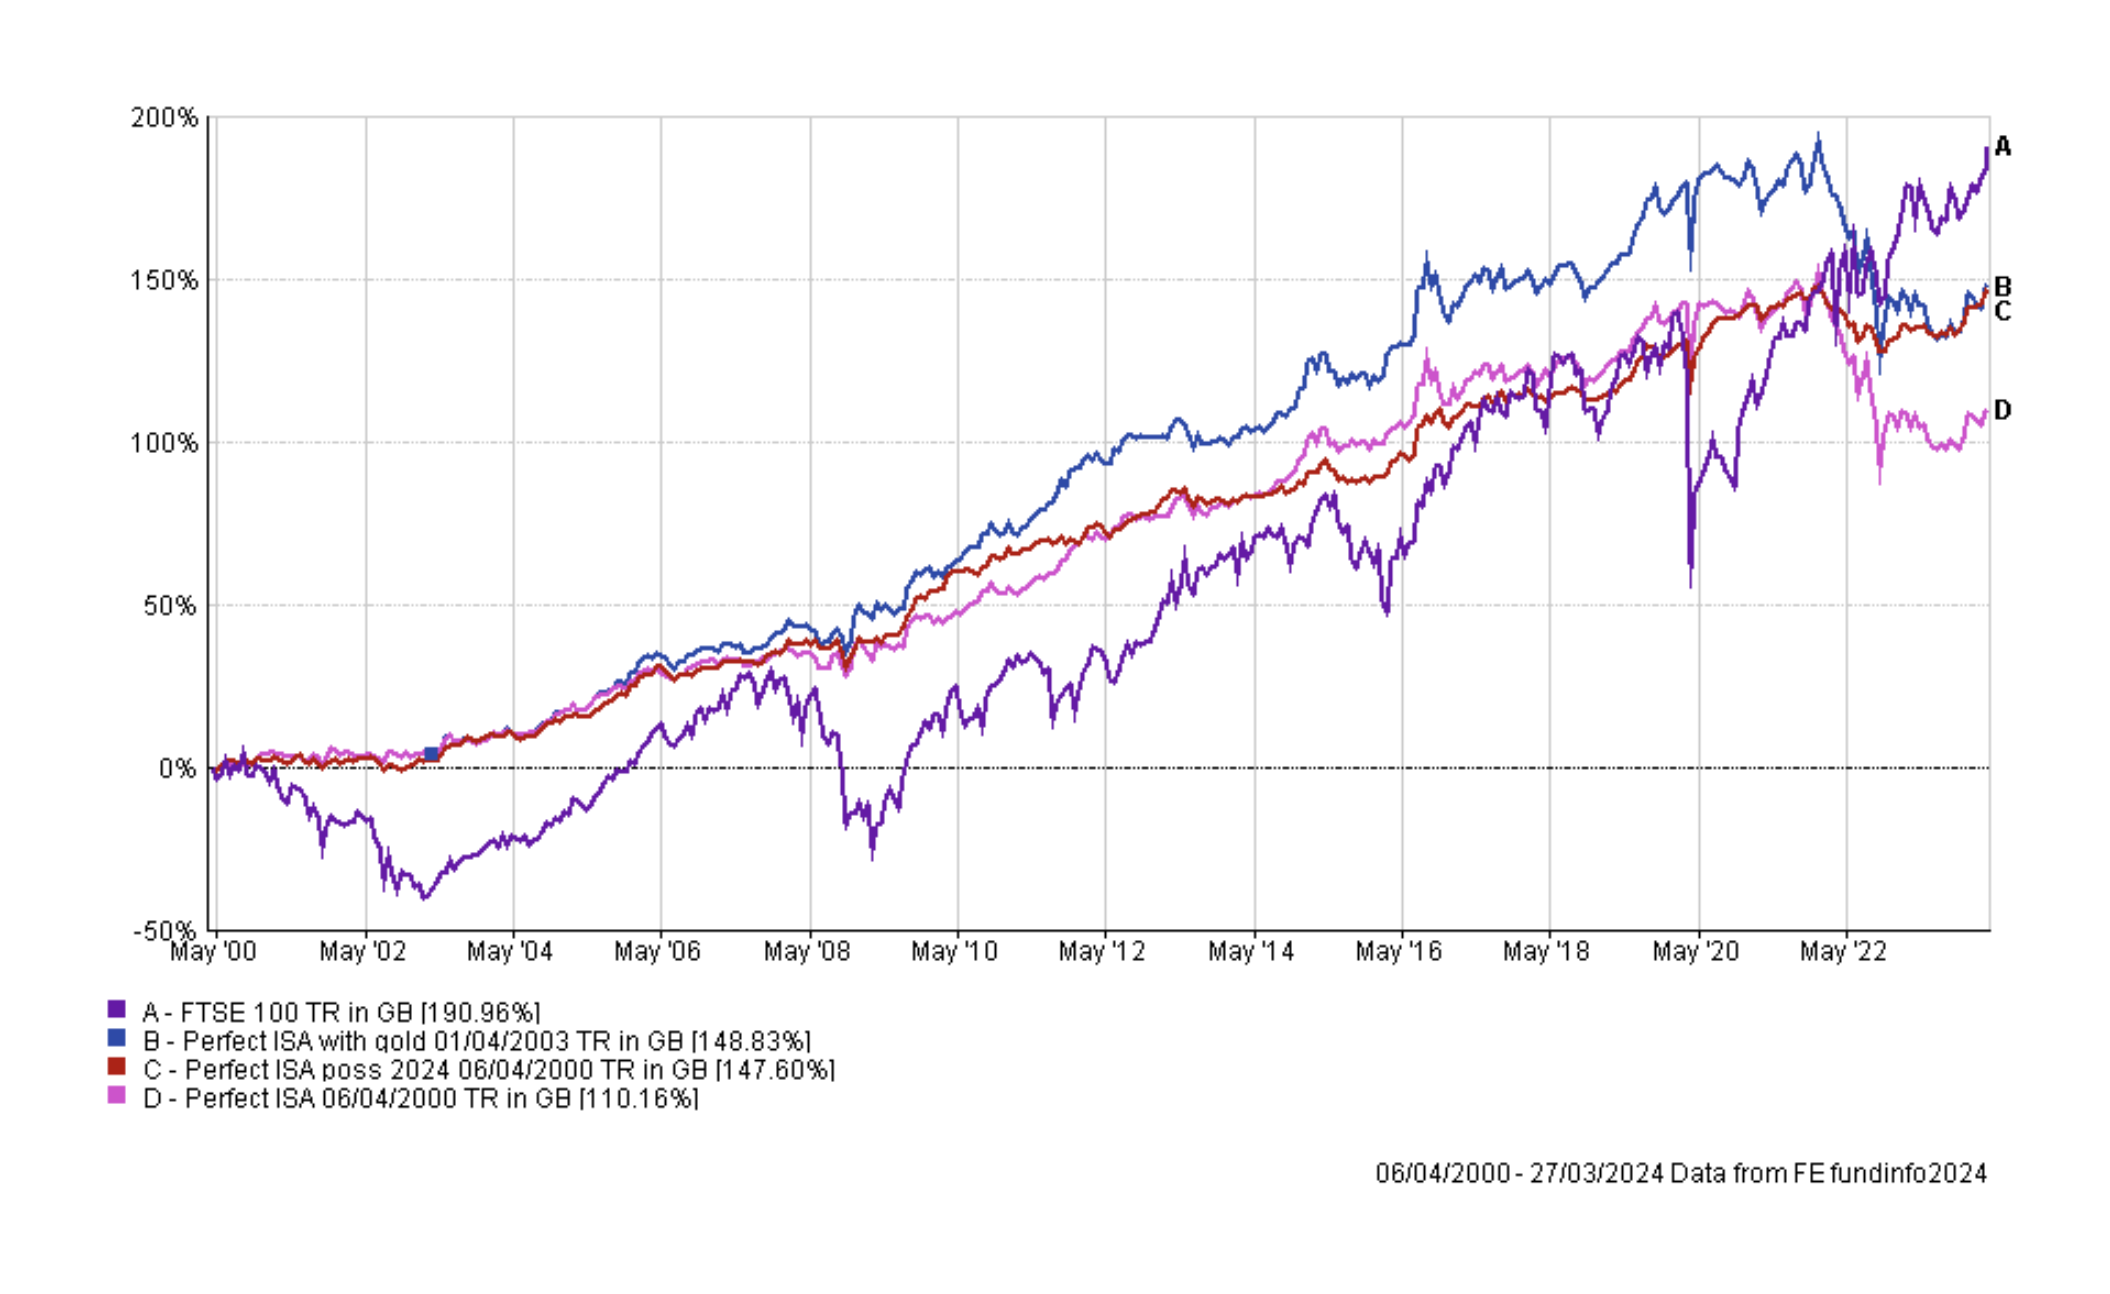
There is no doubt that the new portfolio is an improvement. However, it still posts a negative return in two tax years and still lags the FTSE 100 over the long term. Part of the beauty of the original Perfect ISA Portfolio, but also one of its downfalls, was its simplicity. Below I list the asset allocation of the New Perfect ISA Portfolio for posterity.
- 2.75% Europe Excluding UK
- 21.25% Global Bonds
- 5.5% Global
- 1% Healthcare
- 3.25% Japan
- 1.25% Sterling High Yield
- 12.5% Sterling Strategic Bond
- 0.25% UK All Companies
- 7.25% UK Gilts
- 1.75% UK Smaller Companies
- 35.25% Cash
- 8% Gold
Realistically, this isn't a particularly useful asset mix. There are some minuscule exposures to some assets as a result of the desire to minimise potential losses in any given tax year. If we were free from that burden then the asset mix can be much more simplified and would morph towards a simple portfolio comprised of gold, cash and a globally diversified mix of bonds and equities where the equity exposure is around 20%. In the past I have highlighted Vanguard – LifeStrategy 20% Equity as a decent, globally diversified, proxy for the Perfect ISA Portfolio. That remains true and unsurprisingly the fund struggled in 2022 and 2023 too, losing -2.68% and -7.06% respectively. Its downfall was its bond/equity only asset mix as well as its exposure to long duration bonds.
The lessons of the Perfect ISA Portfolio are that you can't legislate for black swan events such as what happened to the bond market in 2022. Diversification across and within different asset classes is the best way to mitigate the impact of such events. Also, it is important to review and diversify the low risk end of any portfolio, not just the exciting equity focused part. In building the Perfect ISA Portfolio I have always assumed that the underlying funds are picked at random. But in reality regularly reviewing any portfolio is key and would have seen an investor not only reduce their bond duration in 2022 but probably remove their gilt exposure entirely, just as I did with my own £50k portfolio.
The Perfect ISA Portfolio has been an interesting exercise and I will revisit it in the future. Who knows, maybe it will come to the fore during the next market crash?

£200 Pension Cashback Offer
Make a qualifying deposit or transfer a pension to our partner Interactive Investor.
- Deposit or transfer a pension of at least £20k and you could earn £200 cashback
- Terms and Fees apply, Capital at risk
- New & Existing customers opening a SIPP
- Offer ends 31st July 2026
Before starting your transfer, check you won't lose any valuable benefits (such as guaranteed annuity rates or a lower protected pension age) and find out what exit fees you might have to pay
