

Long-term 80-20 Investor members may remember that five years ago I embarked on a research endeavour to find the Perfect ISA portfolio.
In simple terms, I was trying to work out the Perfect ISA portfolio asset mix (or whether one even existed). Was there an asset mix that had always produced a positive return in every tax year historically? Of course that wasn't enough, as just investing in cash would have achieved this. So finding the Perfect ISA portfolio also had to maximise the upside, far outperforming cash returns. So I created a number of rules that the Perfect ISA portfolio had to adhere to. The rules were that:
- There would be no constraint over which assets could be included or in what proportions they are held
- The portfolio must have made money every tax year since the last market peak back in 2000
- and not lost money
- It had to at least beat a FTSE 100 Index tracker and
- The asset allocation had to remain constant throughout that time
So, in essence, I wanted to find the perfect 'buy and forget' asset allocation. Of course in the current climate, namely the fastest bear market of all-time, the portfolio's performance and resilience is of particular interest. Current market conditions will really test the portfolio to its limits.
Just to recap...
The portfolio had to achieve the above aims irrespective of the actual funds you'd bought. So to make sure I was only looking at the asset allocation I always used the sector average return for each asset type.
To recap, my analysis covered 27 sectors (see the original article for the full list).
The number of possible combinations was mind-blowing and it took me two full days to analyse it. I revealed the Perfect ISA Portfolio is split as follows:
- 9% cash
- 71% UK Gilts
- 20% UK Equity Income
Since that time I have revisited the Perfect ISA portfolio each year to see how it has fared in the real world. While the aim of the original research piece was to determine a 'Perfect' asset allocation based on the above rules it was also to determine whether one even existed and to educate 80-20 Investor members on how to go about finding one. One of my aims with 80-20 Investor has always been to spark an inquisitive nature in members and show them how to carry out their own research. It is all about building a hypothesis, working out the best way to test it and then analysing the results. It may well be that you reach a final conclusion. Sometimes it may be that you don't. That is part of the fun and it may surprise you that some of my 80-20 Investor research never sees the light of day because I can't support the hypothesis.
Also some research never ends, such as the Perfect ISA portfolio because it is constantly being tested in the field every year.
2017 wasn't so bad after all?
If you go back to my perfect portfolio review last year you will see that I named 2017 annus horribilis because the portfolio closed out the tax year down 0.34%. Of course that was still admirable but for whatever reason after running the data for this year, in order to update the portfolio's performance numbers, the third-party data provider that I use to monitor the portfolio has adjusted its data, particularly for the 2016/17 and 2017/2018 tax years. It now means that the Perfect ISA portfolio actually made a profit of 0.03%, in 2017/18 and not a loss.
So that means that in fact the Perfect ISA portfolio's record is intact and....well... perfect, as shown by the table below.
| Tax Year (the starting year) | FTSE 100 return% |
Perfect ISA Portfolio return %
|
| 2000 | -11.13 | 3.26 |
| 2001 | -4.11 | 0.33 |
| 2002 | -24.52 | 0.51 |
| 2003 | 21.30 | 5.56 |
| 2004 | 14.46 | 6.65 |
| 2005 | 26.34 | 10.43 |
| 2006 | 9.37 | 2.17 |
| 2007 | -3.63 | 1.86 |
| 2008 | -29.94 | 0.59 |
| 2009 | 50.49 | 8.43 |
| 2010 | 7.95 | 4.67 |
| 2011 | -1.74 | 9.84 |
| 2012 | 13.44 | 7.31 |
| 2013 | 11.04 | 0.60 |
| 2014 | 5.73 | 10.96 |
| 2015 | -6.35 | 0.99 |
| 2016 | 23.44 | 7.77 |
| 2017 | 2.26 | 0.03 |
| 2018 | 8.27 | 2.78 |
How has the Perfect ISA portfolio fared so far in the 2019/20 tax year
The chart below shows how the Perfect ISA portfolio (the blue line) has fared so far this tax year versus the FTSE 100 (in red).
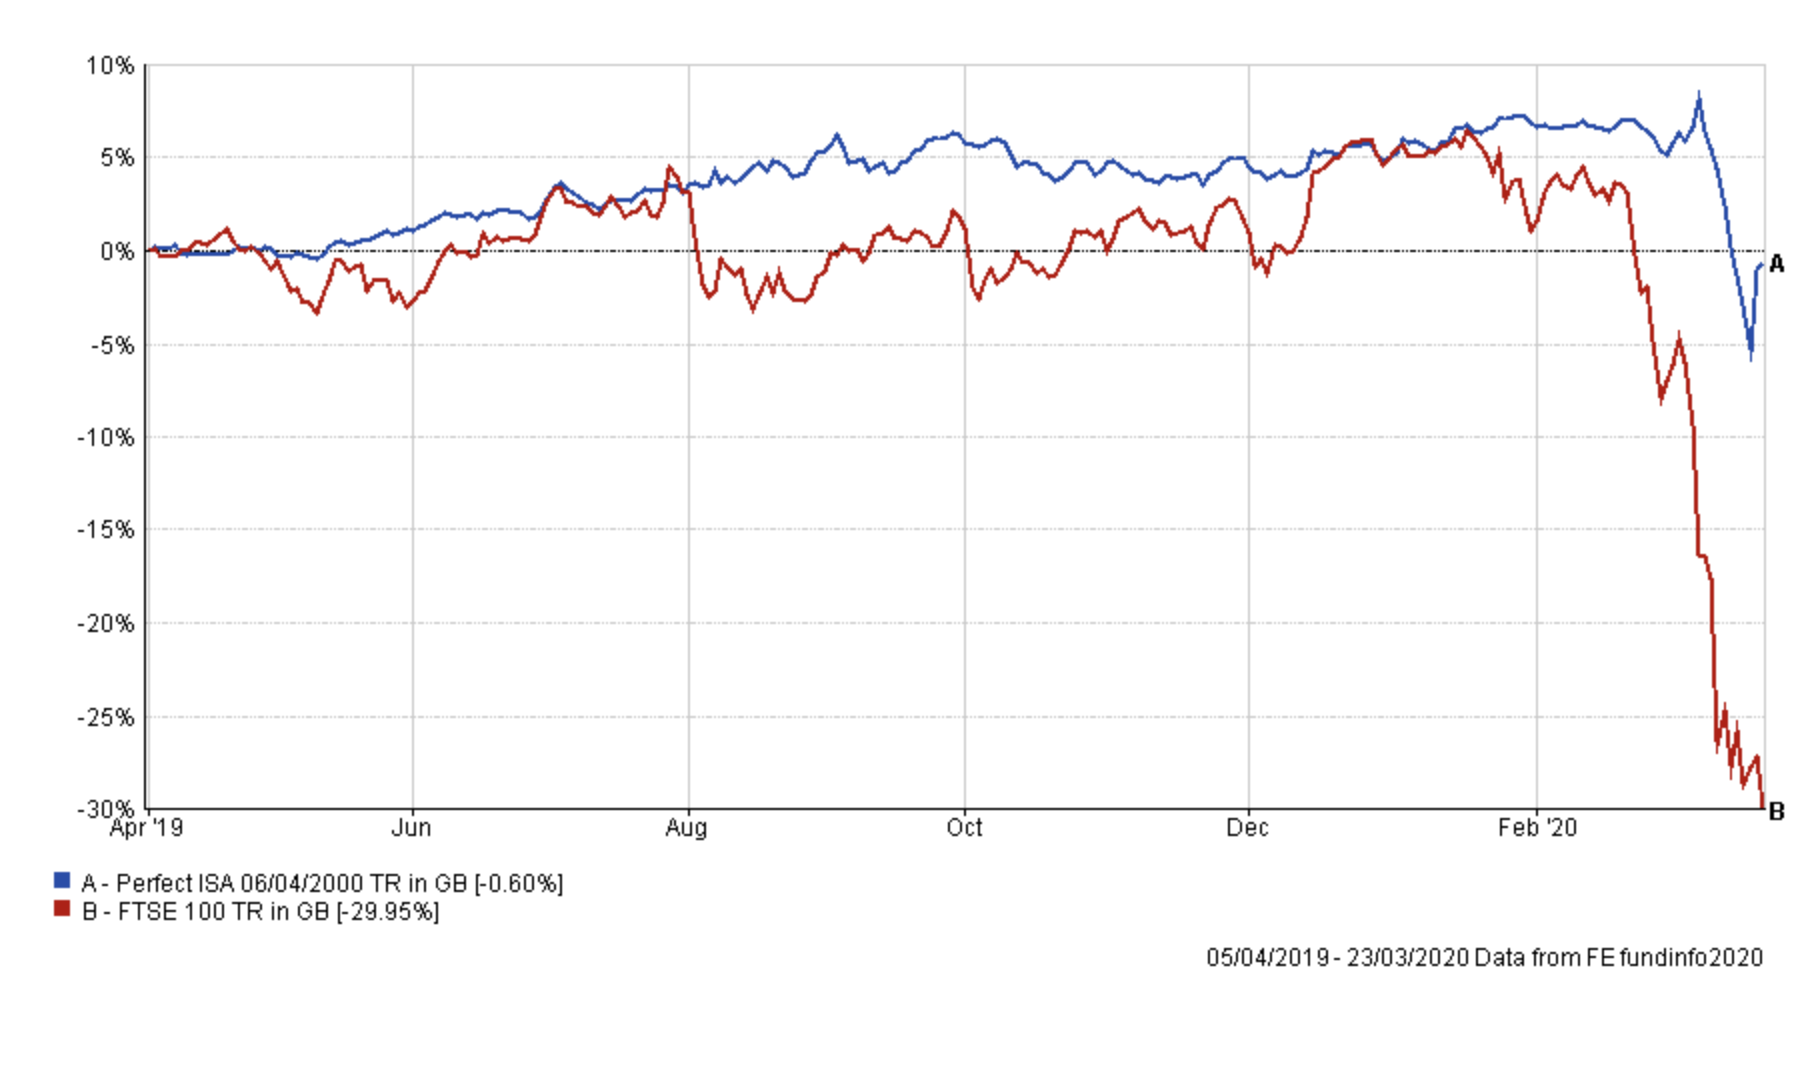
Somewhat incredibly the Perfect ISA portfolio is almost in profit (down just 0.6%) despite the stock market and bond market implosion caused by the coronavirus. It's especially impressive when you compare it to the FTSE 100 which is down almost 30% so far this tax year.
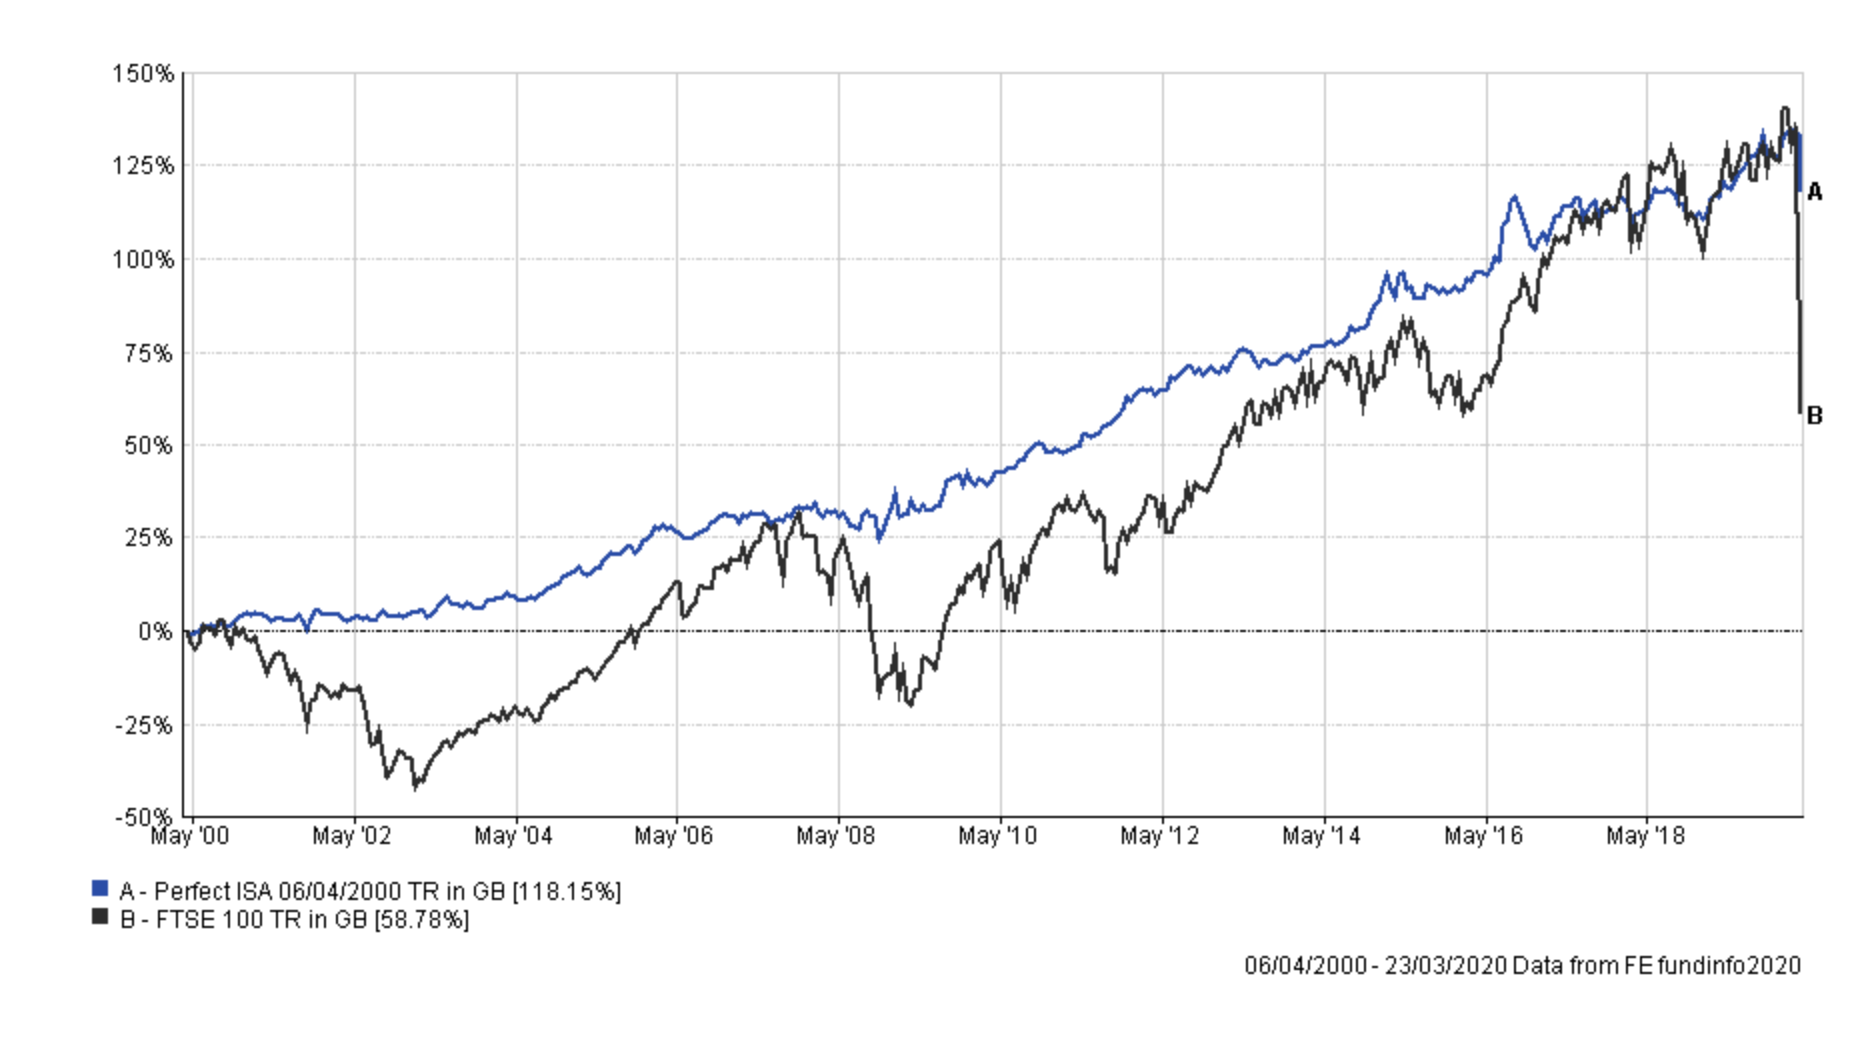
So while the Perfect ISA portfolio has regained its 100% perfect tax year record, it will also hopefully retain it this year. If we consider how the Perfect Portfolio has fared versus the FTSE 100 since April 2000 it is even more staggering. As things stand it has more than doubled the return of the FTSE 100 since April 2000. Incredible!
The 80-20 Investor Perfect ISA portfolio
It is also interesting to see what would have happened had you used the 80-20 Investor algorithm to choose the equity funds to invest in. The assumption made is that since 6/4/2000 you would have invested £219,560 in total if you had invested your full annual ISA allowance at the start of each tax year. The result of applying 80-20 Investor to the equity content (switching equity income funds every 3 months) would then have been:
| Total Invested | £219,560 |
| 80-20 Perfect ISA portfolio return | £337,119 |
| Perfect ISA portfolio return | £307,769 |
So you would have been just under £30,000 better off with the 80-20 Investor version (i.e. using 80-20 Investor to help choose the funds to invest it).
The three UK equity income funds that would have been picked for the Perfect ISA portfolio at the start of January were:
- LF - Gresham House UK Multi Cap Income
- Premier - Income
- Premier - Optimum Income
So what are the key takeaways from this research
As I remind you each year, dynamism is at the heart of 80-20 Investor. By that I mean the ability to review and alter your asset mix and funds to ride the prevailing momentum in markets. However, sometimes investors will want to take a buy and hold approach with some of their money. That's perfectly fine but you can still use 80-20 Investor's research to try and improve returns. 80-20 Investor is not dictatorial and you don't have to just focus on the BOTB funds. The BFBS tables are just as important, in this instance the UK equity income sector shortlist would be particularly relevant.
For those who'd prefer to apply a Perfect ISA approach to the core of their portfolio there are passive options too. Back in 2015 a separate piece of my research was published in The Telegraph called Funds to ‘buy & forget’ in 2015. It highlighted Vanguard – LifeStrategy 20% Equity. Uncannily the fund has 20% of assets in equities globally, not just the UK, and the other 80% in fixed interest (bonds and gilts). Its global exposure does mean that it is exposed to currency moves (which my Perfect ISA portfolio isn't to the same degree). It hasn't produced a positive return every tax year. But overall it isn't a bad proxy for my Perfect ISA portfolio asset mix.

£200 Pension Cashback Offer
Make a qualifying deposit or transfer a pension to our partner Interactive Investor.
- Deposit or transfer a pension of at least £20k and you could earn £200 cashback
- Terms and Fees apply, Capital at risk
- New & Existing customers opening a SIPP
- Offer ends 31st July 2026
Before starting your transfer, check you won't lose any valuable benefits (such as guaranteed annuity rates or a lower protected pension age) and find out what exit fees you might have to pay
