

Long-term 80-20 Investor members may remember that four years ago I embarked on a research endeavour to find the Perfect ISA portfolio. At this time of year, when investors are looking at where to invest their ISA allowance, it is a particularly pertinent question.
In simple terms, I was trying to work out the Perfect ISA portfolio asset mix (or whether one even existed). Was there an asset mix that had always produced a positive return in every tax year historically? Of course that wasn't enough, as just investing in cash would have achieved this. So finding the Perfect ISA portfolio also had to maximise the upside, far outperforming cash returns. So I created a number of rules that the Perfect ISA portfolio had to adhere to. The rules were that:
- There would be no constraint over which assets could be included or in what proportions they are held
- The portfolio must have made money every tax year since the last market peak back in 2000
- and not lost money
- It had to at least beat a FTSE 100 Index tracker and
- The asset allocation had to remain constant throughout that time
So, in essence, I wanted to find the perfect 'buy and forget' asset allocation. One which would have achieved the above irrespective of the actual funds you'd bought. So to make sure I was only looking at the asset allocation I always used the sector average return for each asset type.
To recap, my analysis covered 27 sectors (see the original article for the full list).
The number of possible combinations was mind-blowing and it took me two full days to analyse it. I revealed the Perfect ISA Portfolio is split as follows:
- 9% cash
- 71% UK Gilts
- 20% UK Equity Income
Since that time I have revisited the Perfect ISA portfolio each year to see how it has fared in the real world. While the aim of the original research piece was to determine a 'Perfect' asset allocation based on the above rules it was also to determine whether one even existed and to educate 80-20 Investor members on how to go about finding one. One of my aims with 80-20 Investor has always been to spark an inquisitive nature in members and show them how to carry out their own research. It is all about building a hypothesis, working out the best way to test it and then analysing the results. It may well be that you reach a final conclusion. Sometimes it may be that you don't. That is part of the fun and it may surprise you that some of my 80-20 Investor research never sees the light of day because I can't support the hypothesis.
Also some research never ends, such as the Perfect ISA portfolio because it is constantly being tested in the field every year.
Annus horribilis - 2017/18
When I carried out the last annual review (on 29th March 2018) the Perfect ISA portfolio was on the brink of its first tax year loss ever. The chart below (click to enlarge) shows how the Perfect ISA portfolio was performing at that point. After stock markets enjoyed a stellar 2017 they were brought back to earth after the correction in the spring of 2018. While the US has since recovered most equity markets globally have yet to fully recover.

So did the Perfect ISA portfolio recover in the last few days of the tax year? The answer is no, but it almost did. The performance chart for the complete tax year shows that the Perfect ISA staged a rally and by the 3rd April crept back into positive territory. However, in the last two days of the tax year it gave up this profit to finish down 0.34%.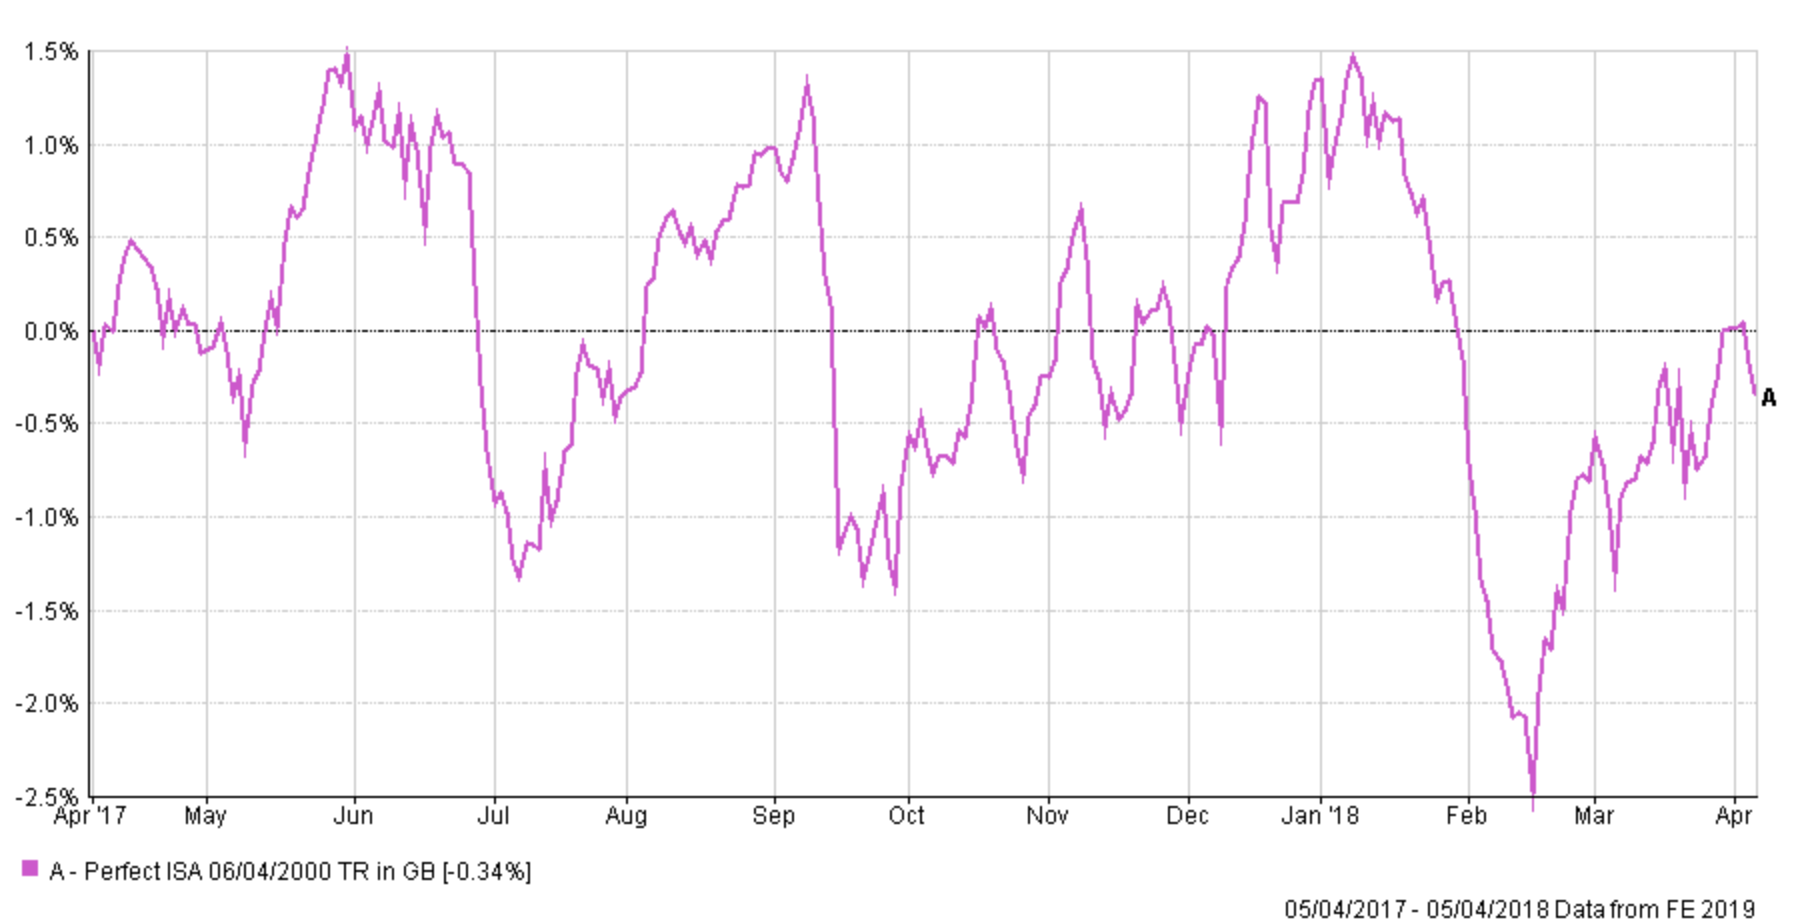
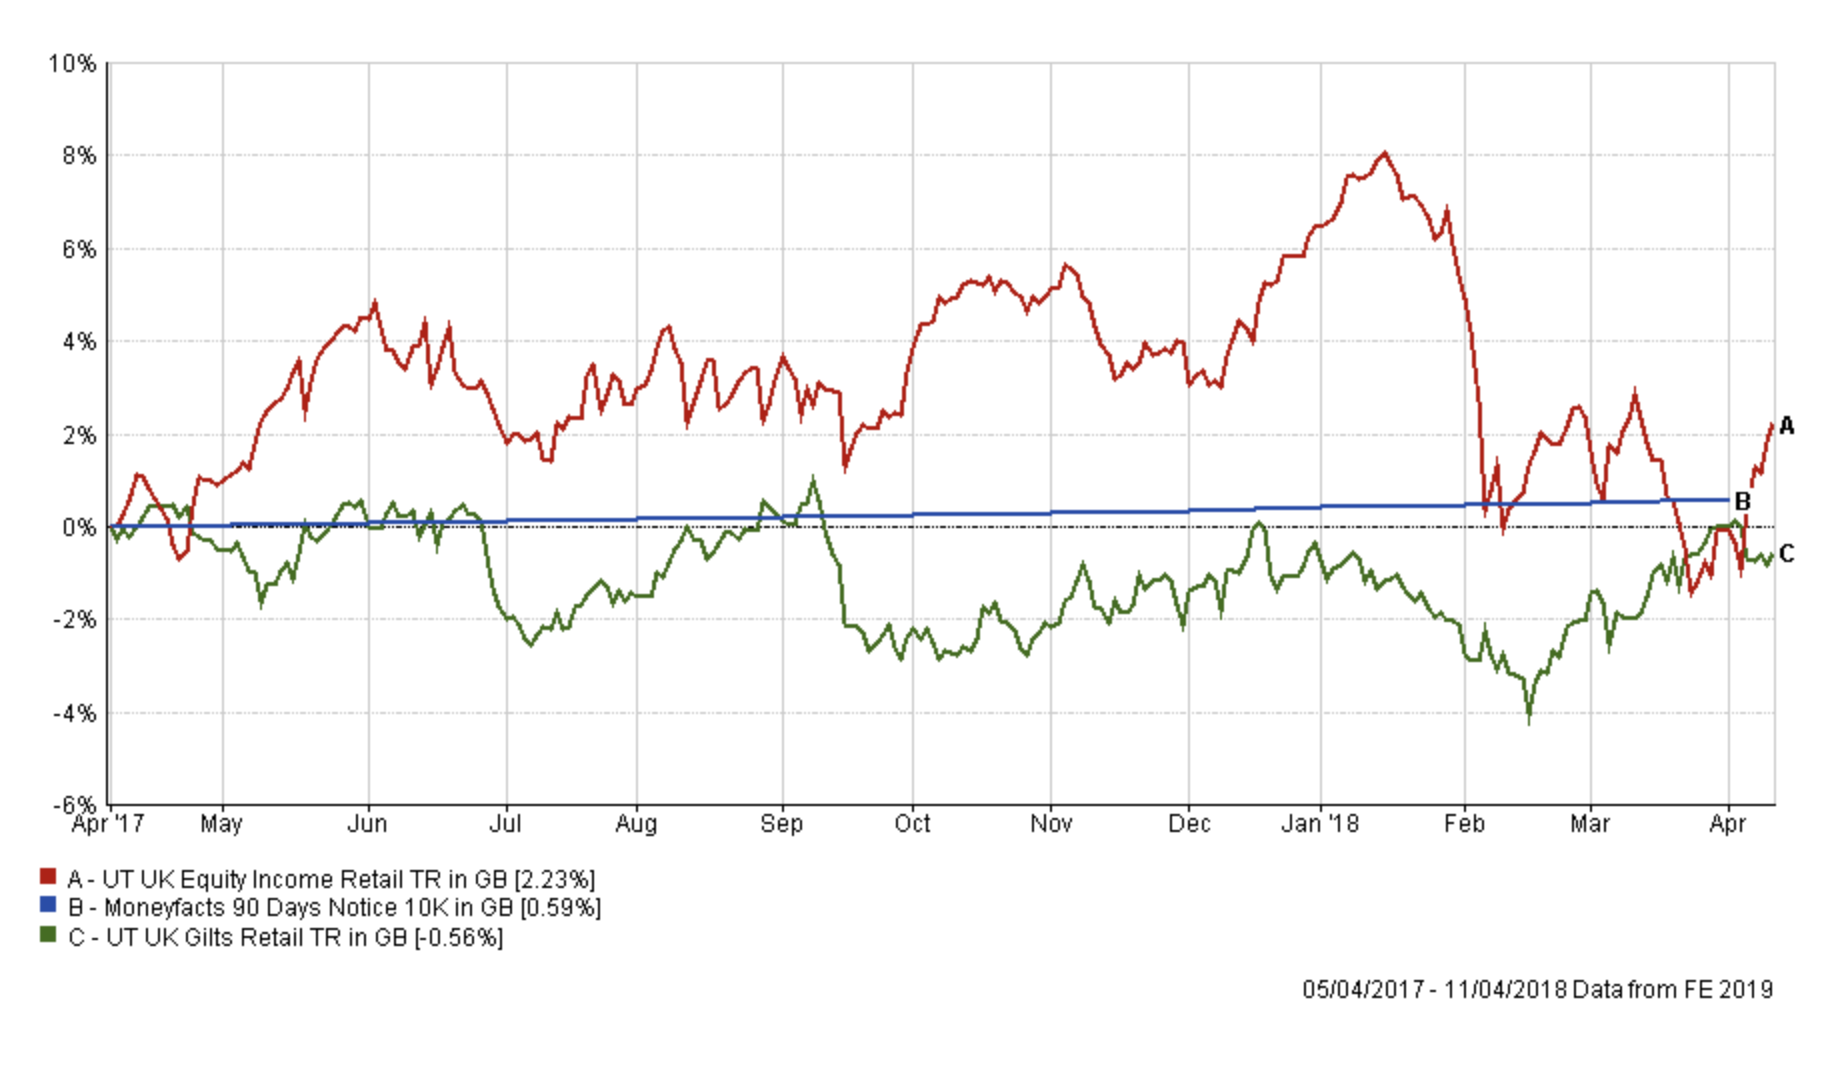
While obviously, it's disappointing that the portfolio didn't finish the tax year in positive territory it was so close. In fact, the portfolio turnaround continued into the new tax year and just four days later it was up almost 0.2%. So what caused the Perfect ISA portfolio to stumble in the last few days of the 2017/18 tax year? The chart below shows how the three components of the Perfect ISA fared throughout the 2017/18 tax year. As stock markets collapsed at the start of 2018 the gilt portion of the portfolio rallied strongly driving up the portfolio's overall return. In the last few days of the tax year equity markets bounced incredibly (and unusually) strongly which caused gilts to fall (as investors ditched them for equities). This was a drag on the portfolio until the equity component took up the slack a few days later.
How has the Perfect ISA portfolio fared so far in the 2018/19 tax year
The chart below shows how the Perfect ISA portfolio has fared so far this tax year versus the FTSE 100.
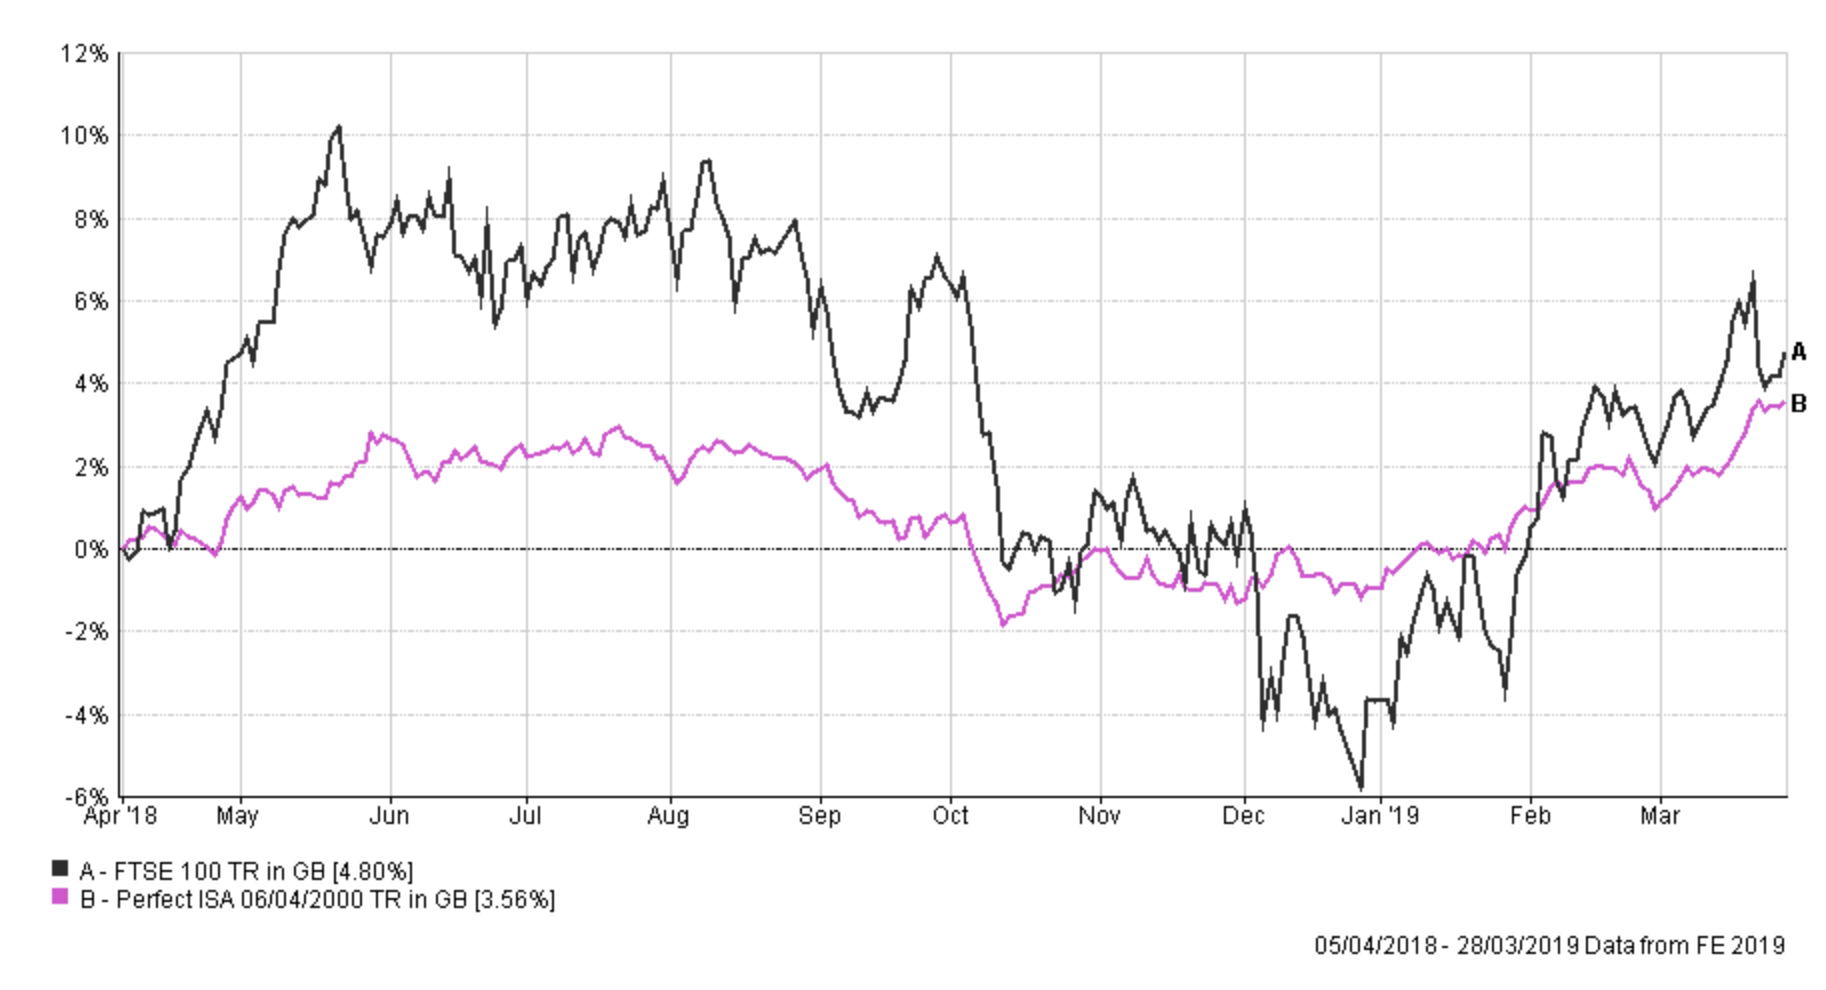
The lack of volatility of the Perfect ISA portfolio during what has been an extremely volatile year has been impressive as has its overall return. If you focus on the equity market low of December the Perfect ISA portfolio is barely in negative territory. Meanwhile, the FTSE 100 has only avoided a disastrous year thanks to one of the strongest New Year rallies in decades.
The table below shows the tax year returns for the Perfect ISA portfolio as well as those for the FTSE 100 for every tax year since 2000. You can see that the Perfect ISA portfolio has made money on paper every tax year, except for 2017/18, since the 2000 market high.
| Tax Year | FTSE 100 return% | Perfect ISA portfolio return % |
| 2000 | -11.13 | 3.23 |
| 2001 | -4.11 | 0.3 |
| 2002 | -24.52 | 0.63 |
| 2003 | 21.3 | 4.69 |
| 2004 | 14.46 | 6.38 |
| 2005 | 26.34 | 10.27 |
| 2006 | 9.37 | 2.47 |
| 2007 | -3.63 | 0.86 |
| 2008 | -29.94 | 0.02 |
| 2009 | 50.49 | 7.71 |
| 2010 | 7.95 | 4.78 |
| 2011 | -1.74 | 9.87 |
| 2012 | 13.44 | 6.83 |
| 2013 | 11.04 | 0.6 |
| 2014 | 5.73 | 10.93 |
| 2015 | -6.35 | 0.79 |
| 2016 | 23.75 | 8.44 |
| 2017 | 2.23 | -0.34 |
| 2018 | 4.8 | 3.56 |
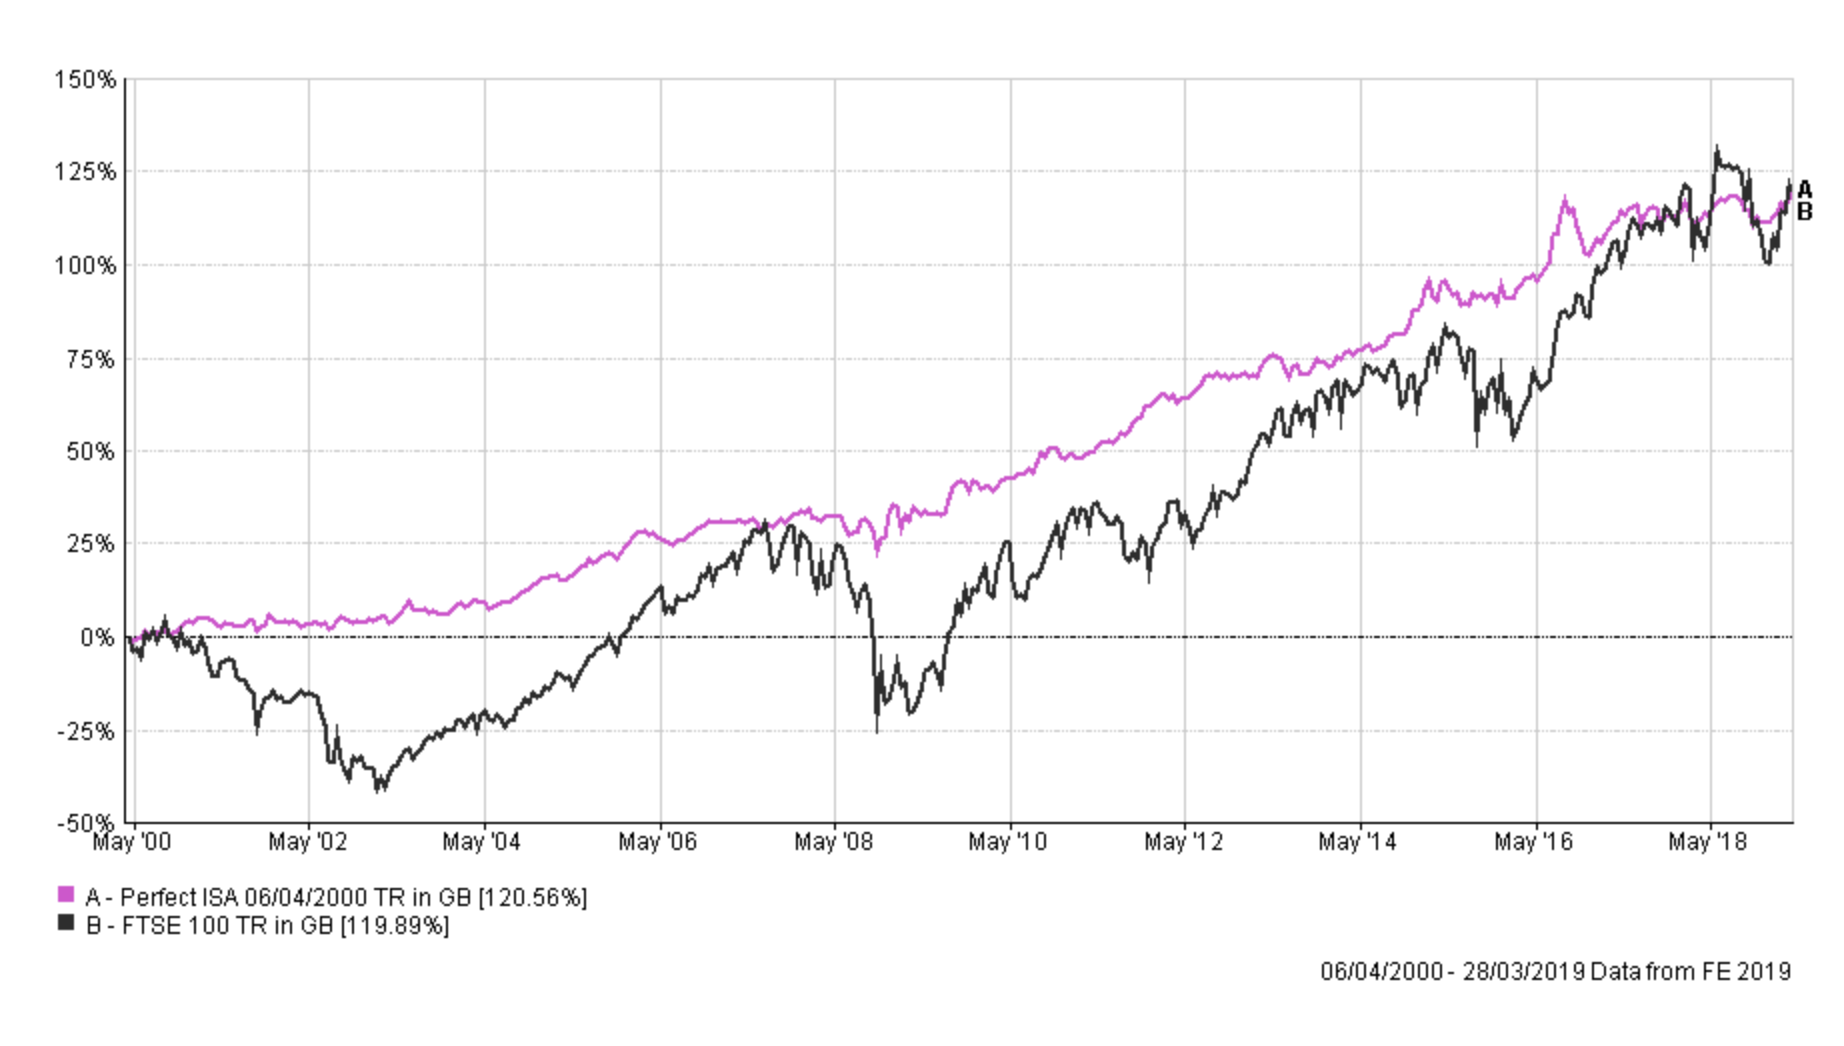
While the Perfect ISA portfolio lost its 100% tax year record how has it fared in the tougher task of outperforming the FTSE 100 over the long term, especially after the New Year stock market rally? The chart below shows that amazingly the Perfect ISA portfolio is still winning, although it is being pushed to its limit.
What now for the Perfect ISA portfolio?
The Perfect ISA Portfolio research was always about capturing as much of the upside in equity markets while limiting the downside. The Perfect ISA portfolio is not a cash ISA substitute but the original idea was inspired by the intriguing idea of how to beat cash without losing money in a given tax year. When we reviewed the research last year the FTSE 100 had closed the gap on the Perfect ISA Portfolio. While it is a slightly unfair comparison because the FTSE 100 is 100% in equities and the Perfect Portfolio is only 20% in equities at the time I suggested that if we had a market correction then the Perfect ISA Portfolio would likely outperform again. You can see that prediction came true in the chart above.
Given that the Perfect ISA portfolio failed to make a positive return does the asset mix of the Perfect ISA portfolio need to be reviewed? Well given how close the portfolio came to making a positive return in 2017/18 I decided to tweak the existing asset mix to see if I could 'fix' it. The permutations are enormous because if the asset mix alters it changes the asset mix for every previous tax year. The problem then became that 2002 and 2008, two years when equity markets collapsed (2002 was the aftermath of the dotcom bubble and 2008 was the aftermath of the financial crisis), quickly entered negative territory if you increased the portfolio's equity content. In order to get close to achieving the 100% tax year record required the portfolio's cash allocation to approach 40%, which meant that the portfolio would then fail the FTSE 100 outperformance test.
So pragmatically it makes sense to not throw the baby out with the bath water. Ultimately 2017/18 proved that nothing is perfect. But don't forget the figures above only assume the average fund return from the respective sectors. Or in other words what you would have achieved by the law of averages. Also the figures don't take into account the fact that you can only invest a set amount each year, so you effectively would have dripped your money into the market over time as you used each year's ISA allowance. The result is that since 6/4/2000 you would have invested £199,560 in total if you had used your full annual ISA at the start of each tax year. The result of applying 80-20 Investor to the equity content would then have been
| Total Invested | £199,560 |
| 80-20 Perfect ISA portfolio | £313,488 |
| Perfect ISA portfolio | £291,055 |
So you would have been over £22,000 better off with the 80-20 Investor version (i.e. using 80-20 Investor to help choose the funds to invest it).
So what are the key takeaways from this research
As I remind you each year, dynamism is at the heart of 80-20 Investor. By that I mean the ability to review and alter your asset mix and funds to ride the prevailing momentum in markets. However, sometimes investors will want to take a buy and hold approach with some of their money. That's perfectly fine but you can still use 80-20 Investor's research to try and improve returns. 80-20 Investor is not dictatorial and you don't have to just focus on the BOTB funds. The BFBS tables are just as important, in this instance the UK equity income sector shortlist would be particularly relevant.
For those who'd prefer to apply a Perfect ISA approach to the core of their portfolio there are passive options too. Back in 2015 a separate piece of my research was published in The Telegraph called Funds to ‘buy & forget’ in 2015. It highlighted Vanguard – LifeStrategy 20% Equity. Uncannily the fund has 20% of assets in equities globally, not just the UK, and the other 80% in fixed interest (bonds and gilts). Its global exposure does mean that it is exposed to currency moves (which my Perfect ISA portfolio isn't to the same degree). It also hasn't produced a positive return every tax year. But overall it isn't a bad proxy for my Perfect ISA portfolio asset mix.

£200 Pension Cashback Offer
Make a qualifying deposit or transfer a pension to our partner Interactive Investor.
- Deposit or transfer a pension of at least £20k and you could earn £200 cashback
- Terms and Fees apply, Capital at risk
- New & Existing customers opening a SIPP
- Offer ends 31st July 2026
Before starting your transfer, check you won't lose any valuable benefits (such as guaranteed annuity rates or a lower protected pension age) and find out what exit fees you might have to pay
