

The ongoing Neil Woodford saga has once again thrown the spotlight on active management. Advocates of passive investing have claimed it is yet more evidence that actively managed funds are at best expensive closet tracker funds but are usually just expensive funds that underperform the market over the longer term. They also claim that the few fund managers that do manage to outperform do so by pure luck. But as I concluded in a recent weekly newsletter it is more nuanced than that:
Investment managers claim it’s skill when they outperform but proclaim bad luck when they don’t. The truth is they are the architects of their own rise and fall via their stubborn adherence to their own investment biases. Where luck plays a significant role is in whether the investment backdrop favours that bias, such as investing in smaller companies. Since May 2017 the investment backdrop has been less kind to smaller company stocks. For those, like Woodford, stubbornly investing in small-cap stocks, their ‘luck’ ran out.
Long-time 80-20 Investor members will know that 80-20 Investor does not discriminate against passive or active funds (those with a fund manager). It ultimately highlights those funds that have an increased likelihood of outperforming in the near future, whether they are active or passive.
In a previous research piece titled 'Do active funds really outperform passives in sideways or falling markets?' I concluded that
While the evidence isn't conclusive it does suggest that the conventional wisdoms may not be true. Active fund managers likely outperform after a sideways market because they take bigger risks in order to try and outperform in a frustratingly stagnant period. After all they have to try and justify their fees. If the market suddenly rallies then this rewards the extra risk they've taken on board. Interestingly the results suggest that when the market is on the way down active managers apply the brakes which then limits the upside in the subsequent rebound. However, this isn't too detrimental to their performance across the period as a whole.
That research piece looked exclusively at the UK All Companies sector for unit trusts. But there is an interesting corollary as to whether the behaviour described above actually increases the chances of an active fund outperforming when investing in other markets, such as more volatile less researched equity markets?
To explore this idea I decided to look at 9 key unit trust equity sectors, which I've listed below:
- Asia Pacific Excluding Japan
- China/Greater China
- Europe Excluding UK
- Global
- Global Emerging Markets
- Japan
- North America
- UK All Companies
- UK Smaller Companies
For each sector I calculated the average performance of funds within each sector versus an appropriate passive benchmark over the last 20 years. In each instance, the chosen benchmark is one that is widely used by active fund managers themselves, within each sector, when benchmarking their own fund's performance.
I then looked at the relative performance (rather than the absolute performance) of the sector average versus that of the passive benchmark. This is summarised in the table below. If the sector average outperformed the passive benchmark over the stated time period then the relative performance is positive (and shown in green). If it underperformed it would be negative (and shown in red).
| Sector | Passive benchmark | Relative performance of active versus passive (+/-%) over 20 years |
| Asia Pacific Excluding Japan | MSCI Asia ex-Japan | -1.28 |
| China/Greater China | MSCI All China | 20.63 |
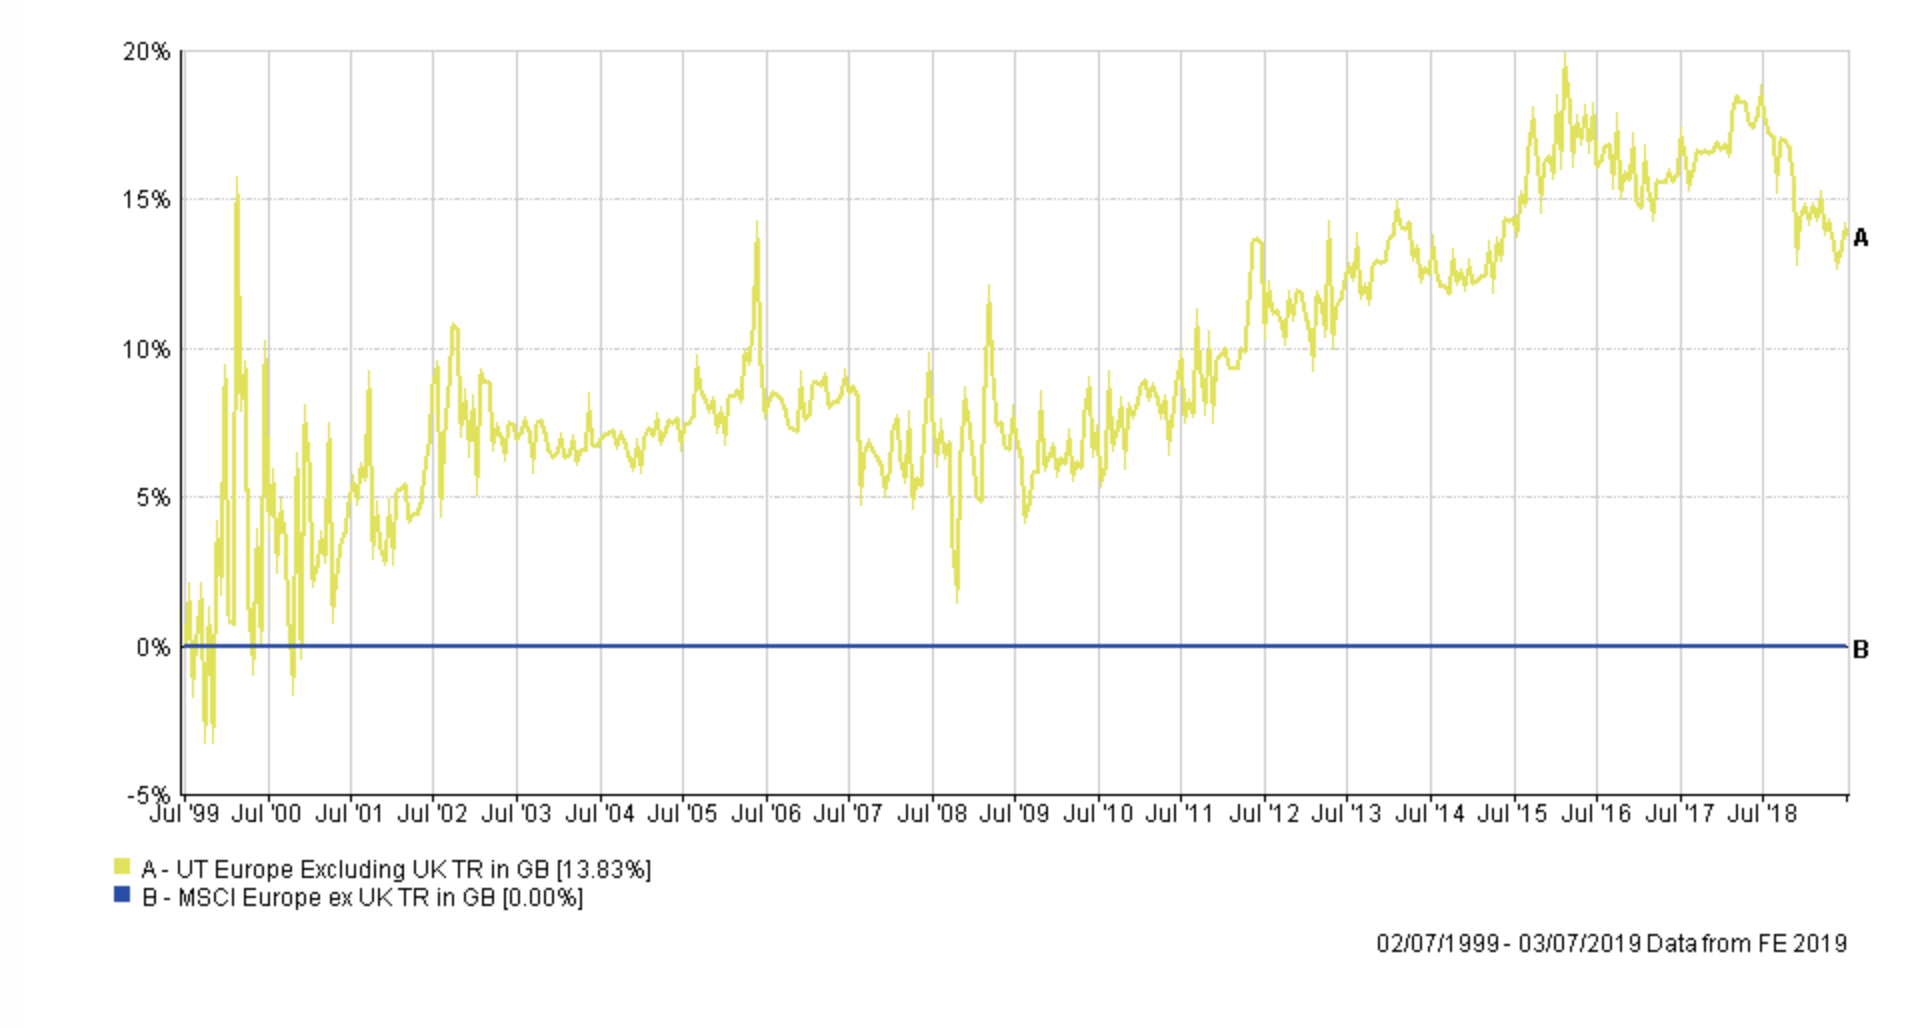
| Europe Excluding UK | MSCI Europe ex UK | 13.83 |
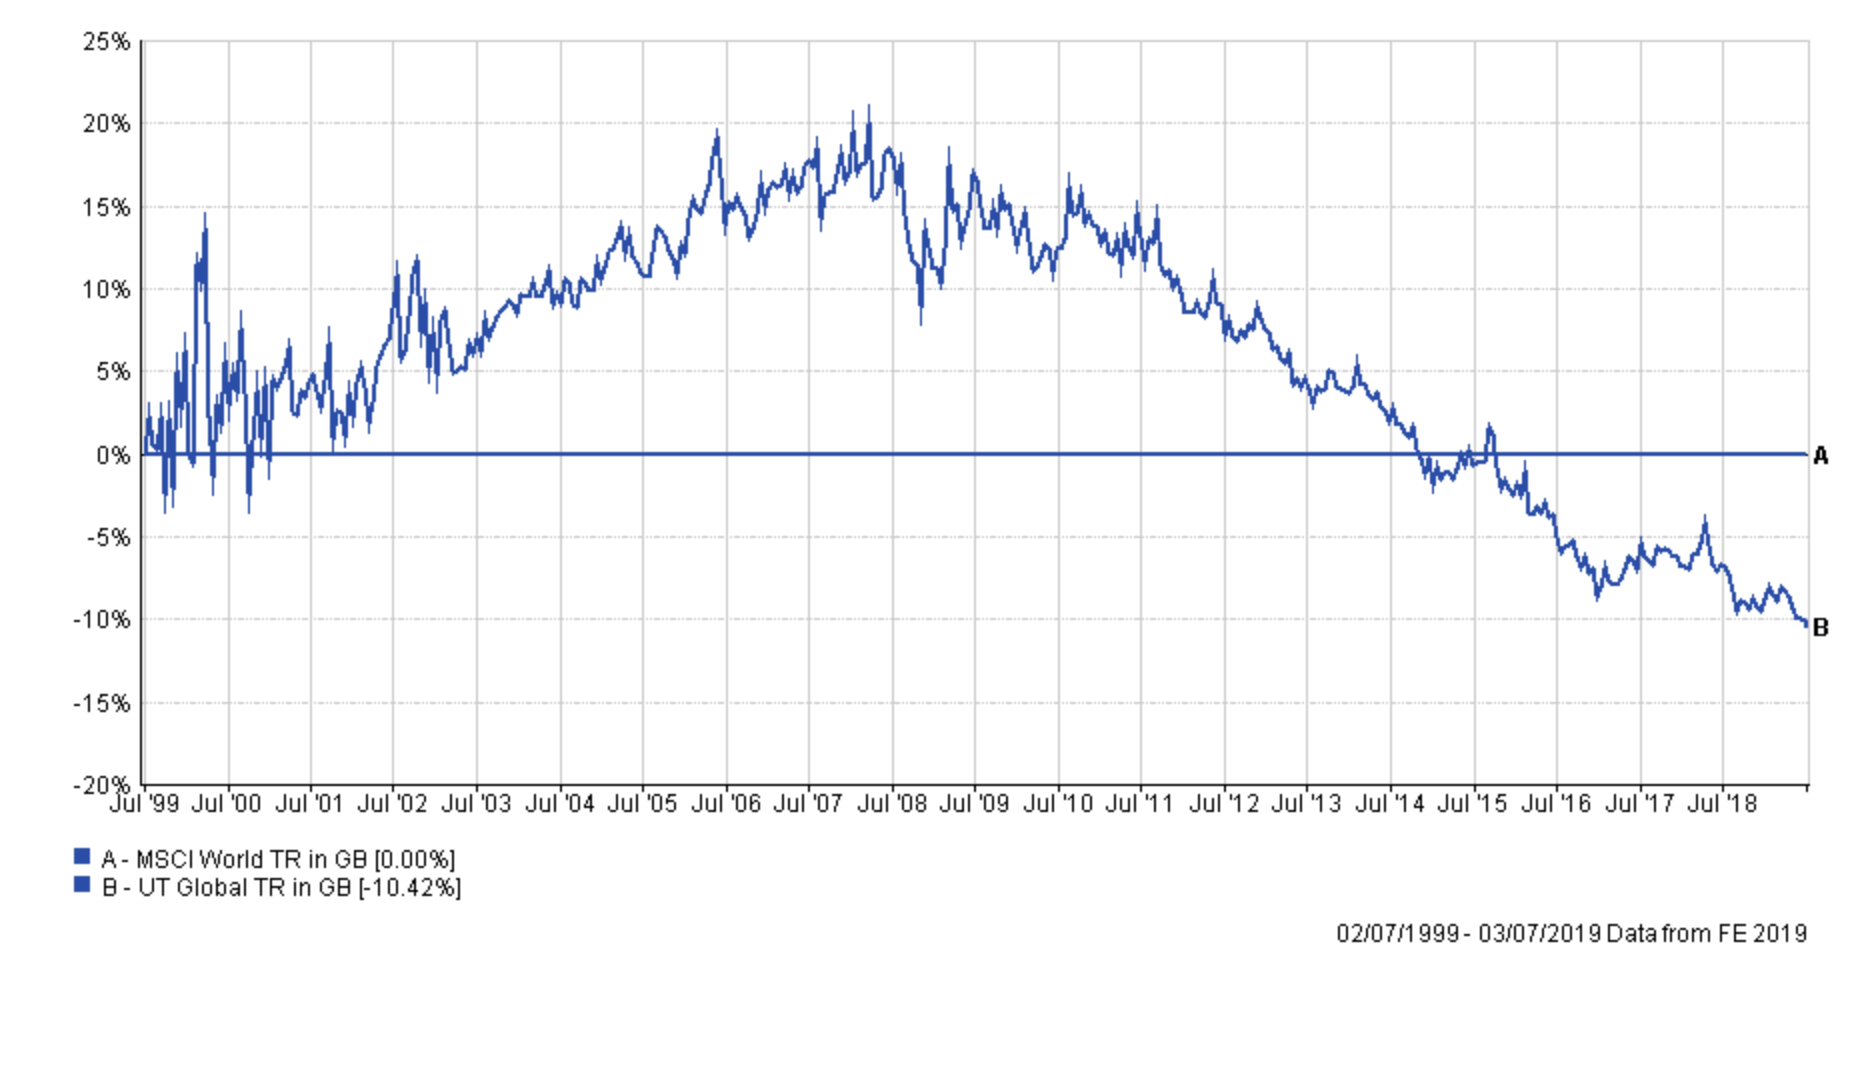
| Global | MSCI World | -10.42 |
| Global Emerging Markets | MSCI Emerging Markets | -10.76 |
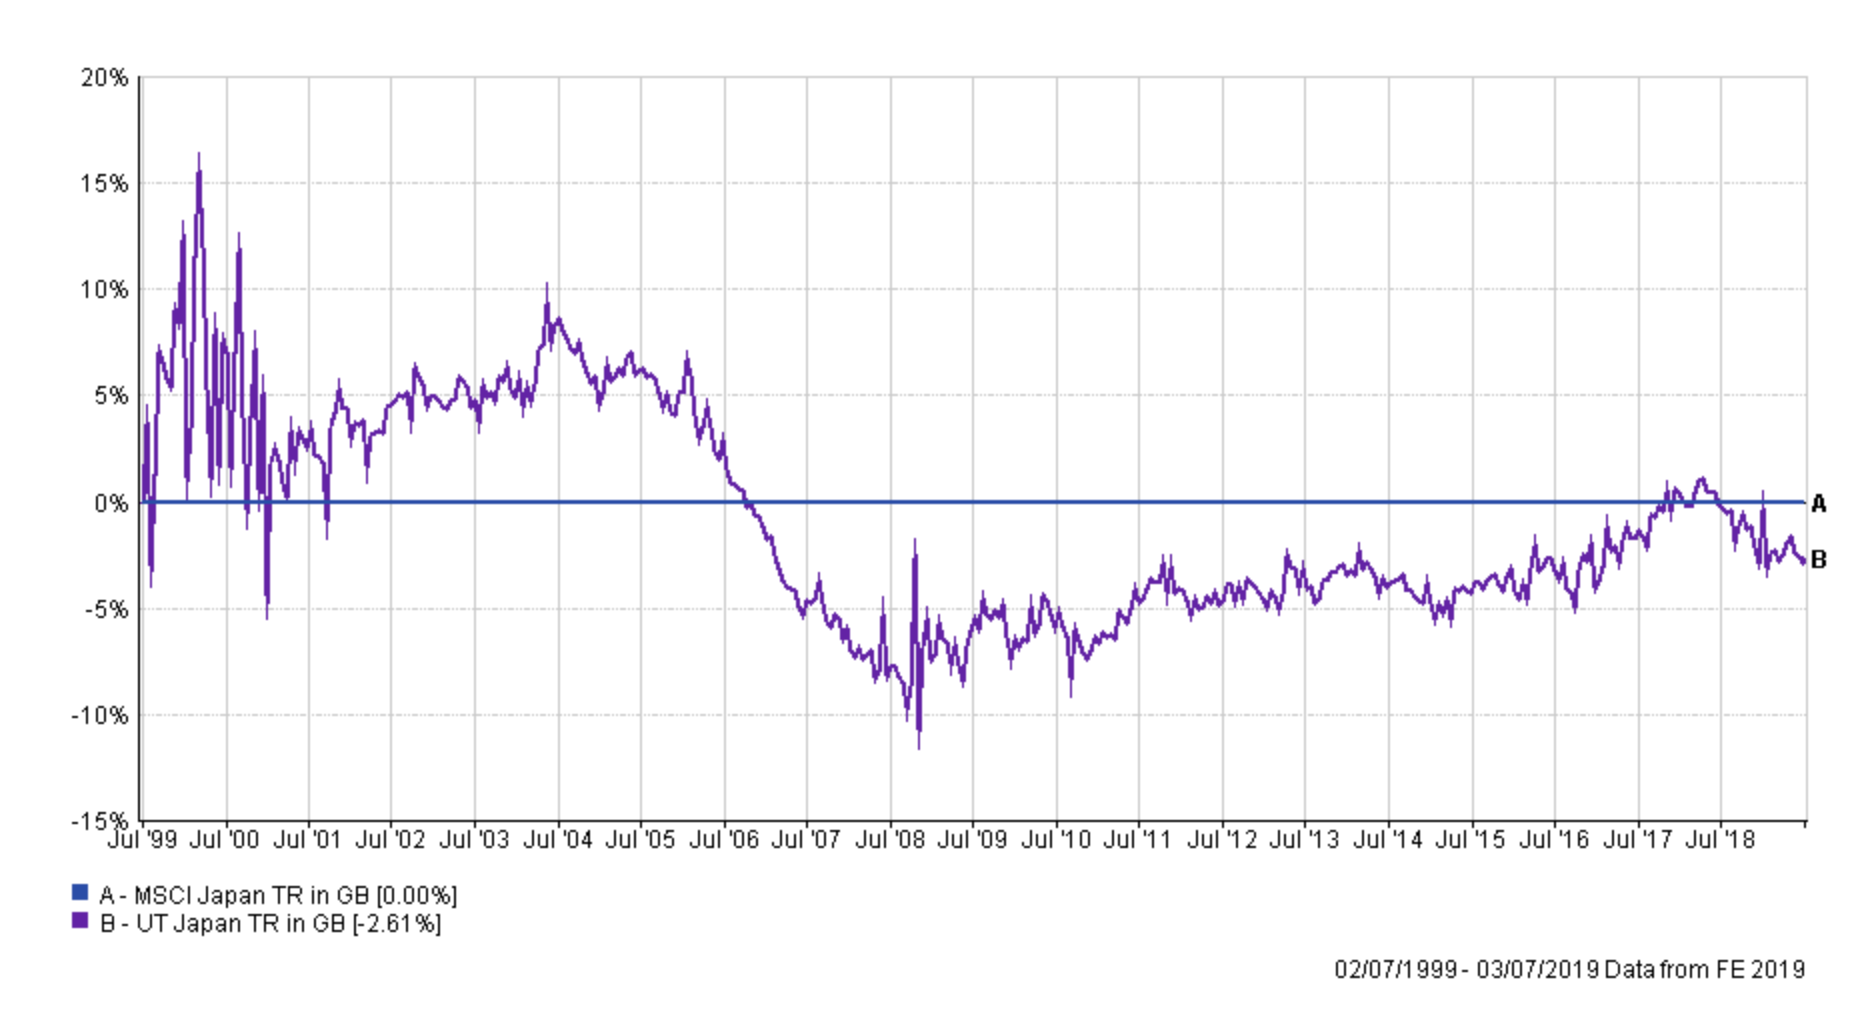
| Japan | MSCI Japan | -2.61 |
| North America | S&P 500 | -11.96 |
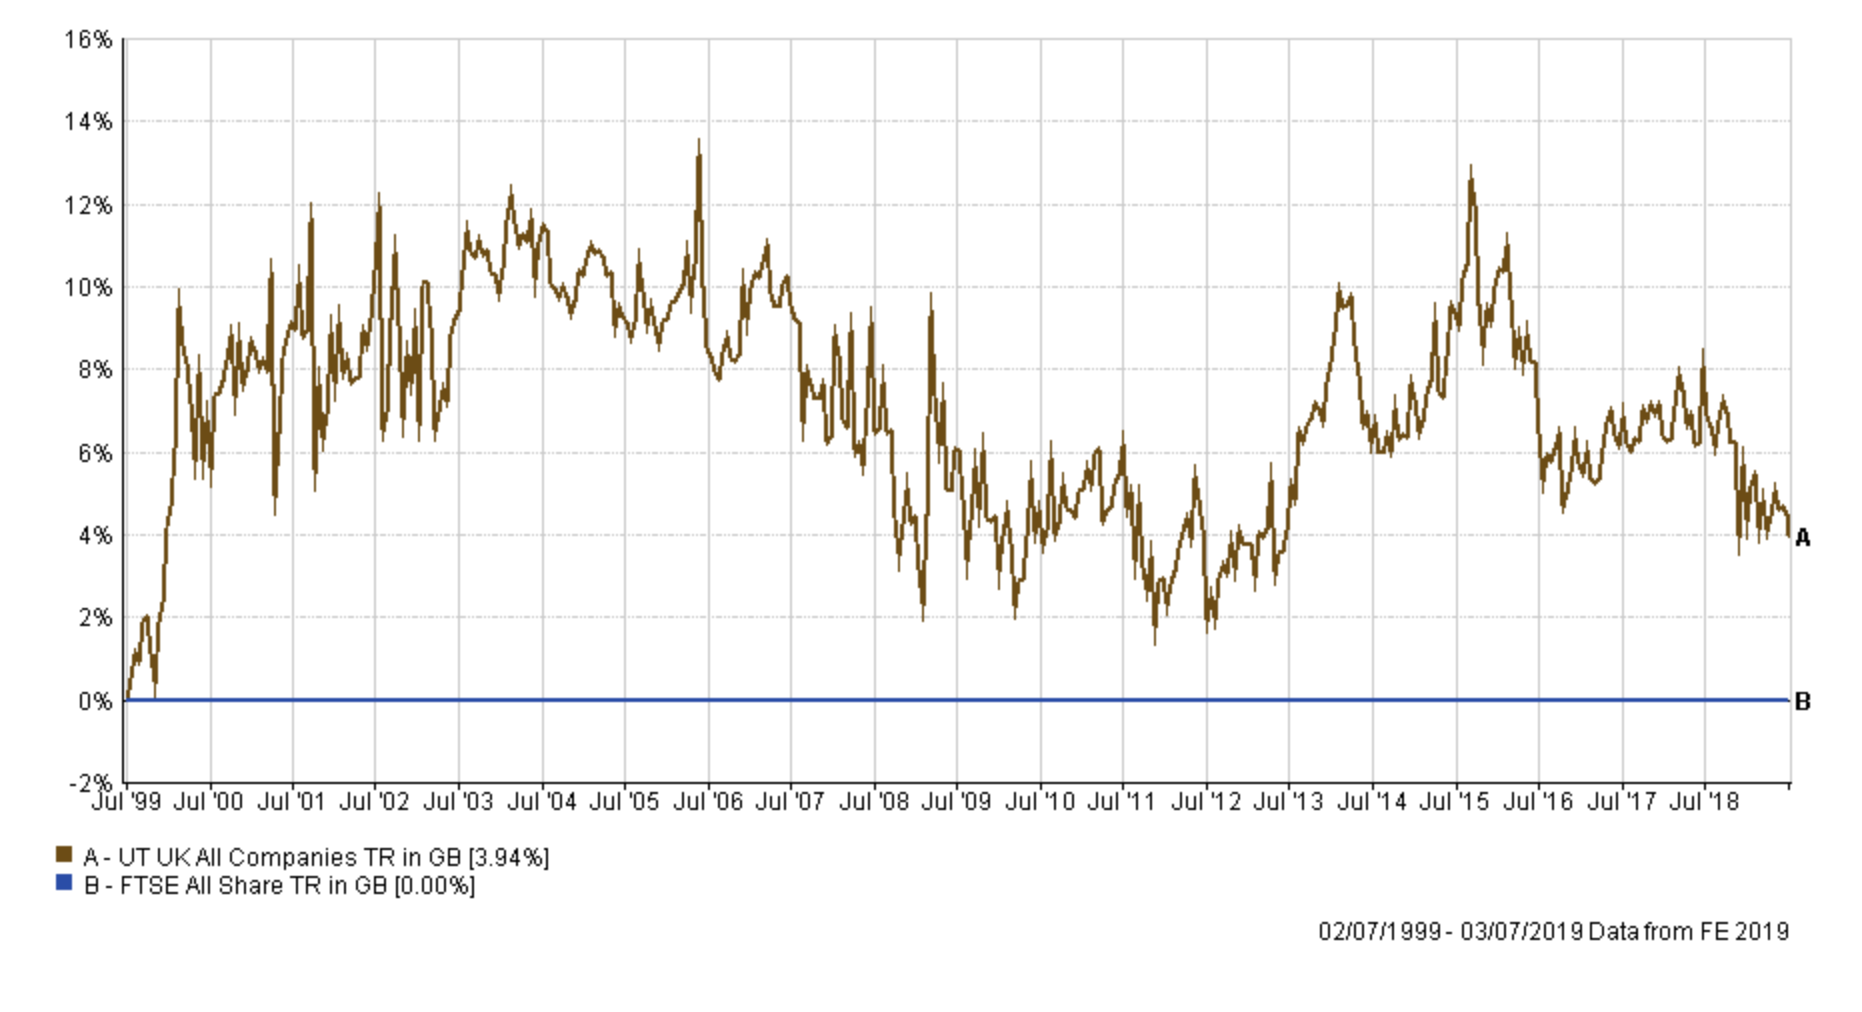
| UK All Companies | FTSE All Share | 3.94 |
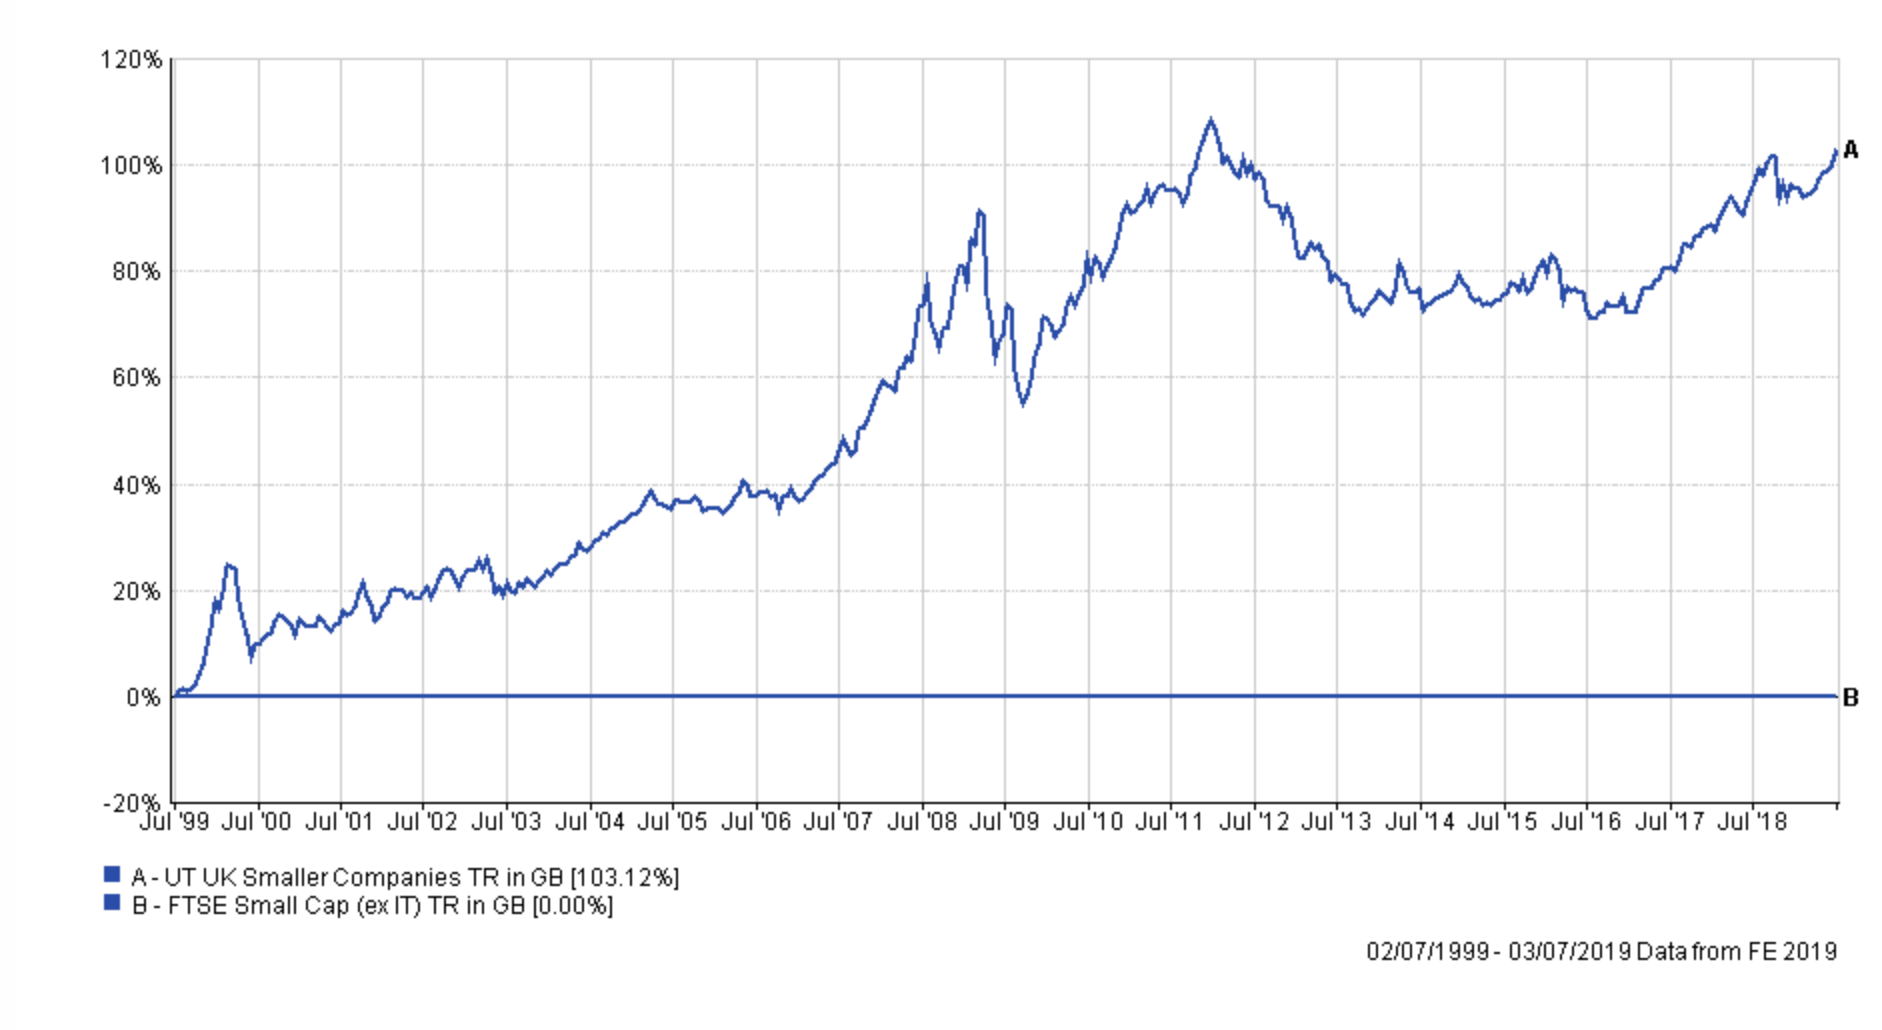
| UK Smaller Companies | FTSE Small Cap (ex IT) | 103.12 |
What immediately jumps out is that active management significantly underperforms passive strategies when investing in US, global and emerging market equities. This will come as a surprise to many but perhaps it shouldn't given this headline on CNBC recently - 'Active fund managers trail the S&P 500 for the ninth year in a row in triumph for indexing'.
It also explains why fund managers from the Global sector also struggle to outperform passive solutions. In my previous research piece 'Finding the best global funds to diversify your portfolio' I analysed the asset mix of a typical global fund and found it was 43% invested in US equities. Most global funds are quasi-US equity funds and so perform (or underperform) alongside active US equity funds.
Interestingly where active managers did add value is in markets closer to home, namely UK and Europen equities. That perhaps makes sense, given that UK fund managers are having to make investment calls on overseas assets. Markets closer to home are likely to have an element of familiarity and accessibility that perhaps investing further afield doesn't.
However, active fund management also adds value in more nuanced and less well-researched areas. Chinese equities are a case in point, but again go too global (emerging market equities) and passive strategies win out. The 'Jack of all trades, Master of none' mantra certainly appears to have a grain of truth when it comes to fund management. But where it really comes into its own is when investing in smaller companies. The outperformance shown in the table above is quite staggering. Being able to pick small companies that become tomorrow's big companies can pay huge rewards if you get it right.
What about the consistency of performance?
The numbers above only give a snapshot of the performance of active versus passive by looking at the 20 year performance figure of one strategy versus another. So I decided to look at how the average active fund for each sector performed versus its passive benchmark over time. I want to see if there is a level of consistency to the (out/under)performance. To do this I charted the relative performance over the entire 20 year period.
So taking North American equities as an example below:
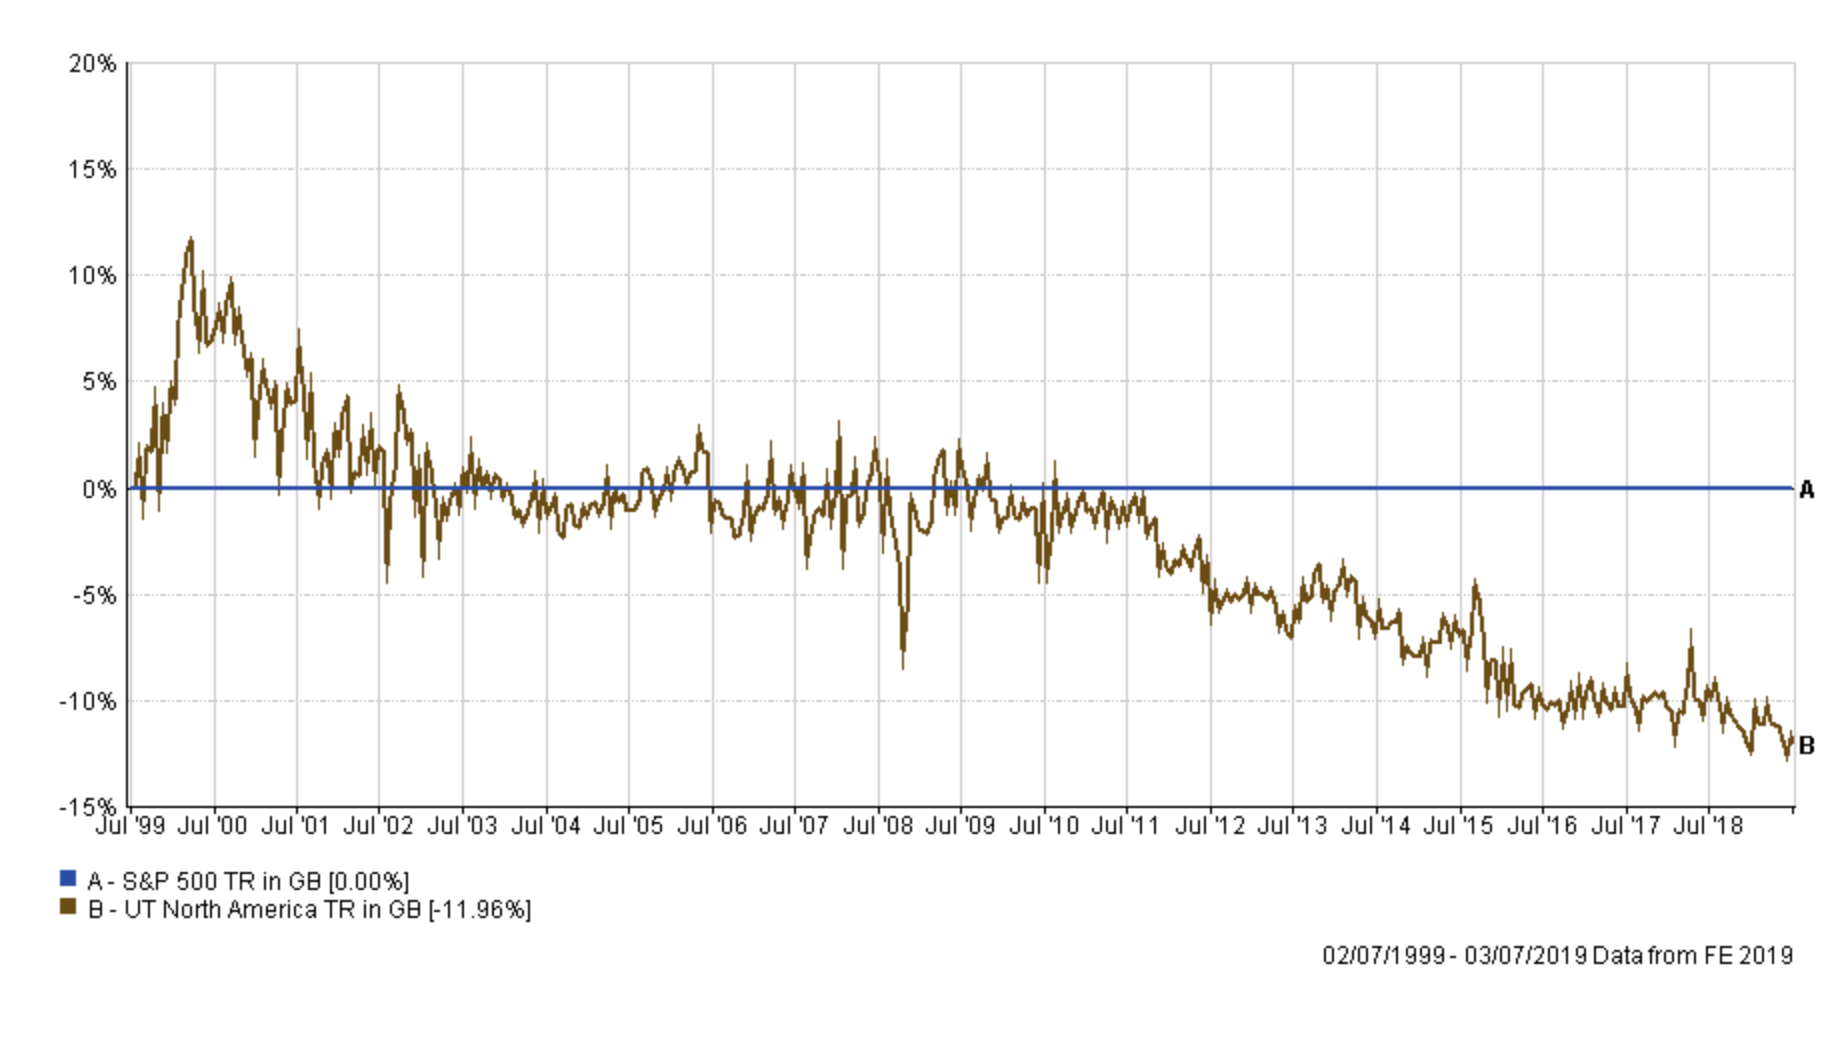
The middle line (the straight x-axis) is the passive benchmark. If the average active fund is outperforming the passive benchmark then the brown line is above the x-axis. If the active fund is underperforming then the brown line is sloping downwards and will fall below the x-axis. So you can see that in the lead up to the dotcom bubble bursting active managers outperformed as they chased the market higher. But they then underperformed once the bubble burst. For the next decade they added no value over a passive solution at all and in the last 8 years they have steadily underperformed the passive benchmark, increasingly so.
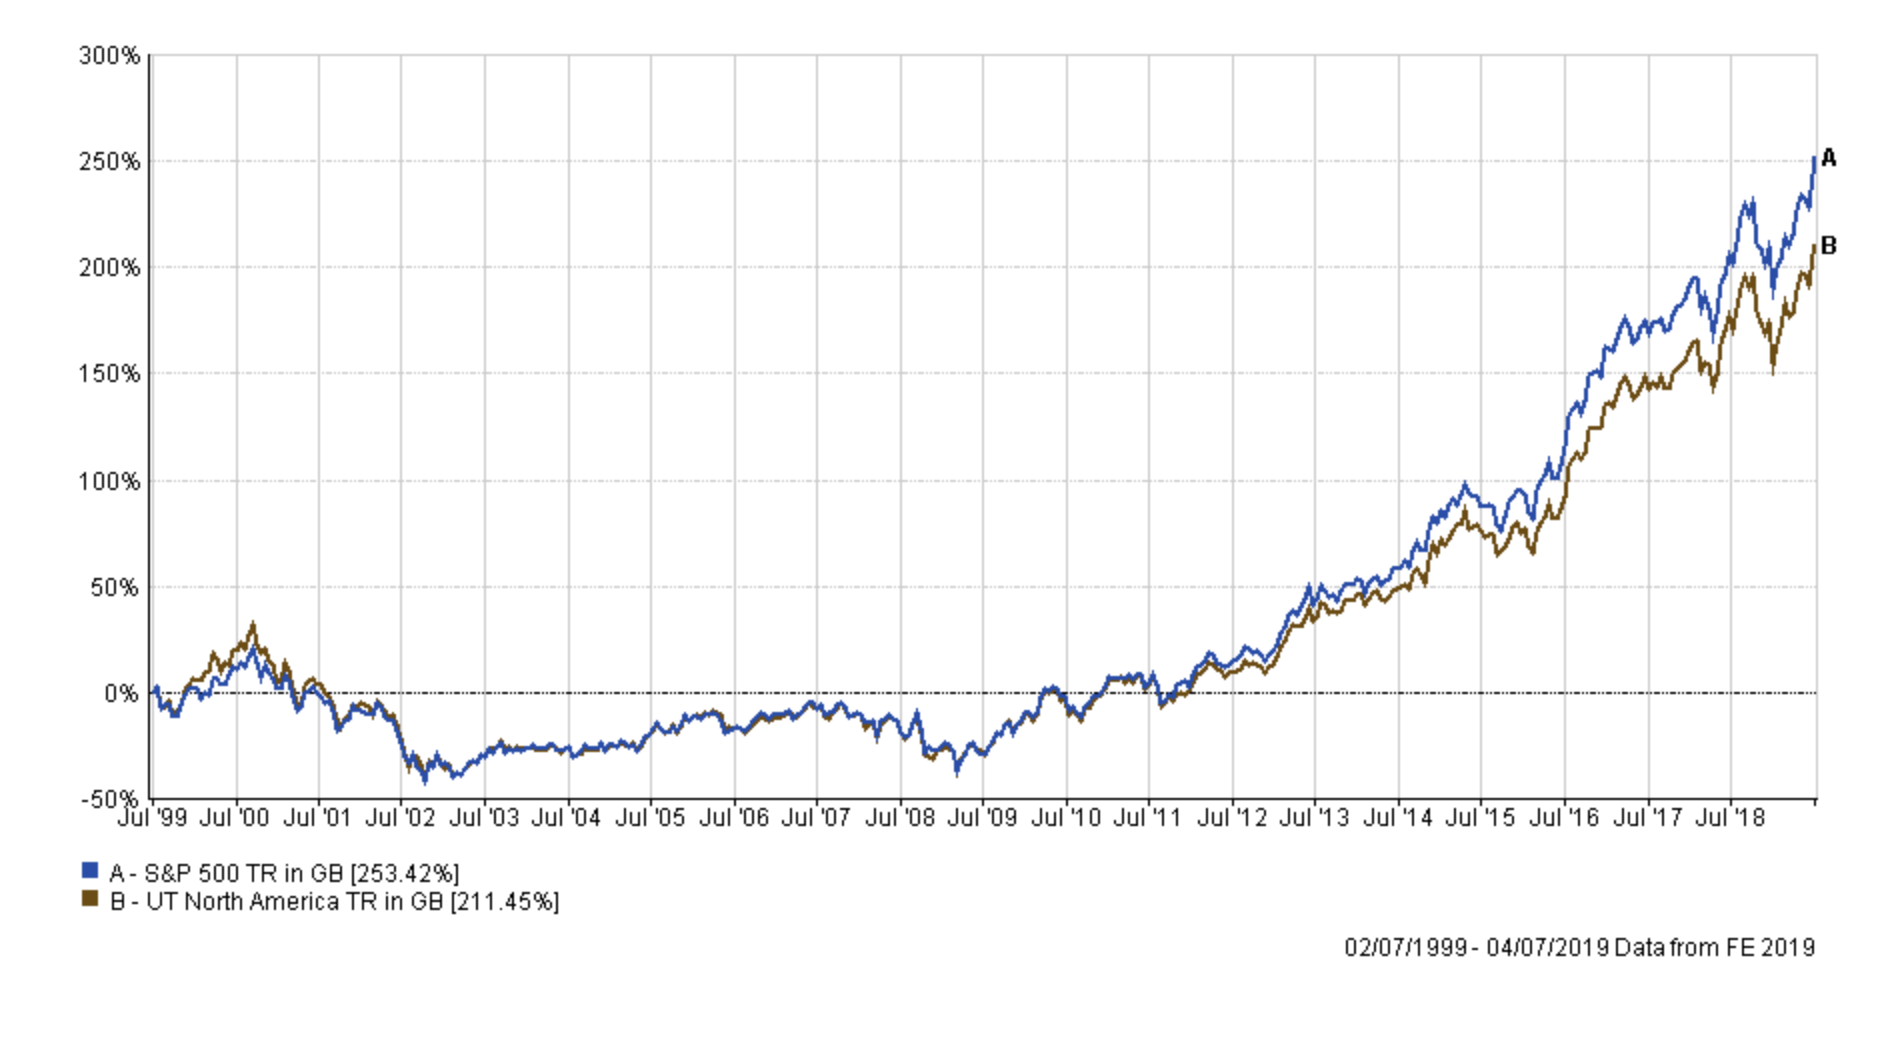
The chart below shows the total return of the North American sector average (the active funds) and that of the S&P 500. You can see how useful the relative performance chart (above) is at identifying when passives and actives outperform each other.
I analysed the consistency of performance for each of the other sectors as shown below:
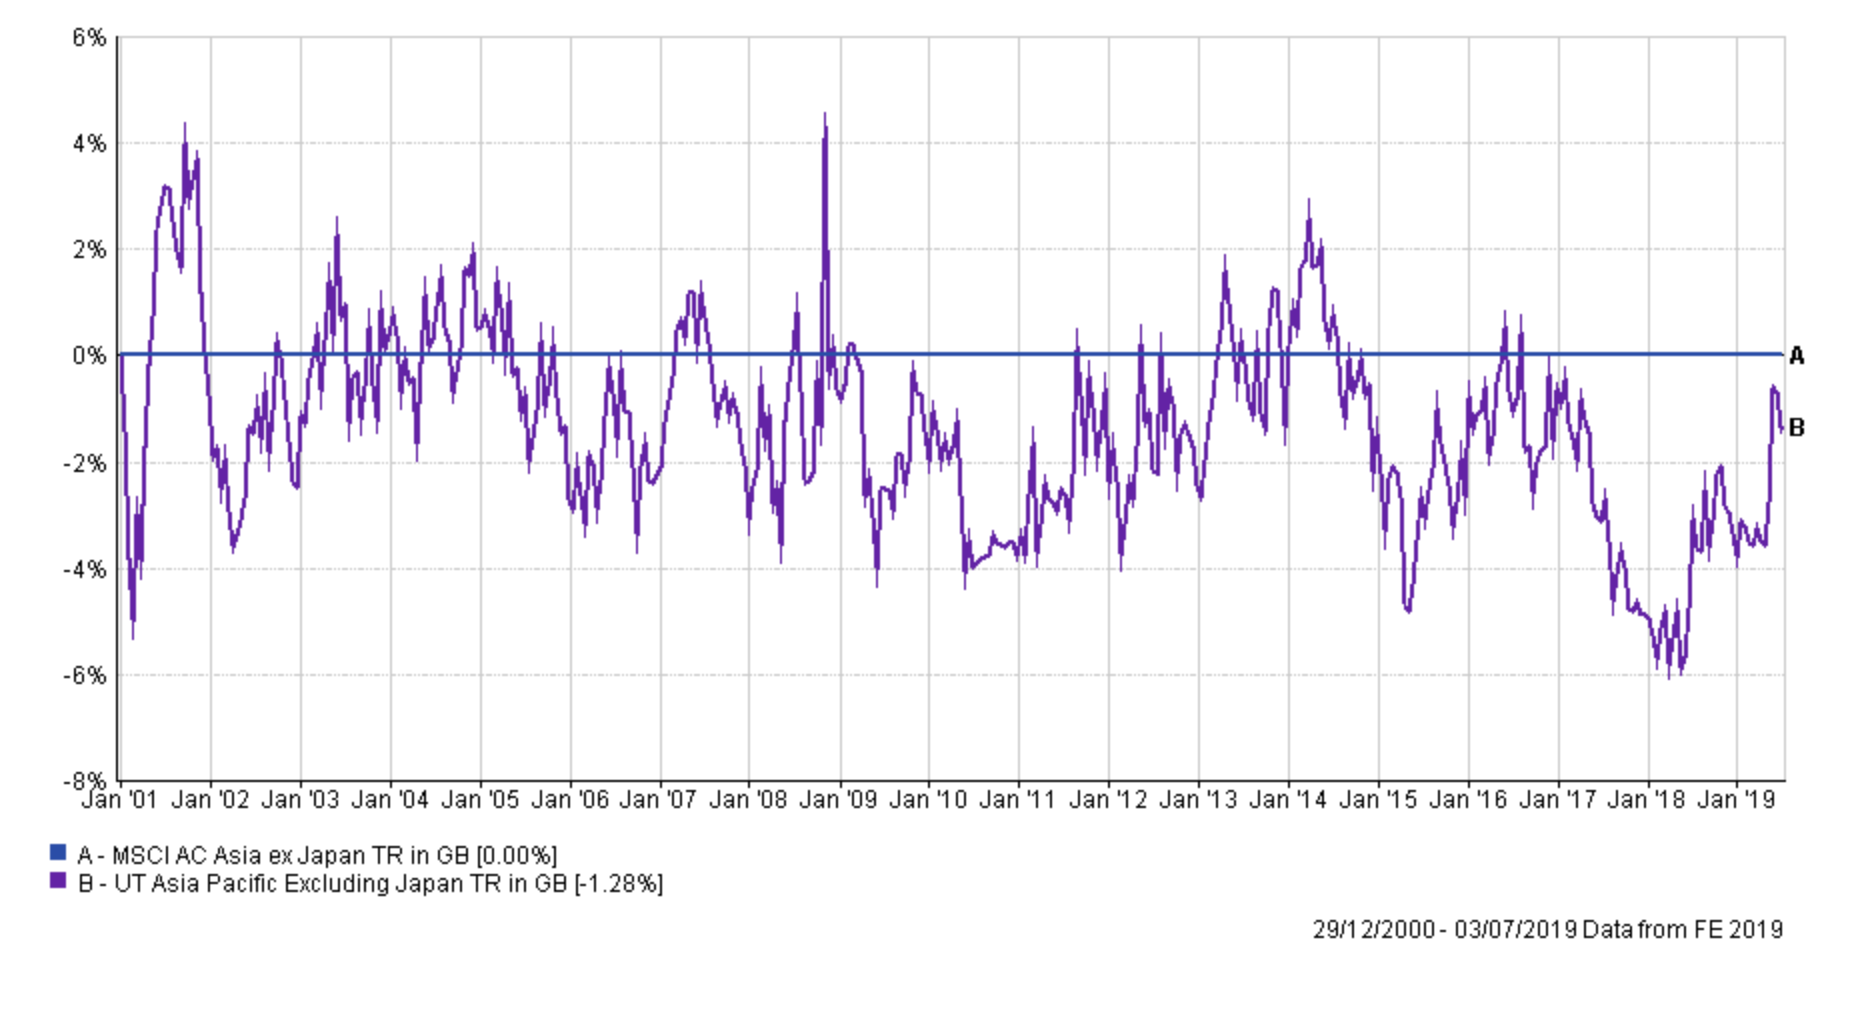
Asia Pacific Excluding Japan
Active managers struggle to beat a passive benchmark
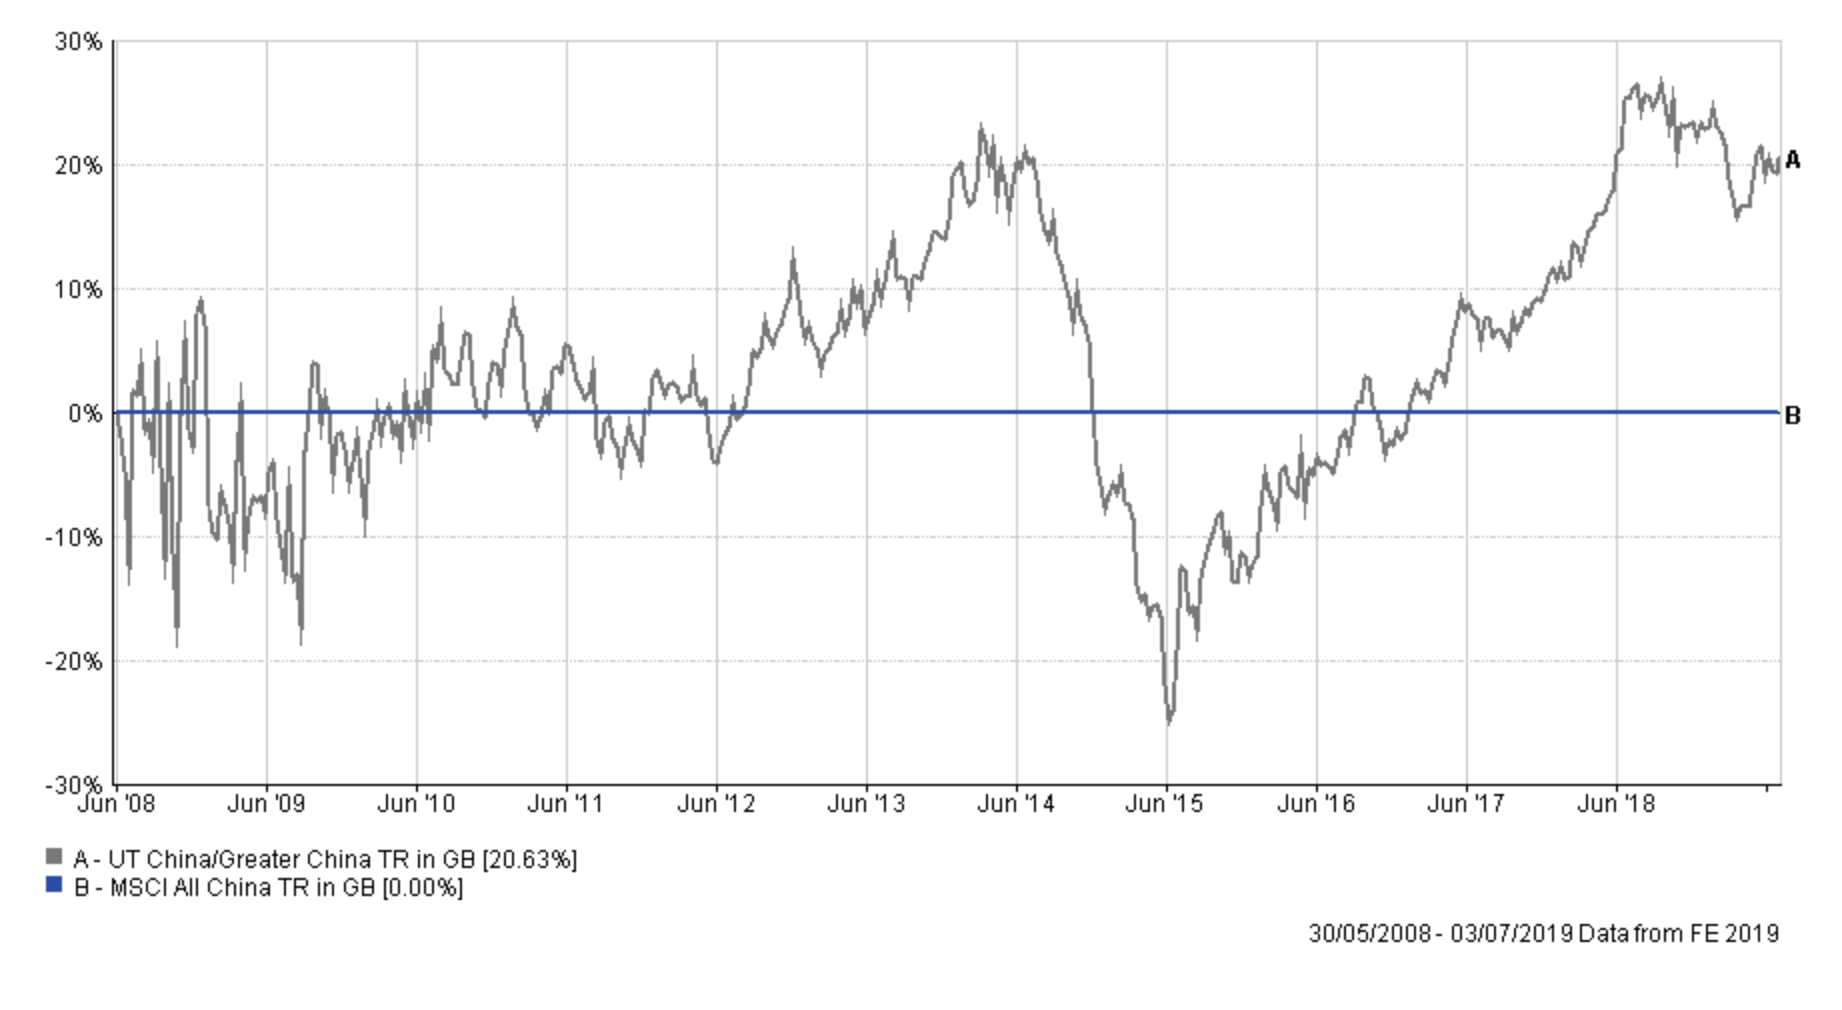
Chinese equities
Active managers tend to outperform Chinese equities and, in fact, outperform in aggressive market sell-offs.
European equities
Active managers consistently outperform passives when investing in European equities.
Global
Global active managers have struggled to compete with a passive strategy since the financial crisis.
The less said about emerging markets the better, but there are signs of improvement
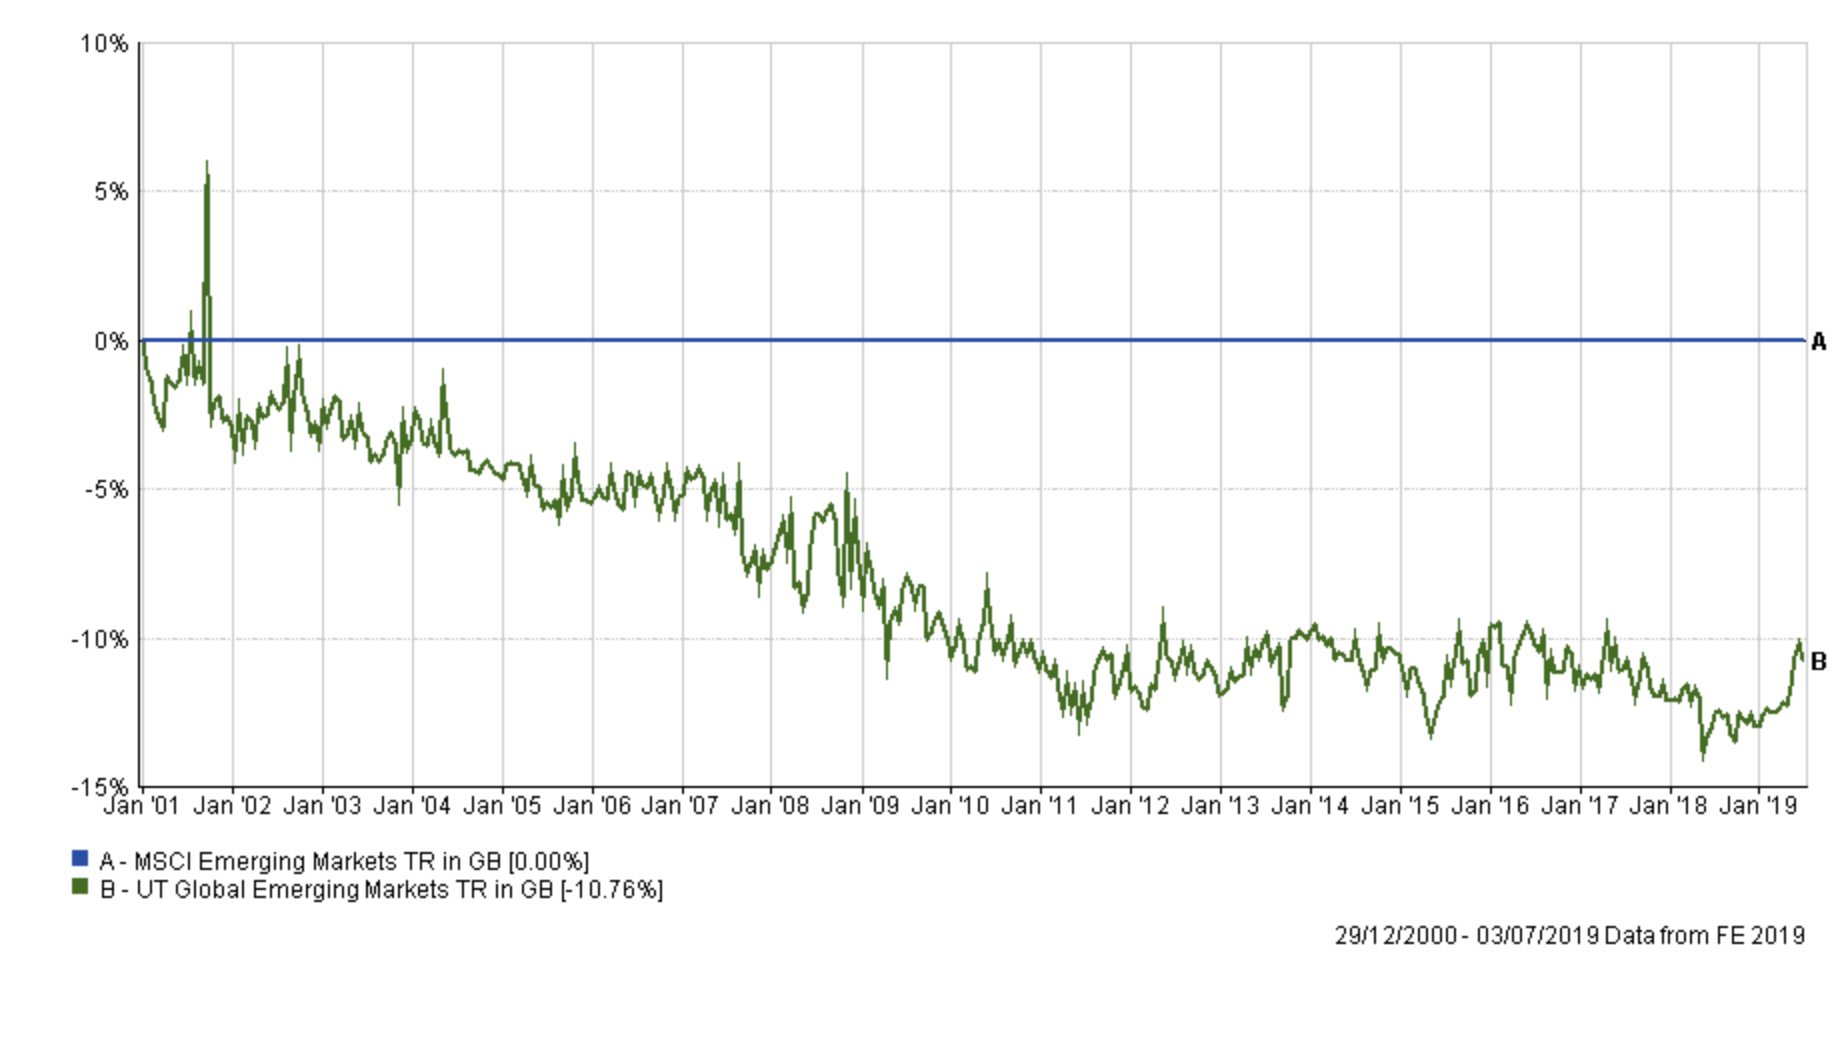
After an abysmal run-up to the financial crisis, active managers are starting to claw back some credibility.
UK All Companies
Active consistently outperforms
UK Smaller Companies
Passive strategies struggle.
Summary
A key takeaway is that the active versus passive debate should never be a binary choice. As the data and charts show, which strategy outperforms depends on the asset, the market and the competition. It also depends on the macro backdrop. As DIY investors we shouldn't blindly follow one strategy, there is merit in using both. Investing in what is working, as we do with 80-20 Investor.
On the occasions where active funds have simply kept pace with a passive benchmark, such as in Asia, it doesn't mean that active funds should be ignored. Remember I have used the sector average return to represent a typical active fund return, so by definition half of the funds in the sector will have done better, and potentially have outperformed the passive benchmark. That's why having a process to identify strong funds is important (such as 80-20 Investor).
Of course, there are some assumptions I've made above. The passive benchmark doesn't have any charges applied (it is an index, not a fund) plus not all funds in each sector are exclusively active funds. There are some passive funds in there too. But these assumptions would not alter the outcome of the research. Ultimately, active management can work, especially in niche areas that aren't well researched such as smaller companies. It gives the manager scope to hugely outperform a generic benchmark but bear in mind, that as Neil Woodford has shown, there is also huge opportunity to get it wrong.

£200 Pension Cashback Offer
Make a qualifying deposit or transfer a pension to our partner Interactive Investor.
- Deposit or transfer a pension of at least £20k and you could earn £200 cashback
- Terms and Fees apply, Capital at risk
- New & Existing customers opening a SIPP
- Offer ends 31st July 2026
Before starting your transfer, check you won't lose any valuable benefits (such as guaranteed annuity rates or a lower protected pension age) and find out what exit fees you might have to pay
