

Last year I produced a piece of research titled 'The Winter Fund Portfolio – exploiting a seasonal trend'. The research was inspired by a recognised phenomenon in investment markets whereby, according to the Stock Market Almanac, the 1st November marks "the start of the strong six-month period of the year for stocks".
There are a whole host of theories as to why this seasonal trend may exist. My research piece produced two Winter fund portfolios which had successfully exploited this seasonal trend over the last 10 years. I named these the:
- Consistent Winter Fund Portfolio
- Aggressive Winter Fund Portfolio
The methodology of how I built these portfolios can be found in the original research piece (see link above). Interestingly, in the November 2020 Chatterbox an 80-20 Investor member asked whether I planned to revisit the Winter Fund Portfolios and review their performance, which is what inspired this update.
To reiterate below are the constituent funds for each portfolio:
Consistent Winter Fund Portfolio
- BlackRock - UK Smaller Companies
- BMO - UK Mid-Cap
- Fidelity - UK Smaller Companies
- Invesco - UK Smaller Companies Equity (UK)
- Liontrust - Special Situations
Aggressive Winter Fund Portfolio
- Fidelity - UK Smaller Companies
- Franklin - UK Mid Cap
- MI - The MI Discretionary Unit
- Slater - Growth
- Unicorn - UK Smaller Companies
Now let's jump straight in and see how the portfolios performed over the last year...
Consistent Winter Fund Portfolio 2019 to 2020
In response to the Chatterbox request I wrote the following:
"I haven’t reviewed the 2019 Winter Fund portfolio, but my sense is that with COVID arriving in February and the massive momentum shift we saw as a result that it will have hampered things. If you recall all equity markets collapsed in Feb/March. It didn’t really matter where you invested. Interestingly we could find ourselves once again with a regime shift, given the news of a potential vaccine, as we head into the Winter of 2020."
The chart below shows the performance of the Consistent Winter Portfolio versus the FTSE 100, FTSE 250 and FTSE 350. 
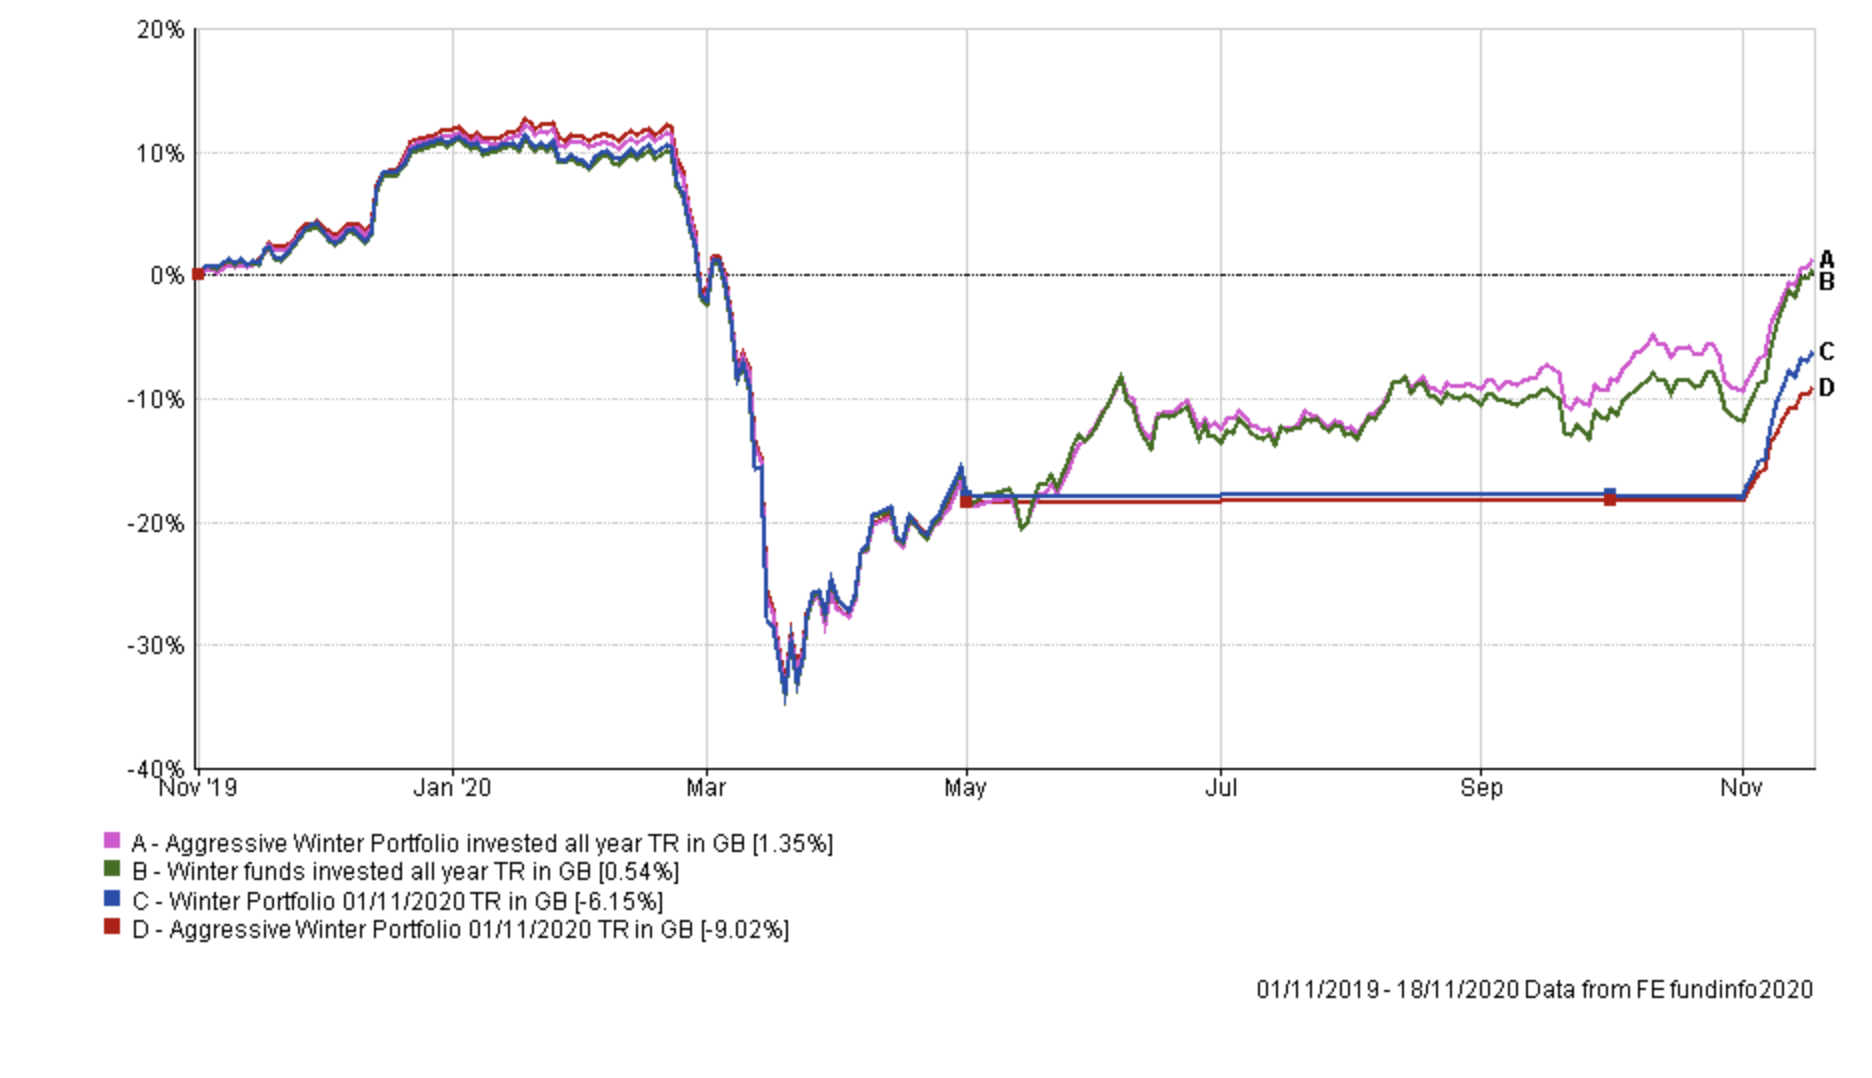
I am actually quite surprised by the result. My instinct was that the Consistent Winter Portfolio would have slumped along with the wider market when COVID-19 hit, which it did. But I also expected that it would have missed the summer rebound in equity markets, being sat in cash. As you can see from the chart the Consistent Winter Portfolio was absolutely flying at the start of January, following the UK election, up over 10%. Then of course COVID-19 caused the market to slump. Interestingly through luck of timing, the Consistent Winter Portfolio captured much of the market rebound in the UK during the spring/summer. Again, somewhat fortuitously the Consistent Winter Portfolio got back into the market days before the Pfizer vaccine was announced, which sent UK equities into orbit.
What is interesting is that the Consistent Winter Portfolio has lagged the FTSE 250 over the last year, however, had you remained in the Consistent Winter Portfolio without reverting to cash over the summer (as per the FTSE 250 example) then your performance would have resembled the dark green line below (i.e you would be in profit) and outperformed.

Now let's look at the performance of the Consistent Winter Portfolio, FTSE 100, FTSE 250 and FTSE 350 since November 2009, which was the starting point of the original piece of research. You can see that the Consistent Winter Portfolio was the best performing portfolio until the pandemic hit.
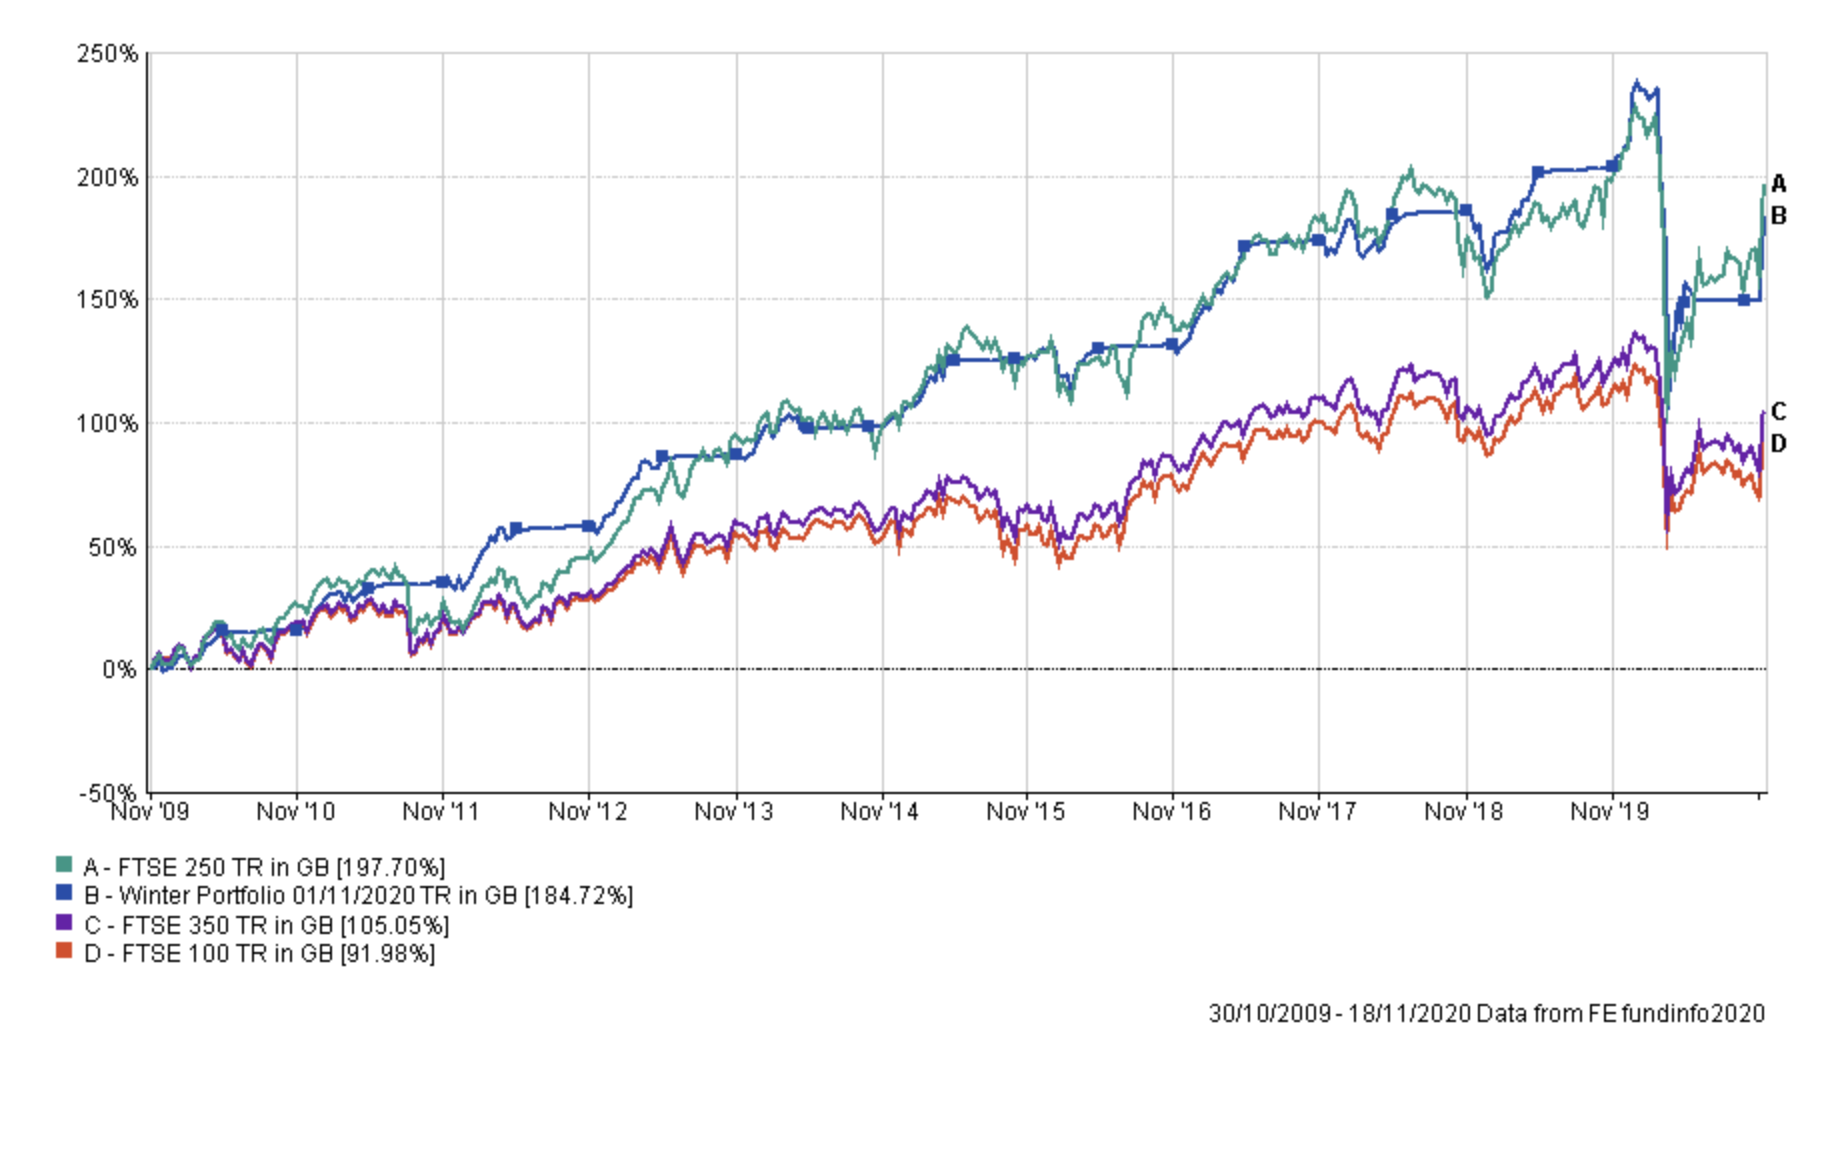
But it's not just the absolute return number that's important. If we look at the key risk/reward statistics (see table below) versus the FTSE 250 benchmark (which is the leading alternative), the alpha generated by the Consistent Winter Fund Portfolio from 1/11/09 to 18/11/20 is still far in excess of the index while the beta (how much a portfolio's movements simply reflect the wider market) is much lower. The volatility of the Consistent Winter Portfolio remains much lower while the Sharpe Ratio (the extra return the portfolio gets for each unit of risk it takes) is far higher. So from a pure absolute return perspective, the Winter portfolio has kept pace with the FTSE 250 (which was continually invested). But from a risk/return perspective, it still wipes the floor with the FTSE 250 because it is invested in cash half of the time. The table below compares the key statistical measures. They are coloured coded by row, with green being the best and red the worst for each statistical measure. Bear in mind that when calculating the alpha and beta measures for each portfolio that the FTSE 250 is used as a benchmark, so the scores for those statistics are relative to the FTSE 250. Hence why the FTSE 250 alpha is 0 and beta is 1.

As a reminder, here is what each statistical measure means...
Alpha
Alpha is a figure which measures a manager’s apparent skill at picking winning investments versus their benchmark. Alpha is the excess return versus the return of a portfolio's benchmark (i.e the market). So a portfolio with a positive alpha indicates that the manager has outperformed through skill. While a negative alpha figure would indicate underperformance. The higher the alpha figure the better
Beta
Beta measures a portfolio's sensitivity to the general market in which it operates. The market always has a beta of 1 by definition. So if a portfolio also has a beta of 1 that would mean that if the market rose by 5% then so should the portfolio. If the portfolio has a beta of -1 then as the market rises so the portfolio falls. A well-managed index fund will have a beta of exactly 1. Portfolios that outperform the market when it does well but do even worse when the market is going down will have a beta above 1.
Maximum Drawdown
This is the biggest fall experienced in a given week.
Sharpe Ratio
The Sharpe Ratio is a measure of the excess return a manager is achieving for the risk they are taking. The higher the Sharpe Ratio the better.
Sortino Ratio
This is very similar to the Sharpe Ratio but places more emphasis on the manager's ability to manage on the downside.
Volatility
This is a measure of a portfolio's dispersion of returns, or in plain English the variability in those returns. Think of it as a measure of how much a building is prone to wobble. The more prone it is (the higher the volatility) the more it will sway in an earthquake.
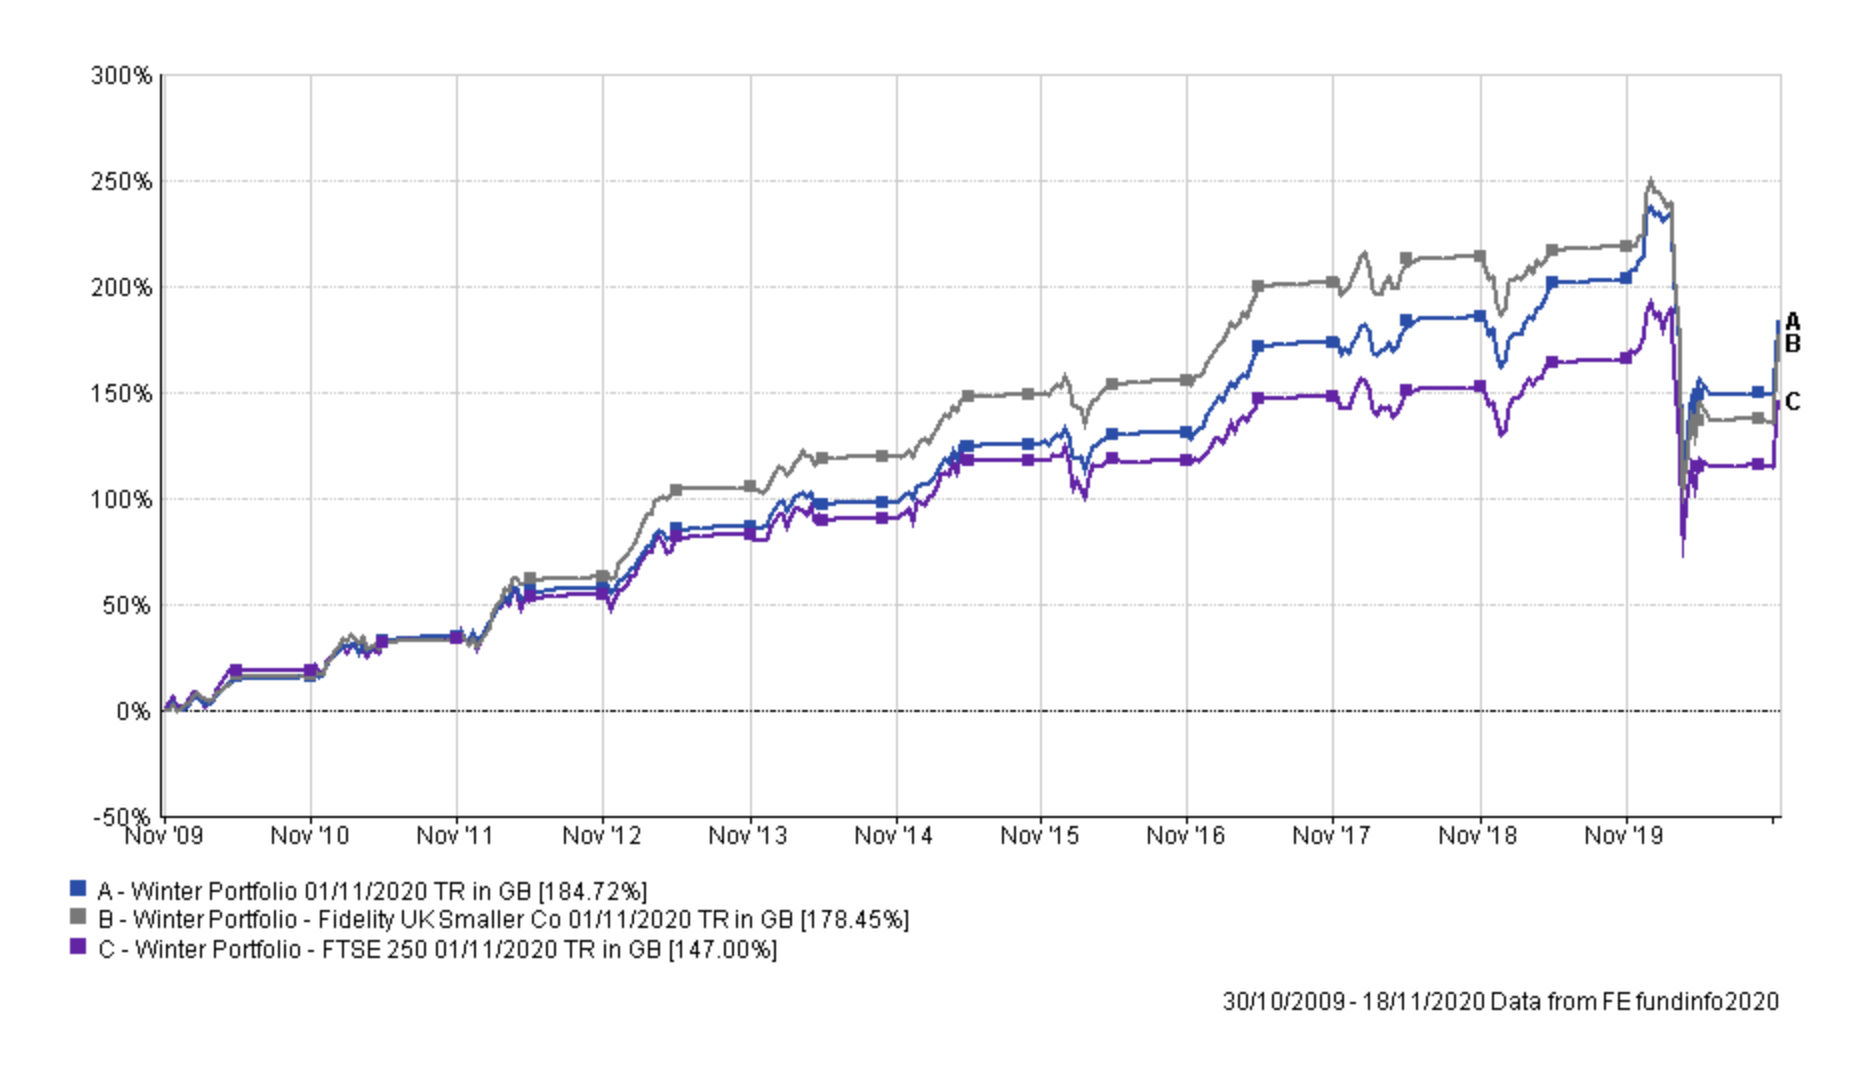
One question that I didn't consider in the original piece of research was whether it was just the winter trend that boosts the Consistent Winter Portfolio or the constituent funds themselves? If you recreate the seasonal portfolio but use just the FTSE 250 instead then you can see that the fund selection makes all the difference. In fact if you recreate the Consistent Winter Portfolio but assume that you only invested in the best performing fund from the original portfolio (Fidelity UK Smaller Companies) you would also outperform the FTSE 250 version of the Winter Portfolio. But, diversification clearly pays. The point is that simply using a FTSE 250 tracker (and moving in and out of cash) to take advantage of the winter trend would produce inferior results.
Aggressive Winter Fund Portfolio 2019 to 2020
But what about the Aggressive Winter Fund portfolio? Well, it struggled in 2020, unless you remained invested all summer.
Over the long term, it is still just outperforming the Consistent Winter Fund Portfolio, but not significantly.

Will this winter be one of the best for the Winter Portfolio?
While the Winter Portfolios struggled this year, this was entirely due to the arrival of COVID-19. Interestingly as we enter the winter of 2021 news of a number of COVID-19 vaccines has seen some aggressive moves in investment markets. As I described in my newsletter titled 'Through the looking glass' we saw a rotation from growth to value stocks, from bonds to equities with one of the biggest beneficiaries being UK equity markets. We also saw a rotation from large caps to small cap stocks. To emphasise the point, the table below shows the performance of each unit trust sector since the Pfizer vaccine announcement on 9th November 2020.
| Sector average | Performance % since 1st COVID-19 vaccine |
| UK Equity Income | 10.56 |
| UK All Companies | 9.21 |
| UK Smaller Companies | 7.84 |
| UK Equity & Bond Income | 5.5 |
| Global Equity Income | 5.42 |
| Property Other | 4.36 |
| Europe Excluding UK | 4.1 |
| North American Smaller Companies | 3.72 |
| European Smaller Companies | 3.53 |
| Mixed Investment 40-85% Shares | 3.24 |
| Europe Including UK | 3.1 |
| Flexible Investment | 2.93 |
| Global Emerging Markets | 2.92 |
| Asia Pacific Excluding Japan | 2.74 |
| Mixed Investment 20-60% Shares | 2.51 |
| Global | 2.46 |
| North America | 1.91 |
| Japan | 1.83 |
| Targeted Absolute Return | 1.42 |
| Sterling High Yield | 1.39 |
| Mixed Investment 0-35% Shares | 1.39 |
| Global EM Bonds Blended | 1.2 |
| Global EM Bonds Local Currency | 1.08 |
| Asia Pacific Including Japan | 1.05 |
| Sterling Strategic Bond | 0.74 |
| Sterling Corporate Bond | 0.3 |
| Global EM Bonds Hard Currency | 0.3 |
| UK Direct Property | 0.01 |
| Global Bonds | -0.2 |
| China/Greater China | -1.14 |
| Technology & Telecommunications | -1.15 |
| UK Gilts | -1.28 |
| Japanese Smaller Companies | -1.59 |
| UK Index Linked Gilts | -2.91 |
UK equities were the best performing sector. If you look at the post-vaccine performance of funds within the UK Smaller Companies sector you will recognise a number of familiar names... including Fidelity UK Smaller Companies.
| Fund | Performance % since 1st COVID-19 vaccine |
| Aberforth UK Small Companies | 16.92 |
| Fidelity UK Smaller Companies | 13.72 |
| Artemis UK Smaller Companies | 12.41 |
| VT Teviot UK Smaller Companies | 12.33 |
| LF Gresham House UK Smaller Companies | 12.2 |
| Jupiter UK Smaller Companies | 11.85 |
| Franklin UK Smaller Companies | 11.46 |
| Janus Henderson UK & Irish Smaller Companies | 10.91 |
| Omnis UK Smaller Companies | 10.84 |
| LF Gresham House UK Micro Cap | 10.54 |
What the original research and this update show is that over the long term you can exploit the seasonality of stock markets. Furthermore you are better off doing it with active funds within the UK smaller companies sector especially rather than using a passive approach (say with either a FTSE 350 or FTSE 250 index tracker). This backs up another piece of 80-20 Investor research that I previously carried out titled 'The sectors where active funds beat passives' which showed that active funds hugely outperformed passive strategies within the UK Smaller Companies sector.
So what we are seeing here is the Winter fund portfolios exploiting two established trends, the seasonality of UK equity markets and the propensity for active managers to outperform passives in the UK small-cap space.
But of course, the concept is not fool-proof as this latest update shows. While Fidelity UK Smaller Companies, for example, is performing well since the vaccine it has struggled so far in 2020. But this winter the Winter Portfolio is particularly interesting in light of the vaccine rotation trade.
In the original piece of research, I reflected on what would have happened if we applied the fund selection process (which is a 10-year backward-looking process) at the start of each year, meaning that the portfolio would change from year to year. However, if we applied the same process this year then the only fund that would make either portfolio would be Liontrust UK Smaller Companies, because of how poorly UK equities have performed in 2020. But that fund has a bid/offer spread (i.e the equivalent to an upfront charge to invest in it) which I would look to avoid in any event, depending on its size. As an aside, other fund houses to watch out for with bid/offer spreads are Blackrock and Legal & General.
If we were to loosen the criteria this year and allow for funds that have had 8 positive winters in the last 10, with a strong average winter performance then the most likely candidates would be among the following funds:
- Liontrust Special Situations
- BlackRock UK Smaller Companies
- ASI UK Smaller Companies
- JPM UK Smaller Companies
- Scottish Widows UK Smaller Companies
- Invesco UK Smaller Companies Equity (UK)
- Aegon UK Smaller Companies
- Liontrust UK Smaller Companies
- TB TB Amati UK Smaller Companies
- BMO UK Smaller Companies
- AXA Framlington UK Smaller Cos
- LF Gresham House UK Micro Cap
- Aviva Inv UK Smaller Companies
- Fidelity UK Smaller Companies

£200 Pension Cashback Offer
Make a qualifying deposit or transfer a pension to our partner Interactive Investor.
- Deposit or transfer a pension of at least £20k and you could earn £200 cashback
- Terms and Fees apply, Capital at risk
- New & Existing customers opening a SIPP
- Offer ends 31st July 2026
Before starting your transfer, check you won't lose any valuable benefits (such as guaranteed annuity rates or a lower protected pension age) and find out what exit fees you might have to pay
