

By now 80-20 Investor members will be accustomed to the fact that I will put my neck on the line based upon my investment research. The aim of this research is always to try and answer those difficult investing questions others shy away from. More importantly the aim is to spark that inquisitive fire within 80-20 Investor members and encourage them to apply it to investing. Or to put it another way, I am trying to teach you to think like an analyst.
However, the word analyst is often mis-used. For me an analyst should behave like a scientist, although rather than carry out experiments in the physical world he/she experiments on investments and data. Often a lot of research you will read in the press starts with a conclusion that the company (or researcher) wants to prove because that conclusion will be a good PR or marketing angle. So the company will ultimately 'prove' whatever it is they set out to. What they are doing, whether intentionally or not, is manipulating the data to show what they want it to show. True analysis doesn't start with a conclusion. At best it starts with a hypothesis which you test and then formulate into a new hypothesis. Eventually you may reach a final conclusion. A key part of how I conduct research is to test a hypothesis to destruction. It often means that a lot of my research never sees the light of day because despite spending days on it I eventually disprove a hypothesis or theory that was beginning to take shape.
Perfect ISA portfolio
Two years ago I carried out a piece of research, using the same process described above, with the aim of trying to work out what the Perfect ISA portfolio is (or whether one even existed). The Perfect ISA portfolio had to adhere to the following rules
- There would be no constraint over which assets could be included or in what proportions they are held
- The portfolio must have made money every tax year since the last market peak back in 2000
- and not lost money
- It had to at least beat a FTSE 100 Index tracker and
- The asset allocation had to remain constant throughout that time
So in essence I wanted to find the perfect 'buy and forget' asset allocation. One which would have achieved the above irrespective of the actual funds you'd bought. So to make sure I was only looking at the asset allocation I always used the sector average return for each asset. My analysis covered 27 sectors (see the original article for the full list).
The number of possible combinations was mind-blowing and it took me two full days to analyse it. I revealed the Perfect ISA Portfolio is split as follows:
- 9% cash
- 71% UK Gilts
- 20% UK Equity Income
How the Perfect ISA portfolio fared in 2016/17 tax year
The chart below (click to enlarge) shows how the three component parts of the Perfect ISA portfolio fared this tax year, taking the average return for each sector. The UK Equity Income sector is in red, UK Gilts is in green and cash in blue.
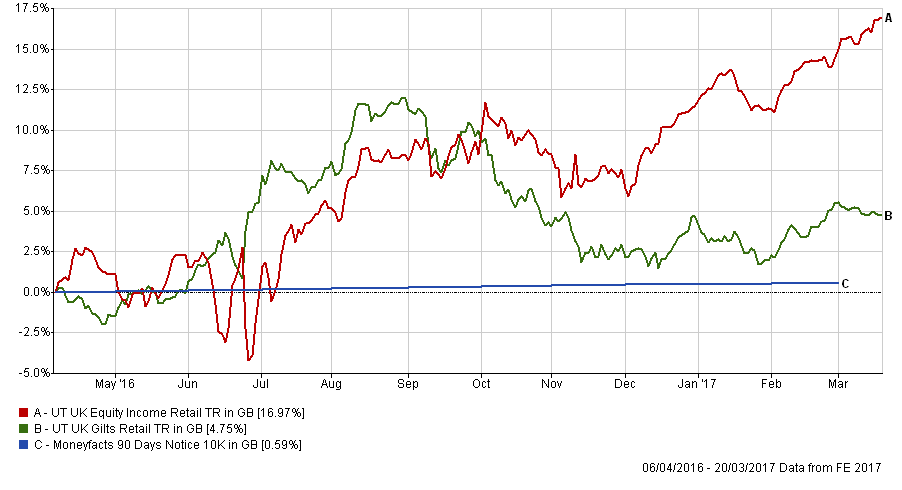
For the 2016/2017 tax year the Perfect ISA portfolio has so far made 7.24%. The table below shows the tax year by tax year returns for the Perfect ISA portfolio as well as those for the FTSE 100. You can see that the Perfect ISA portfolio has made money on paper every tax year since the 2000 market high.
| Tax Year | FTSE 100 return% | Perfect ISA portfolio return % |
| 2000 | -11.13 | 3.23 |
| 2001 | -4.11 | 0.3 |
| 2002 | -24.52 | 0.63 |
| 2003 | 21.3 | 4.69 |
| 2004 | 14.46 | 6.38 |
| 2005 | 26.34 | 10.27 |
| 2006 | 9.37 | 2.47 |
| 2007 | -3.63 | 0.86 |
| 2008 | -29.94 | 0.02 |
| 2009 | 50.49 | 7.71 |
| 2010 | 7.95 | 4.78 |
| 2011 | -1.74 | 9.87 |
| 2012 | 13.44 | 6.83 |
| 2013 | 11.04 | 0.6 |
| 2014 | 5.73 | 10.93 |
| 2015 | -6.35 | 0.79 |
| 2016 | 24.46 | 7.19 |
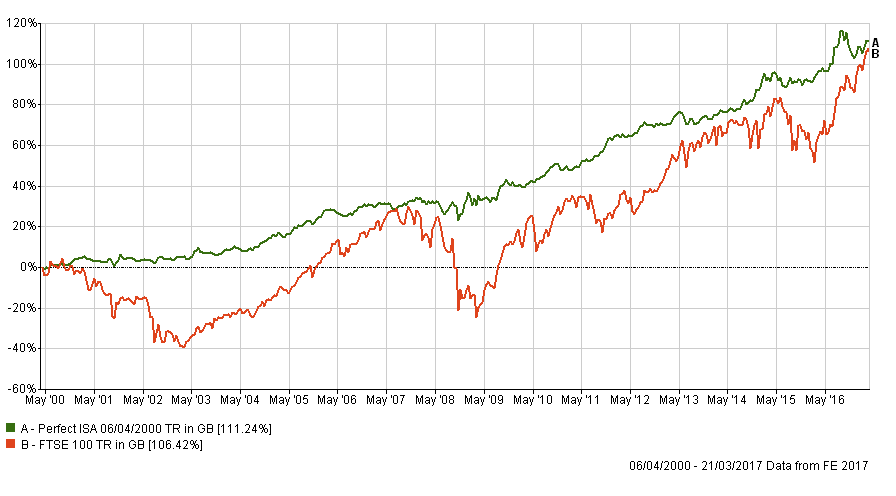
Despite the stellar rally for the FTSE 100 and the collapse of the UK Gilt sector this tax year the chart below shows how the Perfect ISA Portfolio has still outperformed the FTSE 100 since 2000. While the table above shows that the Perfect ISA Portfolio is once again on course to finish in profit this tax year.
The Perfect ISA Portfolio research was always about capturing as much of the upside in equity markets while limiting the downside. The Perfect ISA portfolio is not a cash ISA substitute but the original idea was inspired by the intriguing idea of how to beat cash without losing money in a given tax year. Interestingly the FTSE 100 has closed the gap on the long term return of the Perfect ISA portfolio. However, given that the FTSE 100 is now near all-time highs and that the Perfect ISA Portfolio minimises drawdowns in equity market sell-offs it will be interesting to see how things pan out during the 2016/17 tax year. A sharp equity sell-off will likely see the Perfect ISA portfolio outperform. Conversely a rotation from bonds into equities (as we saw in the aftermath of the US election) will see the Perfect ISA portfolio underperform. In the long run a 100% equity portfolio (such as the FTSE 100) should outperform one such as the Perfect ISA portfolio which has almost 80% of its assets invested in fixed income and cash.
But would have happened if we'd used a momentum strategy like 80-20 Investor to choose the equity funds that the Perfect ISA Portfolio had actually invested in. Don't forget the figures above only assume the average fund return from the respective sectors. The result is that since 6/4/2000 you would have invested £159,560 if you had used your full annual ISA at the start of each tax year. The result of applying 80-20 Investor to the equity content would have been
| Total Invested | £159,560 |
| Perfect ISA portfolio | £239,152 |
| 80-20 Perfect ISA portfolio | £258,047 |
So you would have been nearly £20,000 better off.
So what are the key takeaways from this research
Dynamism is at the heart of 80-20 Investor. By that I mean the ability to review and alter your asset mix and funds to ride the prevailing momentum in markets. However, there are times when investors are constrained by their products and aren't able to switch funds regularly or have a limited fund selection. This week someone in that very situation got in contact. While they use 80-20 Investor to run their SIPP, an old ISA product they hold has prohibitive exit fees and limited fund choice. Their question was could 80-20 Investor be applied to this legacy product. The answer is no, not in its full capacity. However this type of 'buy and hold' research aims to come up with some form of thought out solution for them. It's not ideal but makes the best of a bad situation. 80-20 Investor is not dictatorial and you don't have to just focus on the BOTB funds. The BFBS tables are just as important.
The other takeaway is that 80-20 Investor can be applied to amplify returns on whatever investment asset allocation you want to follow, even one as restrictive as the Perfect ISA portfolio above. Which funds you invest remains the key driver if you want to outperform the market.
This research also shows that over the long term diversifying your portfolio will help limit the downside and doesn't have to eat into your returns. Anyone who had simply invested in a FTSE 100 tracker would have crystallised a loss in the first 5 years if they'd invested at the top of the market in the year 2000. A diversified low risk portfolio would have continually been in profit. This is particularly pertinent now.
If you look at the BFBS tables the UK Gilt sector has been absent for a number of months, which is unsurprising given its underperformance in the second half of 2016. But the figures above have assumed that you buy a typical Gilt fund rather than one suggested by 80 20 Investor. For me it will be interesting to see whether the Perfect ISA portfolio mix will need to be reviewed as the bond rally looks increasingly tired. For now the Perfect ISA portfolio trundles on.

£200 Pension Cashback Offer
Make a qualifying deposit or transfer a pension to our partner Interactive Investor.
- Deposit or transfer a pension of at least £20k and you could earn £200 cashback
- Terms and Fees apply, Capital at risk
- New & Existing customers opening a SIPP
- Offer ends 31st July 2026
Before starting your transfer, check you won't lose any valuable benefits (such as guaranteed annuity rates or a lower protected pension age) and find out what exit fees you might have to pay
