

The concept of the "Efficient Frontier" was introduced by Harry Markowitz in 1952 and is an important part of modern portfolio theory. It can be used to help investors construct portfolios that offer the highest possible returns for a given level of risk.
What is the Efficient Frontier?
The Efficient Frontier is a graphical representation of the optimal portfolios that offer the highest expected return for a given level of risk based on historical evidence. In essence, it’s a curve on a graph where:
- The x-axis represents risk, typically measured by the portfolio’s standard deviation (or volatility). It shows increasing levels of risk as we move to the right.
- The y-axis represents return, usually measured as the annualised return of the portfolio over a period of time.
Here is a hypothetical example:
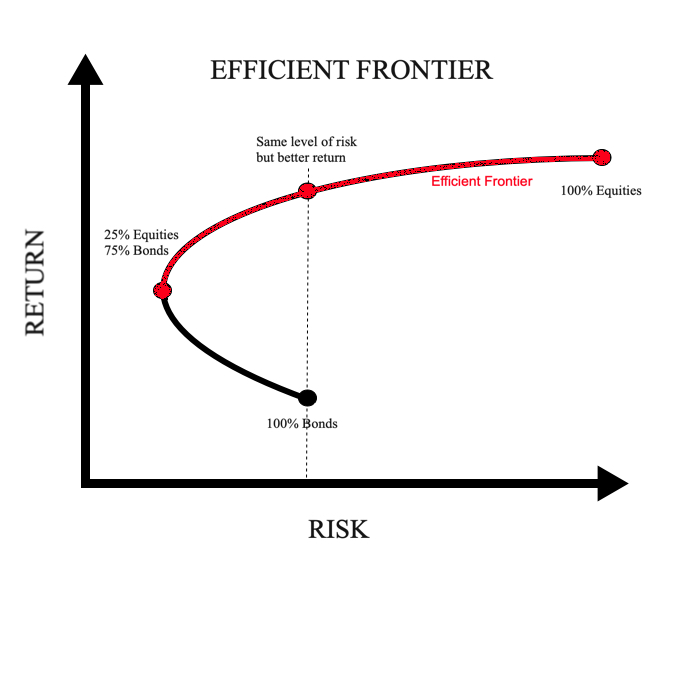
The image demonstrates the concept of the Efficient Frontier, where different portfolio combinations are plotted based on their risk and return characteristics. In the hypothetical example:
100% Bonds Portfolio: This portfolio is positioned towards the lower-left corner of the graph, indicating low risk and low return. Bonds are generally 'safer' but offer lower returns.
25% Equities and 75% Bonds: A portfolio with 25% equities and 75% bonds actually reduces risk compared to a 100% bond portfolio but offers better returns due to the equity component.
Efficient Frontier Curve: The red curve represents the Efficient Frontier, showing optimal portfolios that offer the best returns for the lowest risk. As we move from left to right along this curve, risk increases alongside potential returns.
100% Equities: A portfolio composed entirely of equities is positioned on the far right of the curve. It offers the highest expected return but comes with the highest risk.
Same Level of Risk but Better Return: The dotted line emphasises that there is a portfolio on the Efficient Frontier that offers a higher return for the same level of risk compared to a less efficient portfolio. Investors can optimise their portfolios to achieve better returns without increasing risk unnecessarily.
Investors, based on their risk tolerance, would ideally aim to position themselves on the Efficient Frontier. For conservative investors, portfolios with less risk (closer to the left side of the curve) may be more suitable, while risk-seeking investors may prefer portfolios further along the right side of the curve, where the risk is higher but so are the potential returns.
Applying the Efficient Frontier methodology
Applying the Efficient Frontier analysis isn't easy and requires a computer programme to run the calculations. However, I used Efficient Frontier analysis to produce 4 efficient portfolio asset mixes based upon two chosen levels of risks over 5 years and 10 years. To identify these I used the average annualised volatility of funds within the Mixed Investment 20-60% Shares and Mixed Investment 40-85% Shares sectors. The first sector I used as a proxy for a Cautious multi-asset portfolio, while the latter I used as a proxy for a Medium risk multi-asset portfolio.
Here is a summary of some key statistics in relation to both sectors.
| Sector | 5 year average annualised return | 5 year average annualised volatility | 10 year average annualised return | 10 year average annualised volatility |
| Mixed Investment 20-60% Shares | 2.69% | 8.05 | 3.55% | 6.76 |
| Mixed Investment 40-85% Shares | 4.71% | 10.37 | 5.44% | 9.01 |
Most Efficient Frontier analysis only involves bonds and equities, but I wanted to extend my analysis to include 15 sectors/assets. So when calculating the Efficient Frontier for the two chosen risk levels I included the sectors/assets listed below. The numbers in brackets are the maximum allocations that I would permit for that sector. So for example, the maximum allocation for gold could not be more than 10%, which is in keeping with my past research on the optimum allocation to gold. Meanwhile, there was no minimum allocation for an asset or sector allocation meaning that an asset could only be included if it optimised the efficiency of the portfolios. Also when calculating the portfolio's historical annualised return I've assumed the sector average for each asset class.
Assets/sectors included:
- Asia Pacific Excluding Japan (15%)
- China/Greater China (5%)
- Commodity/Natural Resources (15%)
- Europe Excluding UK (20%)
- Gold (10%)
- Global Bonds (15%)
- Global Emerging Markets (15%)
- India (5%)
- Japan (15%)
- Latin America (5%)
- North America (20%)
- Property Other (15%)
- Cash (15%)
- Sterling Corporate Bond (20%)
- UK All Companies (20%)
- UK Gilts (15%)
I was able to produce a cautious asset mix and a medium risk asset mix based on performance data over the last 5 years and the last 10 years.
Most efficient asset mixes over the last 10 years
| Asset class | Cautious asset mix | Medium asset mix |
| Asia Pacific Excluding Japan | - | 15% |
| China/Greater China | - | - |
| Commodity/Natural Resources | - | - |
| Europe Excluding UK | 12% | 15% |
| Global Bonds | 15% | - |
| Global Emerging Markets | - | - |
| Gold | 10% | 10% |
| India | 5% | 5% |
| Japan | 15% | 15% |
| Latin America | - | - |
| North America | 20% | 20% |
| Property Other | - | - |
| Cash | 15% | 10% |
| Sterling Corporate Bond | 8% | - |
| UK All Companies | - | 10% |
| UK Gilts | - | - |
| Total equity content | 52% | 80% |
| Annualised volatility
(benchmark average in brackets) |
6.76
(6.76) |
9.01
(9.01) |
| Annualised return
(benchmark average in brackets) |
7.98%
(3.55%) |
8.89%
(5.44%) |
| Benchmark used | Mixed Investment 20-60% Shares average | Mixed Investment 40-85% Shares average |
Most efficient asset mixes over the last 5 years
| Asset class | Cautious asset mix | Medium asset mix |
| Asia Pacific Excluding Japan | 8 | 11 |
| China/Greater China | - | - |
| Commodity/Natural Resources | - | - |
| Europe Excluding UK | 20 | 20 |
| Global Bonds | 7 | - |
| Global Emerging Markets | - | - |
| Gold | 10 | 10 |
| India | 5 | 5 |
| Japan | 15 | 15 |
| Latin America | - | - |
| North America | 20 | 20 |
| Property Other | - | - |
| Cash | 15 | 4 |
| Sterling Corporate Bond | - | - |
| UK All Companies | - | 15 |
| UK Gilts | - | - |
| Total equity content | 68% | 86% |
| Annualised volatility
(benchmark average in brackets) |
8.05
(8.05) |
10.37
(10.37) |
| Annualised return
(benchmark average in brackets) |
7.19%
(2.69%) |
7.87%
(4.71%) |
| Benchmark used | Mixed Investment 20-60% Shares average | Mixed Investment 40-85% Shares average |
Summary
As you can see the Efficient Frontier massively improved the annualised return without taking any more risk than the respective benchmarks used, namely the Mixed Investment 20-60% Shares and Mixed Investment 40-85% Shares sector averages. Of course there is no guarantee that the above asset mixes will be the most efficient going forward. It is also worth pointing out that the evidence shows how much the optimum asset mix changes over time. The most efficient portfolios over 5 years are different to the most efficient portfolios over 10 years, for both the cautious and the medium risk asset mixes. That's because recent history has a major influence on the shorter 5 year time frame, which is why bond exposure is almost absent from the 5 year optimum cautious portfolio.
But one big takeaway is the importance of gold over both timeframes as a diversifier. However, few professionally managed funds have any exposure to gold. Also the evidence shows how increased equity exposure doesn't automatically mean increased risk. While I've assumed that the Efficient Portfolios only achieve the average return for the sectors/assets contained within them there is, of course, the ability to diversify and manage risk further through the underlying fund selection.
If I changed the max allocation constraints then the results would be different. For example, if there was no US equity exposure constraint then the efficient portfolios would have large allocations to that sector, due to the outperformance of US tech shares. But the aim of the research was to provide insight into what constitutes a well diversified asset mix and how to optimise risk vs return. Allowing the portfolio to be overweight in specific assets/sectors would not produce well diversified portfolios.

£200 Pension Cashback Offer
Make a qualifying deposit or transfer a pension to our partner Interactive Investor.
- Deposit or transfer a pension of at least £20k and you could earn £200 cashback
- Terms and Fees apply, Capital at risk
- New & Existing customers opening a SIPP
- Offer ends 31st July 2026
Before starting your transfer, check you won't lose any valuable benefits (such as guaranteed annuity rates or a lower protected pension age) and find out what exit fees you might have to pay
