

I always try to encourage 80-20 Investor members to start discussions or ask questions of me and other members via Chatterbox. Sometimes I will receive a question that warrants its own research piece in order to answer it. Below is a question I was asked by an 80-20 Investor member:
I know you like to analyse things. If you are making a monthly contribution. What would be the best day of the month to invest on?
So true to form, I decided to carry out some analysis to see if there is an answer to the question. While it may seem a simple question it actually requires a lot of data crunching.
How I set about answering the question
Firstly I assumed that an investor decided to regularly invest in the FTSE 100. By keeping the underlying investment the same any variations in total return will be as a result of the differing time periods and investment methodologies. I also chose the FTSE 100 as there is historical price and dividend data going back as far as December 1985.
I then calculated the total return (i.e the return including dividends) if an investor had invested £100 in the FTSE 100 on 1st January 1986 and £100 on the 1st of each month thereafter until 1st May 2018.
I repeated this process for each day of the month. So, for example, I then calculated the total return if an investor had invested £100 in the FTSE 100 on 2nd January 1986 and £100 on the 2nd of each month thereafter until 2nd May 2018 etc.
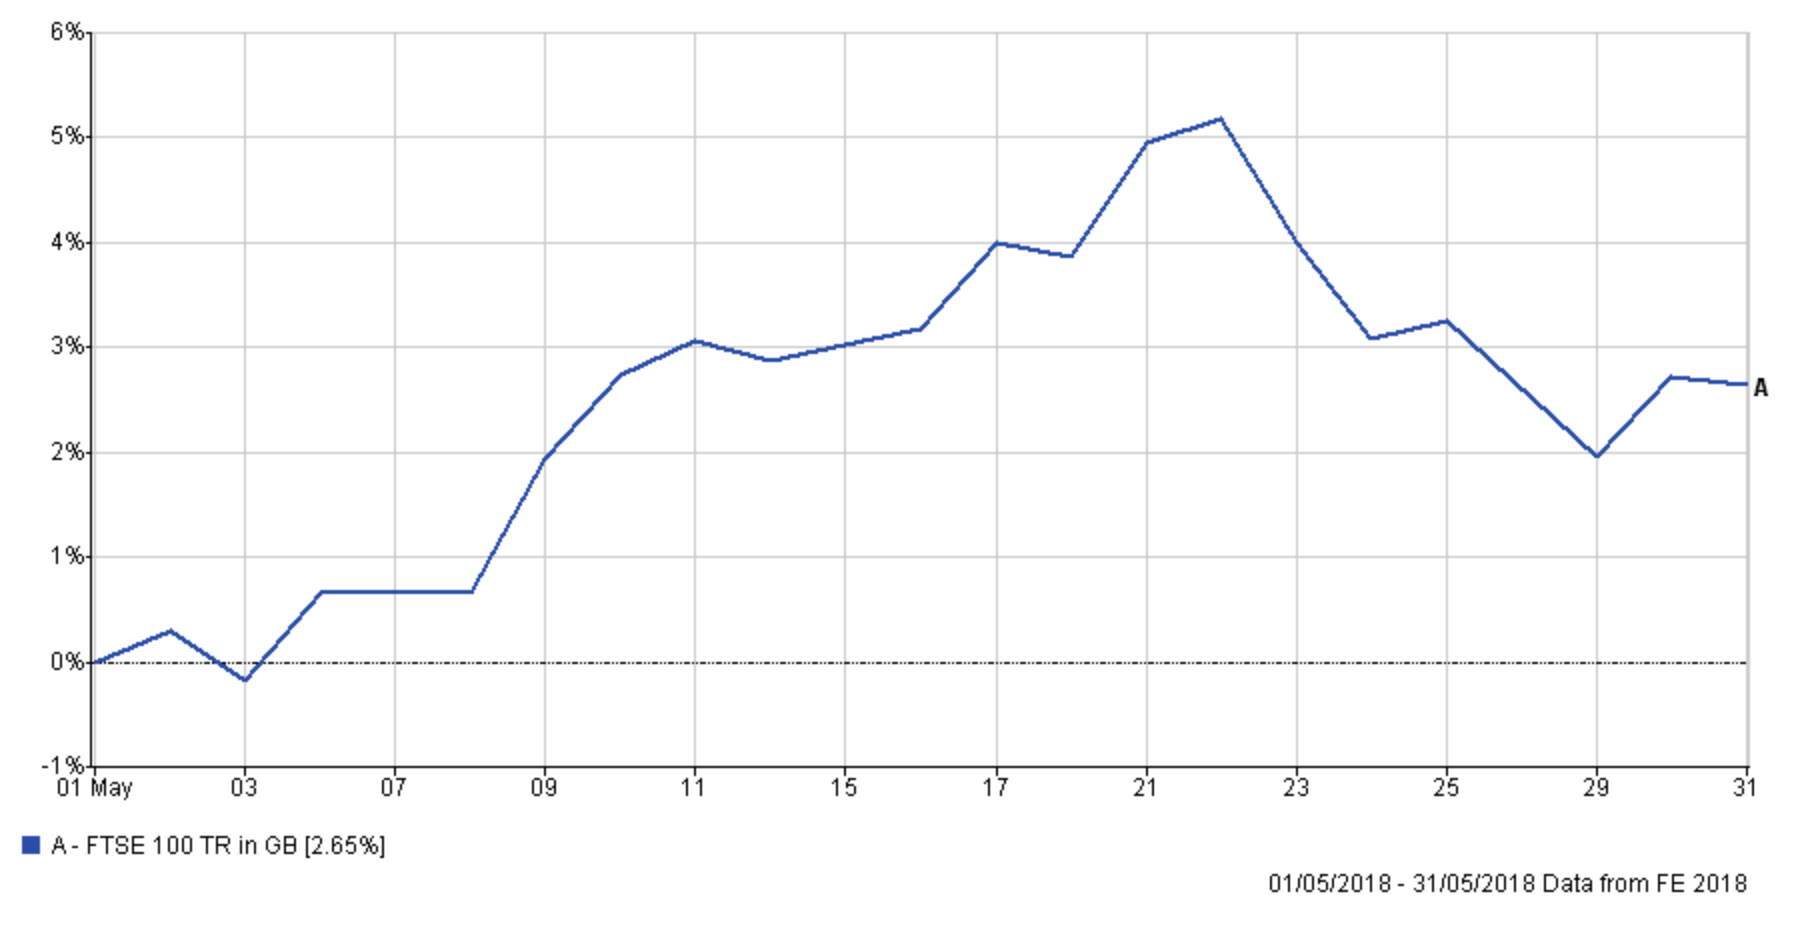
I also shifted the end investment date by one day each time to ensure that the total amount invested (i.e £38,900) was the same across each time period. The impact of starting on a different day at the beginning will be minimal as only £100 was invested at that point. The impact of the date that the time period ends in 2018 will have a greater impact theoretically as there would be a significant sum invested by that point. The chart below (click to enlarge) shows the total return of the FTSE 100 over the month of May 2018. Each day represents the endpoint for each one the portfolios I tested. So, for example, the portfolio that tested what would have happened if you had invested on the 1st of each month would not have enjoyed the rally towards the middle of the month. However, that is just something to bear in mind before we crunch the numbers.
The results
The table below shows the total amount that an investor would have had after investing £100 a month (a total of £38,900) on each given day of the month. It also shows how much the total return was above or below the average total return of £168,315.17. If the total return was above the average I have coloured it in green while those below the average I've coloured in red.
| Day of the month | Total return | Amount above/below average |
| 1st | £169,358.55 | £1,043.38 |
| 2nd | £168,808.11 | £492.94 |
| 3rd | £168,779.03 | £463.86 |
| 4th | £168,770.35 | £455.18 |
| 5th | £168,595.00 | £279.83 |
| 6th | £168,575.26 | £260.09 |
| 7th | £168,589.44 | £274.27 |
| 8th | £168,514.50 | £199.33 |
| 9th | £168,442.16 | £126.99 |
| 10th | £168,519.31 | £204.14 |
| 11th | £168,518.06 | £202.89 |
| 12th | £168,435.22 | £120.05 |
| 13th | £168,283.65 | -£31.52 |
| 14th | £168,194.61 | -£120.56 |
| 15th | £168,069.06 | -£246.11 |
| 16th | £167,964.32 | -£350.85 |
| 17th | £167,914.58 | -£400.59 |
| 18th | £167,888.19 | -£426.98 |
| 19th | £168,077.10 | -£238.07 |
| 20th | £168,263.74 | -£51.43 |
| 21st | £168,152.25 | -£162.92 |
| 22nd | £168,200.67 | -£114.50 |
| 23rd | £168,175.00 | -£140.17 |
| 24th | £168,283.34 | -£31.83 |
| 25th | £168,360.94 | £45.77 |
| 26th | £168,240.77 | -£74.40 |
| 27th | £168,042.19 | -£272.98 |
| 28th | £168,032.09 | -£283.08 |
| 29th | £167,825.25 | -£489.92 |
| 30th | £167,582.24 | -£732.93 |
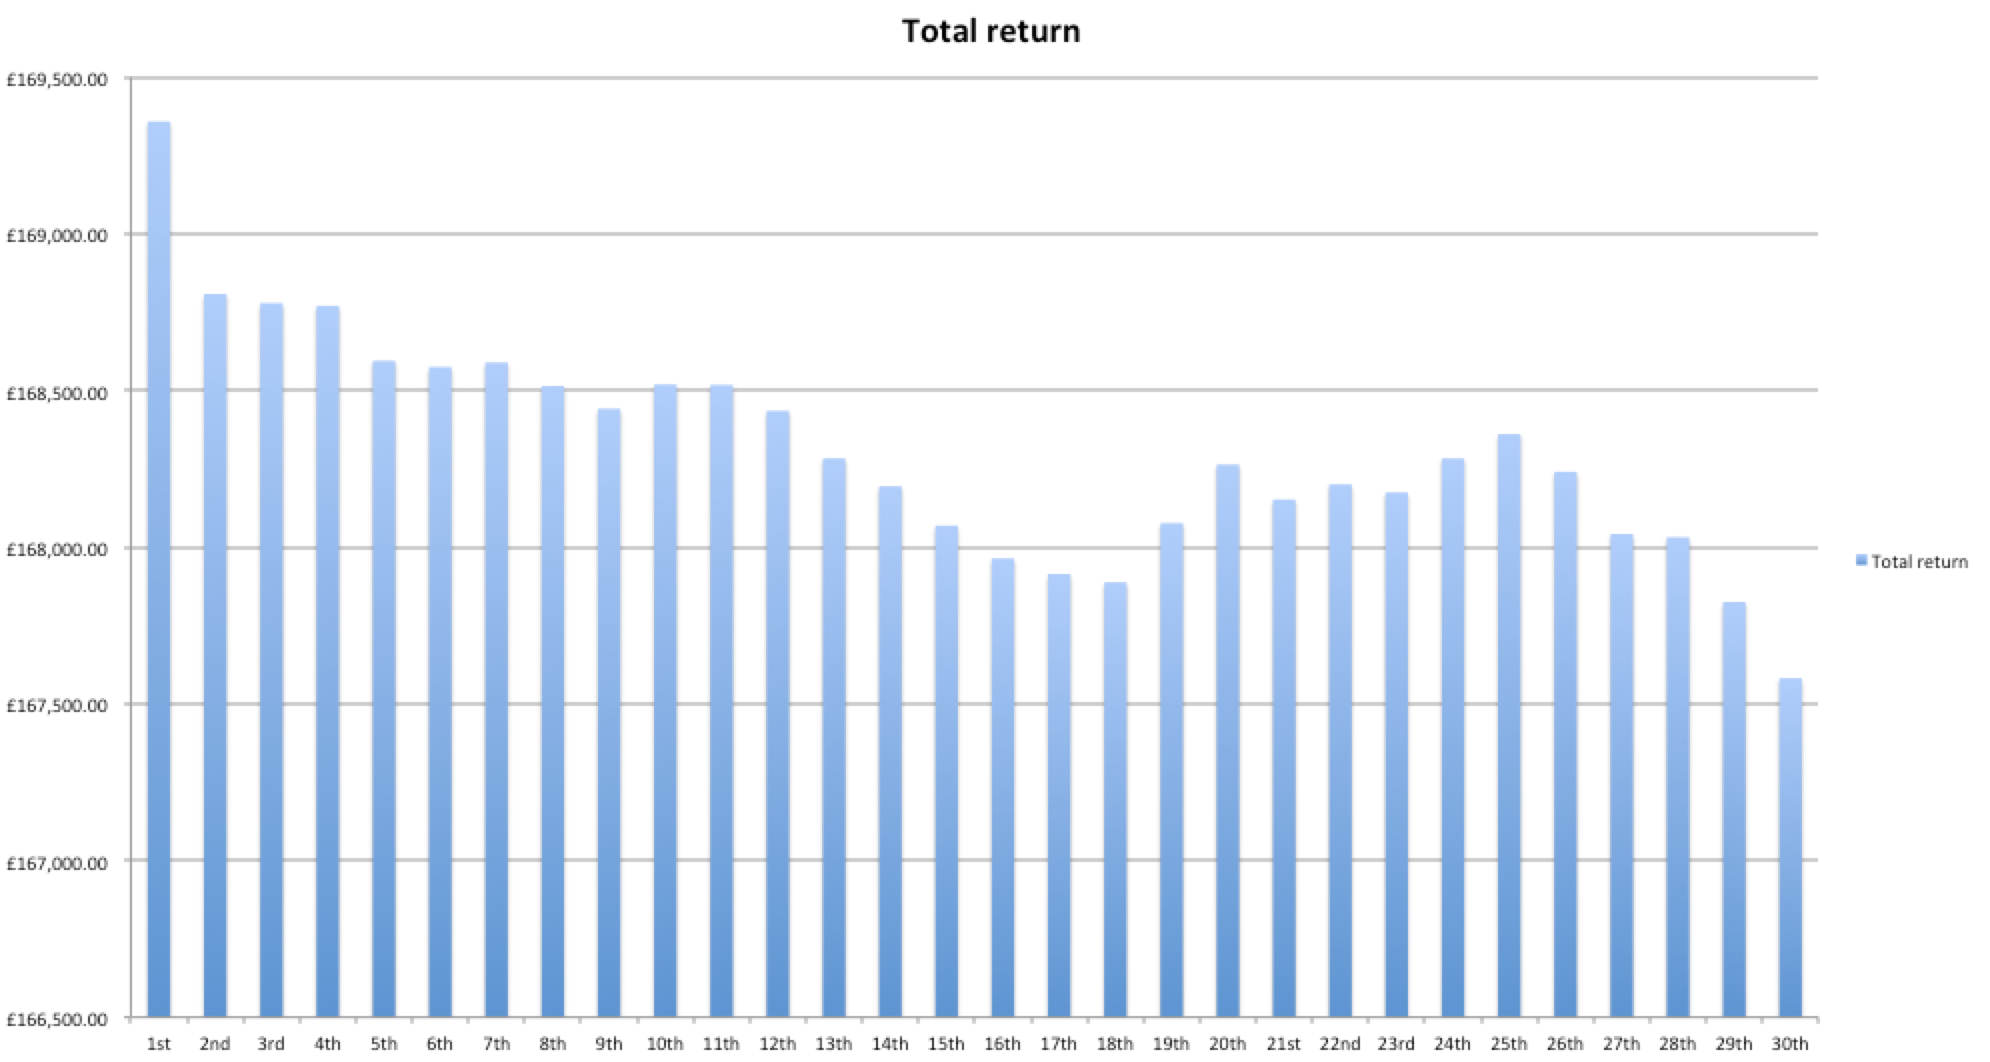
The chart below (click to enlarge) shows the total return versus the day of the month to show the relative differences (i.e it shows the second column of the table above).
The chart below (click to enlarge) shows how much each investment approach was over or under the average return over the period (i.e the chart is a representation of the third column from the table above).
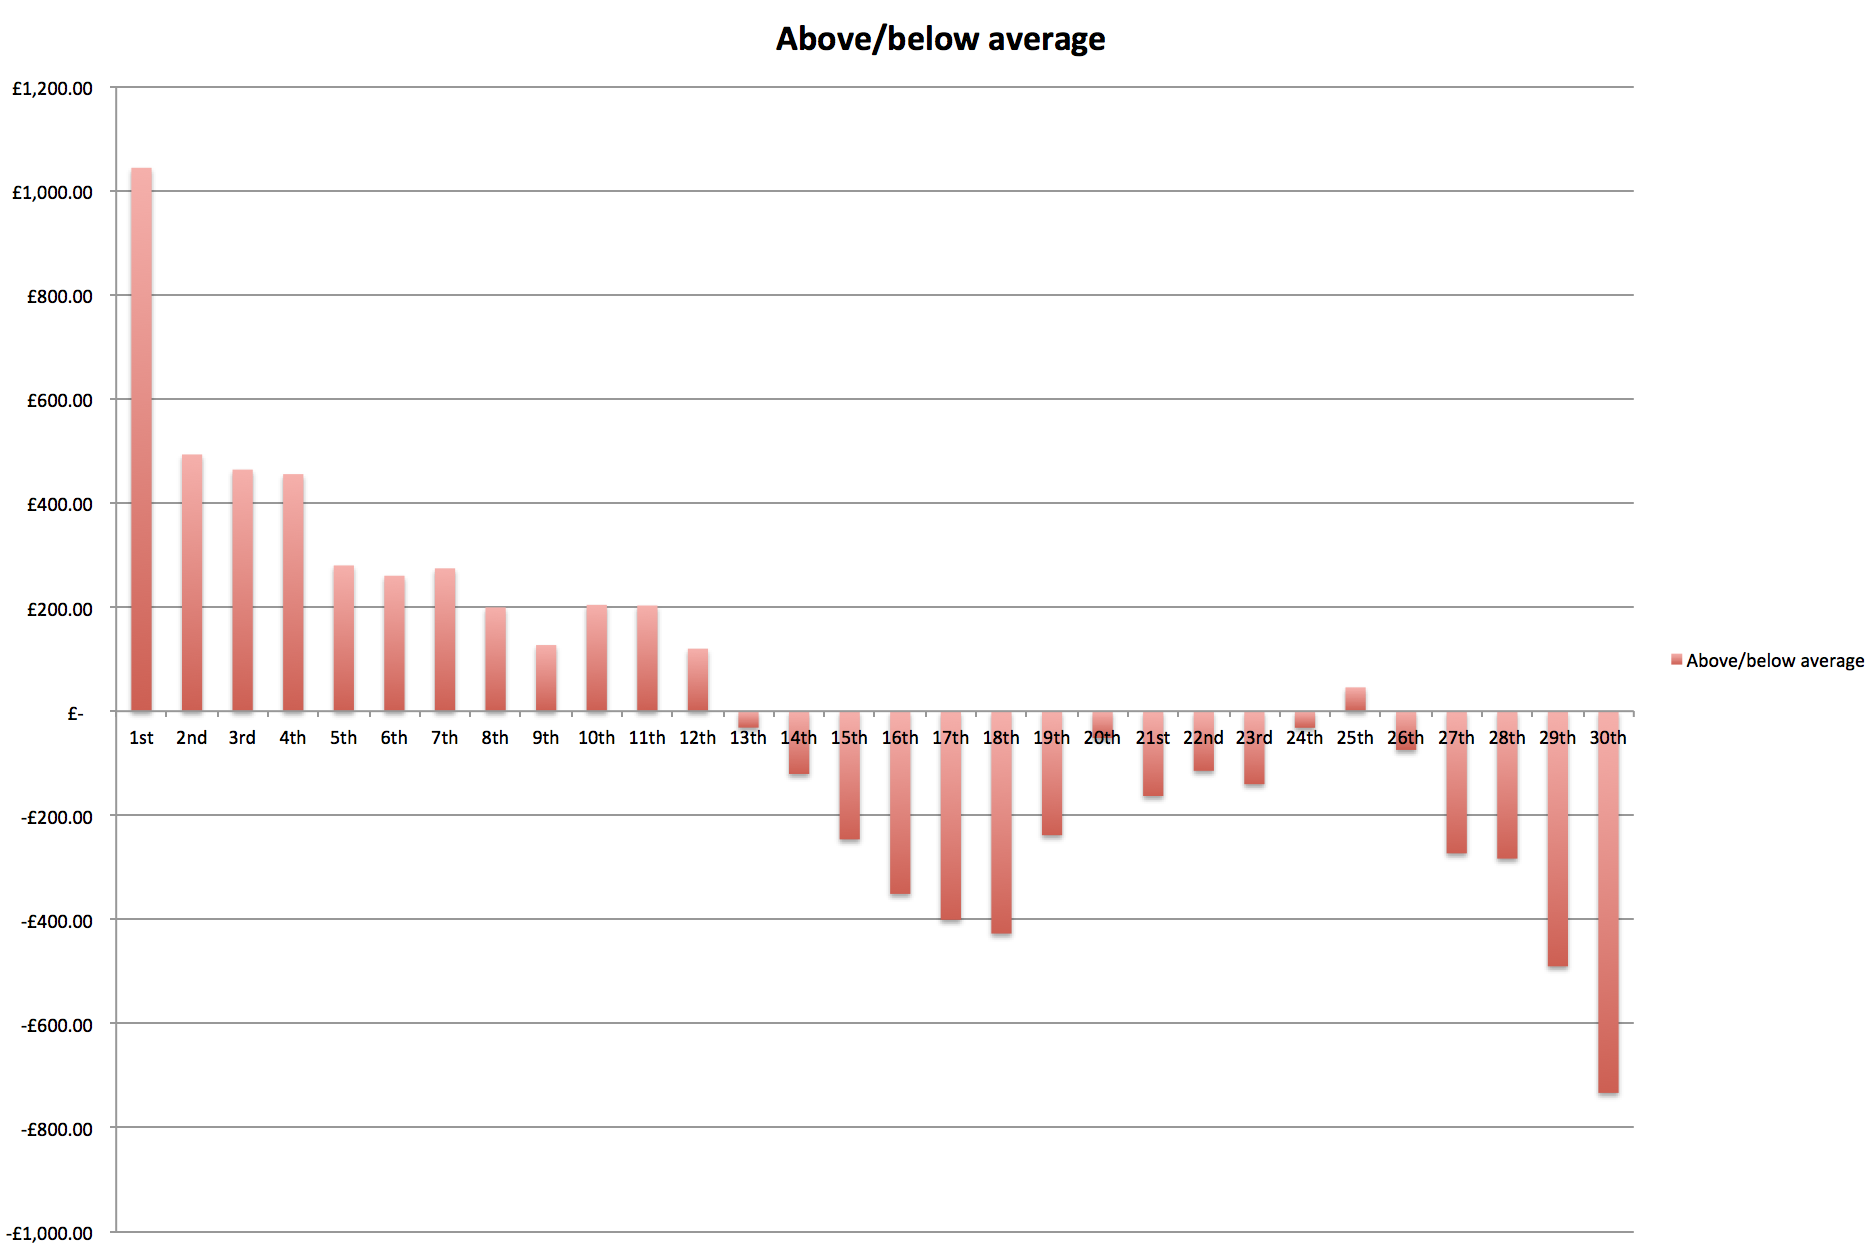
Looking at the data and charts there is a clear trend that it's more profitable to invest regularly in the first half of the month. In the middle of the month there is a dip before things pick up again around the 25th of the month. The worst period of the month to invest is the end of the month. These findings can't be explained by the movements we saw during May 2018, shown earlier.
The clear winner is 1st of the month. However, while it appears that investing on the 1st of the month has a significant positive impact you need to use statistical measures to finally prove that it does. One such statistical test we can use is known as the p-value. This calculates the likelihood of the result happening as a result of pure chance. So in this instance, I tested the likelihood that chance alone could explain the size of the total return for someone who invested on 1st of the month. For a result to be significant the odds of the occurrence has to be less than 5% (or 1 in 20). For the sake of completeness, the p-value for my data set was 0.001816 which proves that the result is significant at the 5% chance level.
That means that we can say with a high degree of certainty that you would be significantly better off, over the long term, regularly investing on 1st of each month. There are some observations/caveats to add to this. The 1st of the month will not always fall on a trading day so the research (as in real life) assumed that the money was invested on the nearest trading day. In addition, the 1st of the month is the day that the shares/funds are purchased, not the day that the direct debit is collected which could be a day or so earlier. Finally, the research assumed that someone had been investing for 33 years, which isn't outlandish for a regular investor who may be saving for their retirement. It would be interesting whether a shorter timeframe would impact the results in any way.
So why is the 1st of the month the best day to invest? I would hypothesise that this tendency for better returns at the start of the month may be the result of investors/traders rebalancing their portfolios at the end of each quarter in addition to new money flowing into funds at the start of each month. I can't be sure that this is definitely the cause but the result is interesting nonetheless.

£200 Pension Cashback Offer
Make a qualifying deposit or transfer a pension to our partner Interactive Investor.
- Deposit or transfer a pension of at least £20k and you could earn £200 cashback
- Terms and Fees apply, Capital at risk
- New & Existing customers opening a SIPP
- Offer ends 31st July 2026
Before starting your transfer, check you won't lose any valuable benefits (such as guaranteed annuity rates or a lower protected pension age) and find out what exit fees you might have to pay
