

The US election is now little over a month away and is an event that has the potential to move investment markets, as it did in 2016 and 2020. So I thought it an opportune time to look into how the 2024 US election might impact your investments.
The predictive powers of the US stock market
Historically the US stock market has been pretty good at predicting the winner of past US elections. Based upon research, going back as far as 1928, the performance of the S&P 500 in the three months prior to a US election is a pretty good indicator of which party will win.
On 12 of the 15 occasions when the market rose during the three months before an election the incumbent party won. Conversely, on 8 of the 9 occasions when the market fell during the three months prior to an election the incumbent party lost. The indicator even managed to predict the shock Trump win in the 2016 election.
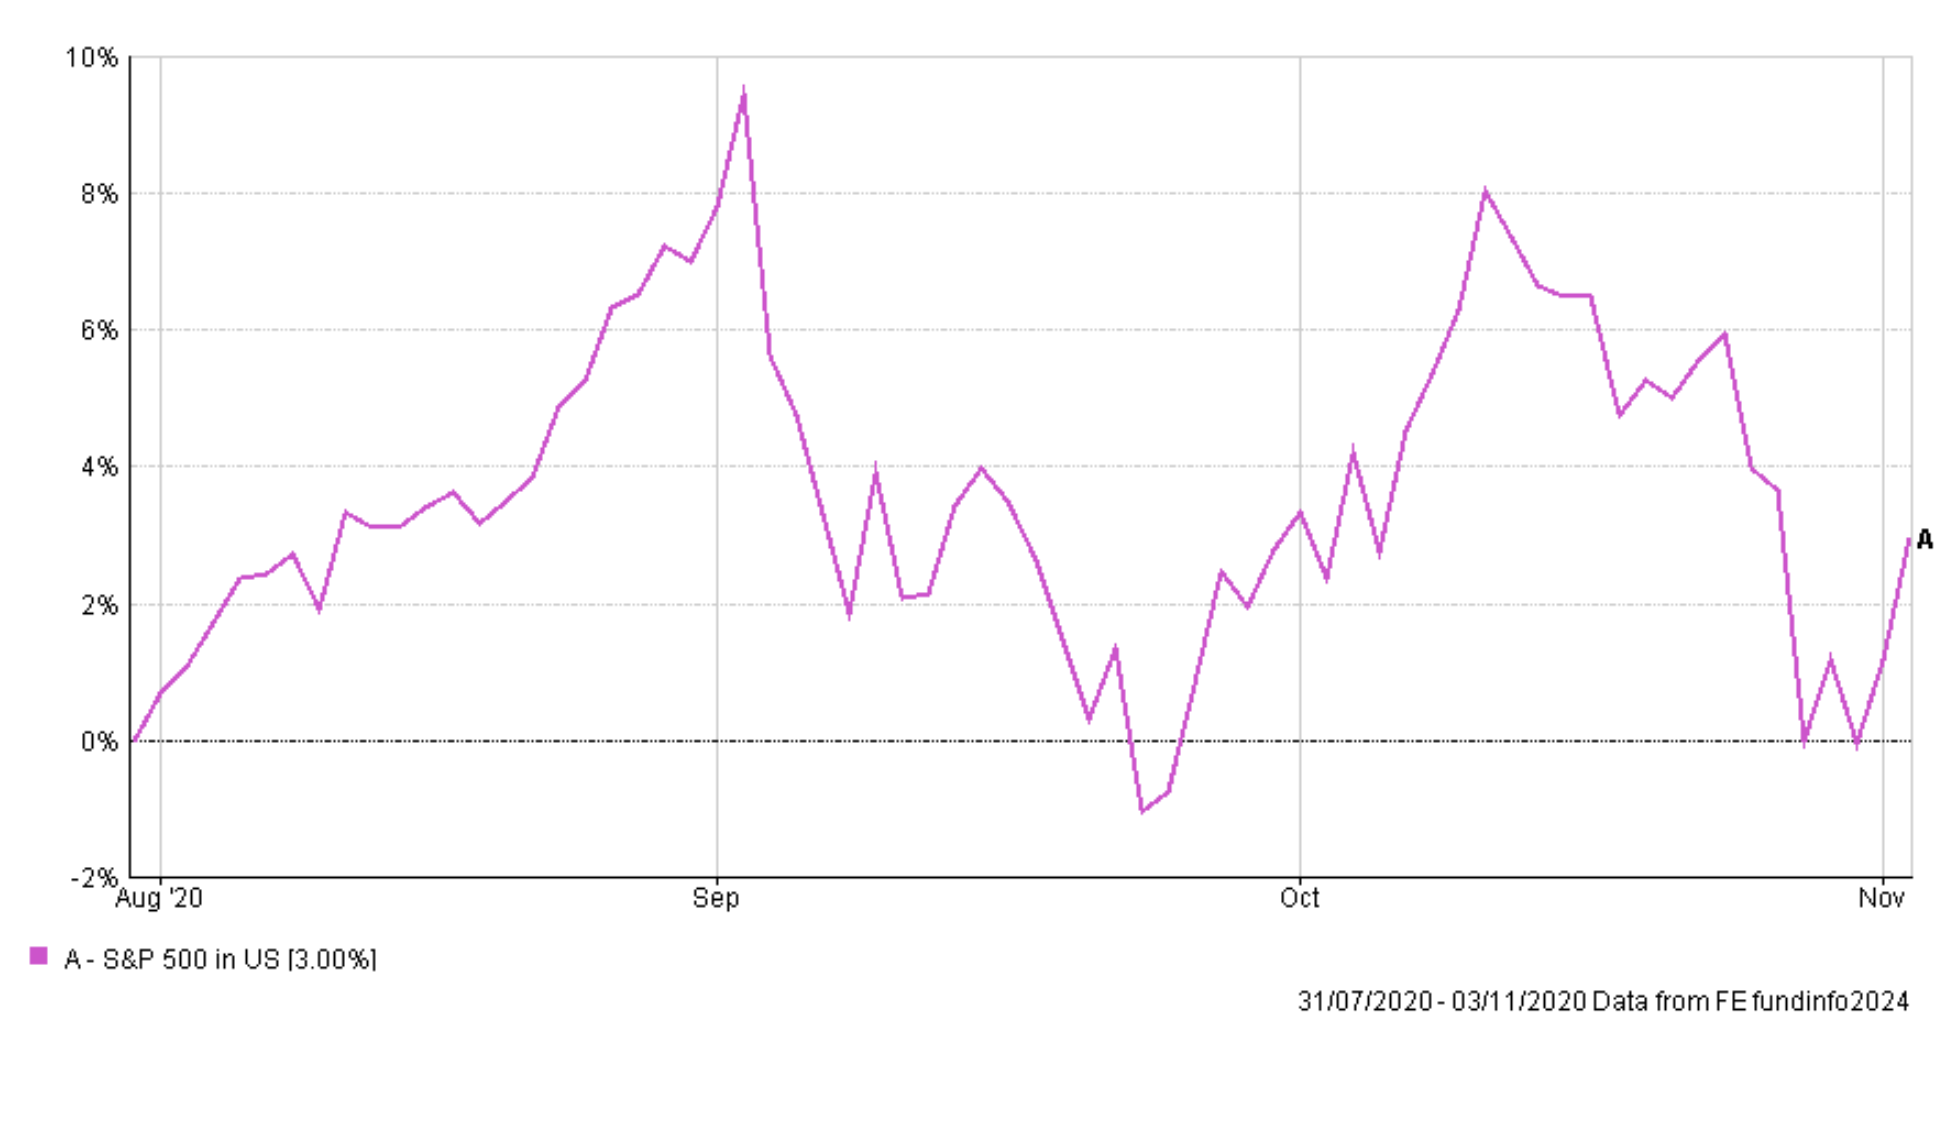
But 2020 was one of the rare outliers. The S&P 500 rose 3% in the three months before the 2020 US election, yet the incumbent Donald Trump lost. Despite this, the indicator still has an 80% success rate (having now been correct on 12 out of 15 occasions). Also, 2020 was a near miss. If you look at the chart below you can see in the days before the 2020 election the S&P 500 actually moved into negative territory, indicating just how close a call it really was.
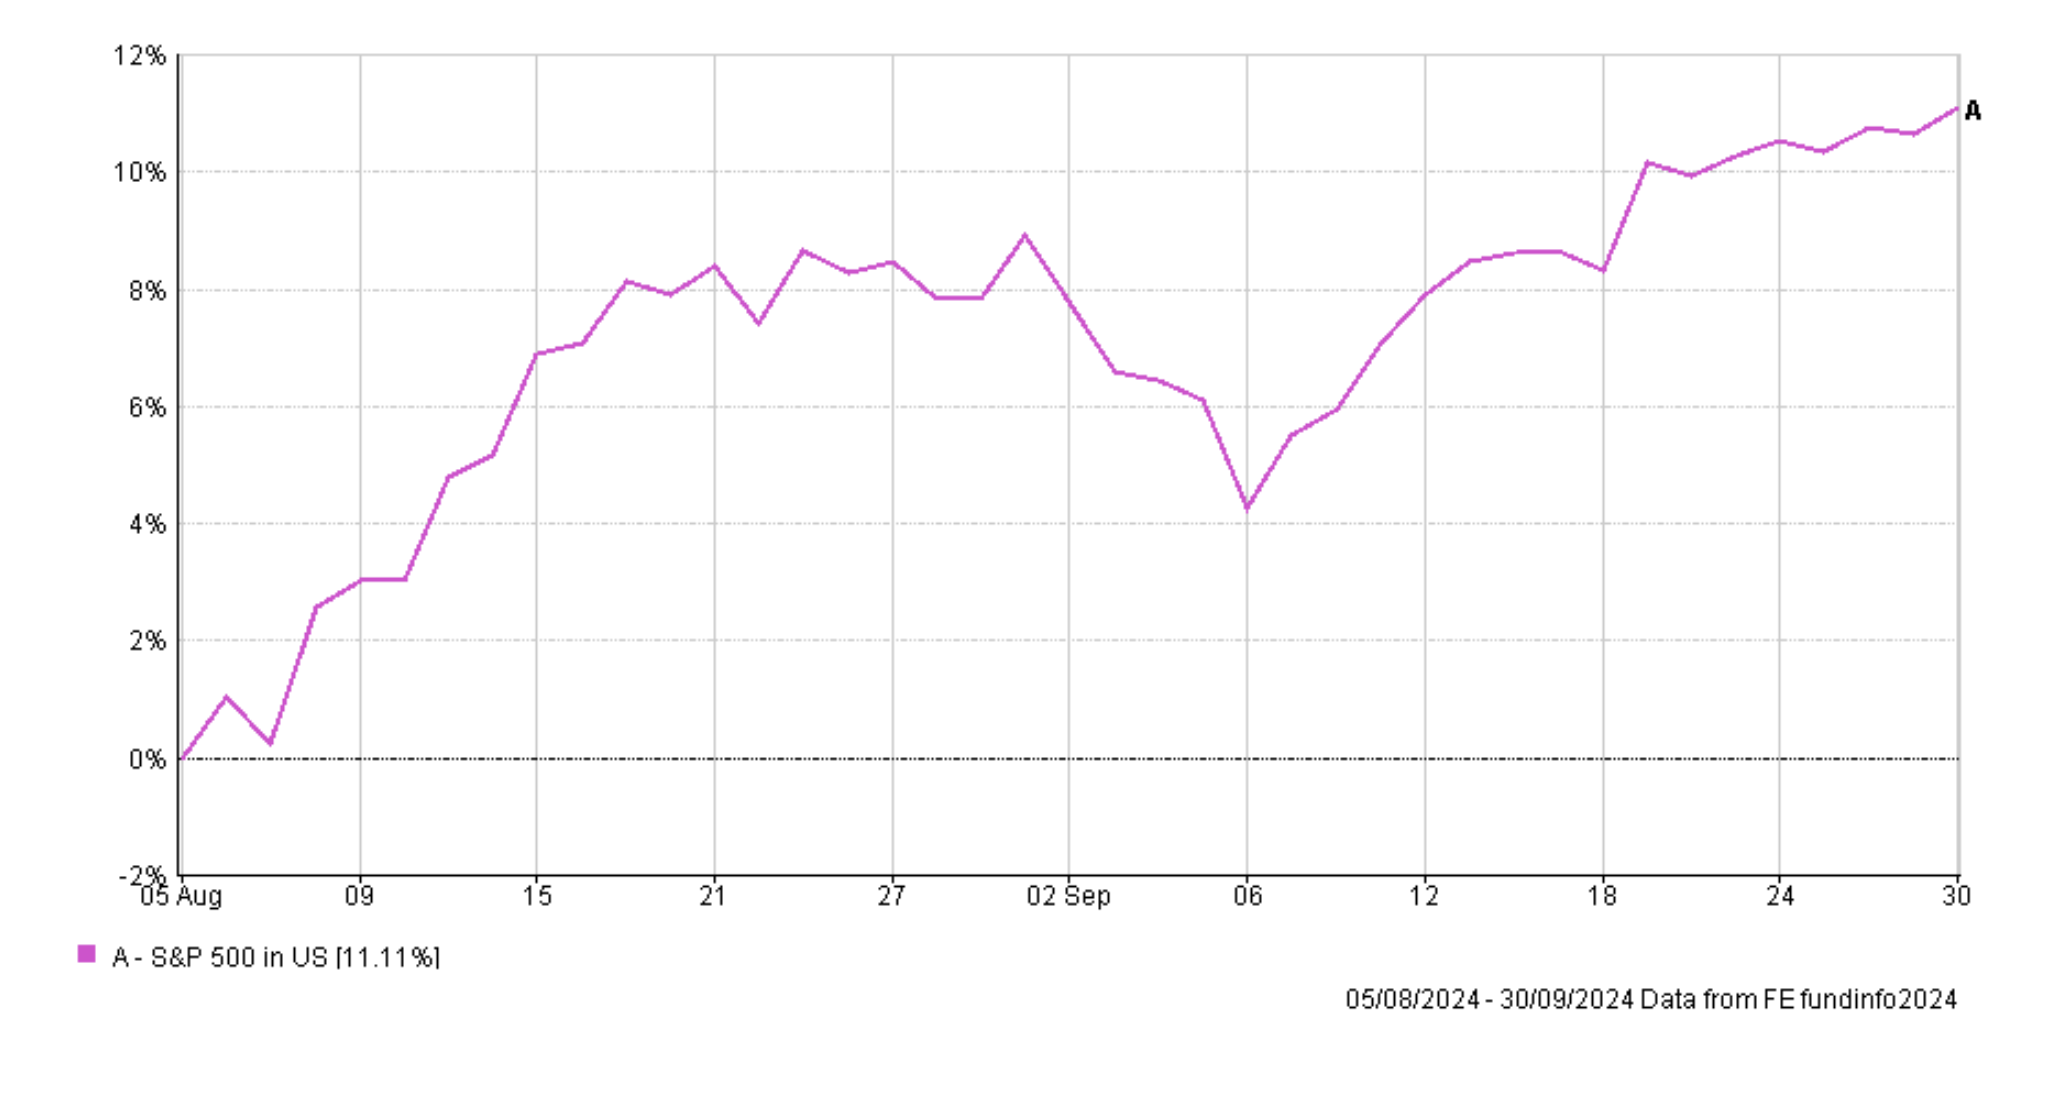
Fast forward to 2024, the chart below shows the performance of the S&P 500 since 5th August, which is the start of the three-month pre-election window. The S&P 500 is currently up over 11% which means that something drastic needs to happen (and the S&P 500 fall back below 5186.33) before 5th November for the S&P 500 to predict anything other than a Kamala Harris win.
How does the stock market perform across a US election?
As we've already seen, in the 3 months before a US election we tend to see the market rise when the incumbent party wins but fall when it doesn't. However, the table below shows how the stock market, as measured by the S&P 500, behaves before, during and after the US election day. So applying this data to 2024, it would suggest that if the Democrats win the 2024 election then we should expect the 11.1% rally we've seen since the start of August to moderate, closer to the long term average of 3.4%. But, conversely you could argue that as we are 1 month out from the election date then the S&P 500 should rise by another 1.6% based on history.
Of course, if the Republicans were to win history suggests that we can expect the S&P 500 to tumble into the election day. Obviously, history doesn't repeat exactly but all of these scenarios suggest that we should expect a pullback into the election day, even if the S&P 500 remains in positive territory on a 3-month basis, which is exactly what we saw in 2020 (see above).
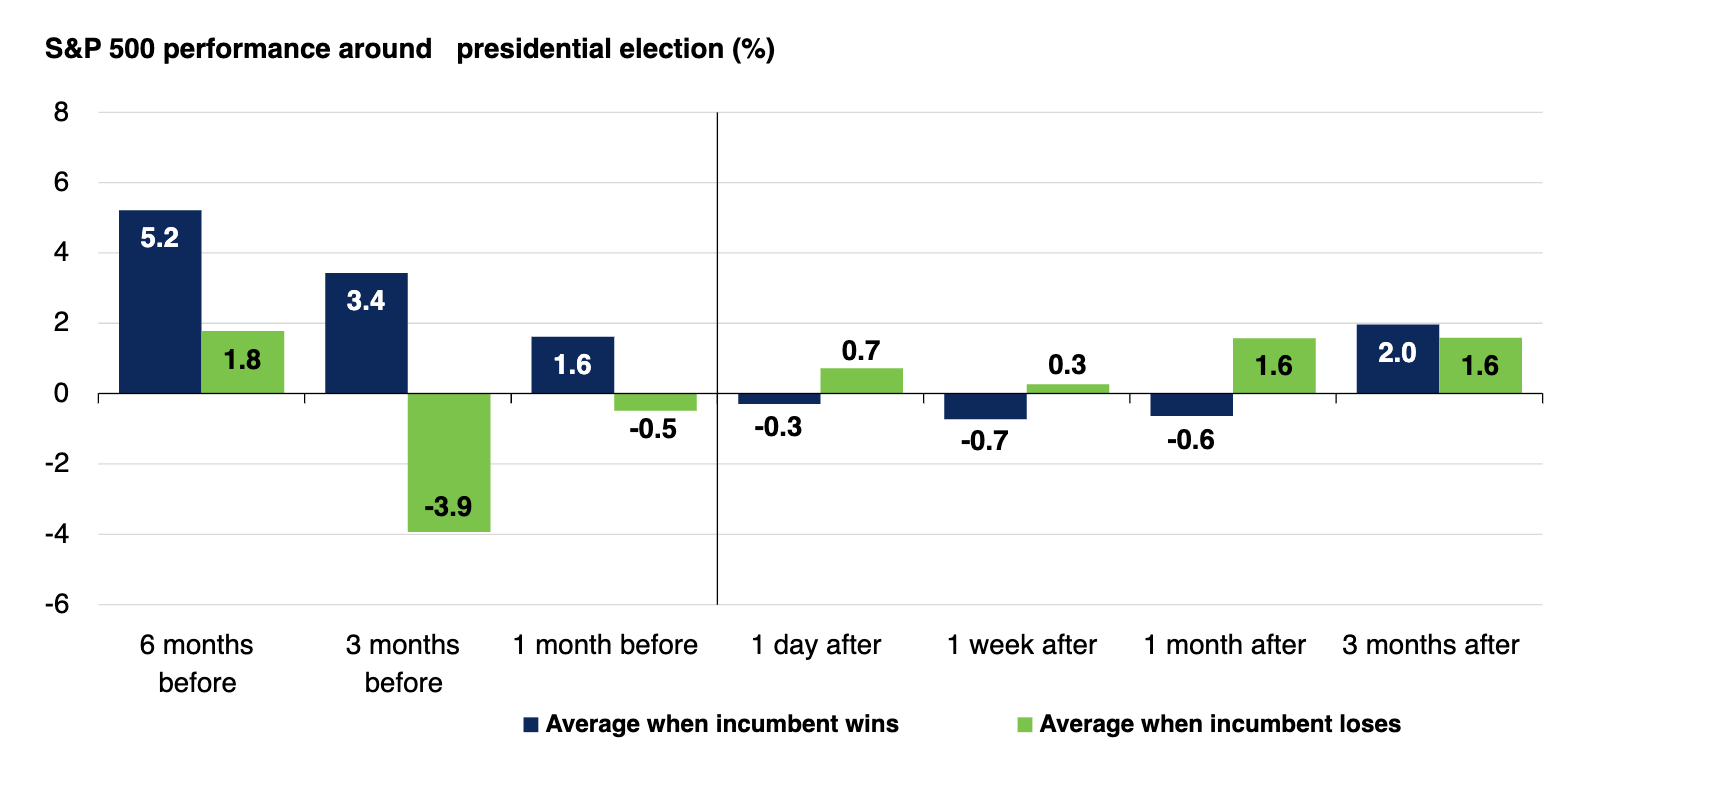
Perhaps what is more interesting is that post-election, history suggests a Trump win would initially be more positive for markets. Or in other words, for investors, change isn't necessarily a bad thing. If we go back to 2020, you can see the stock market surged relentlessly after the election result. However, this was also driven by the discovery of the Covid-19 vaccine just days after Joe Biden took office. 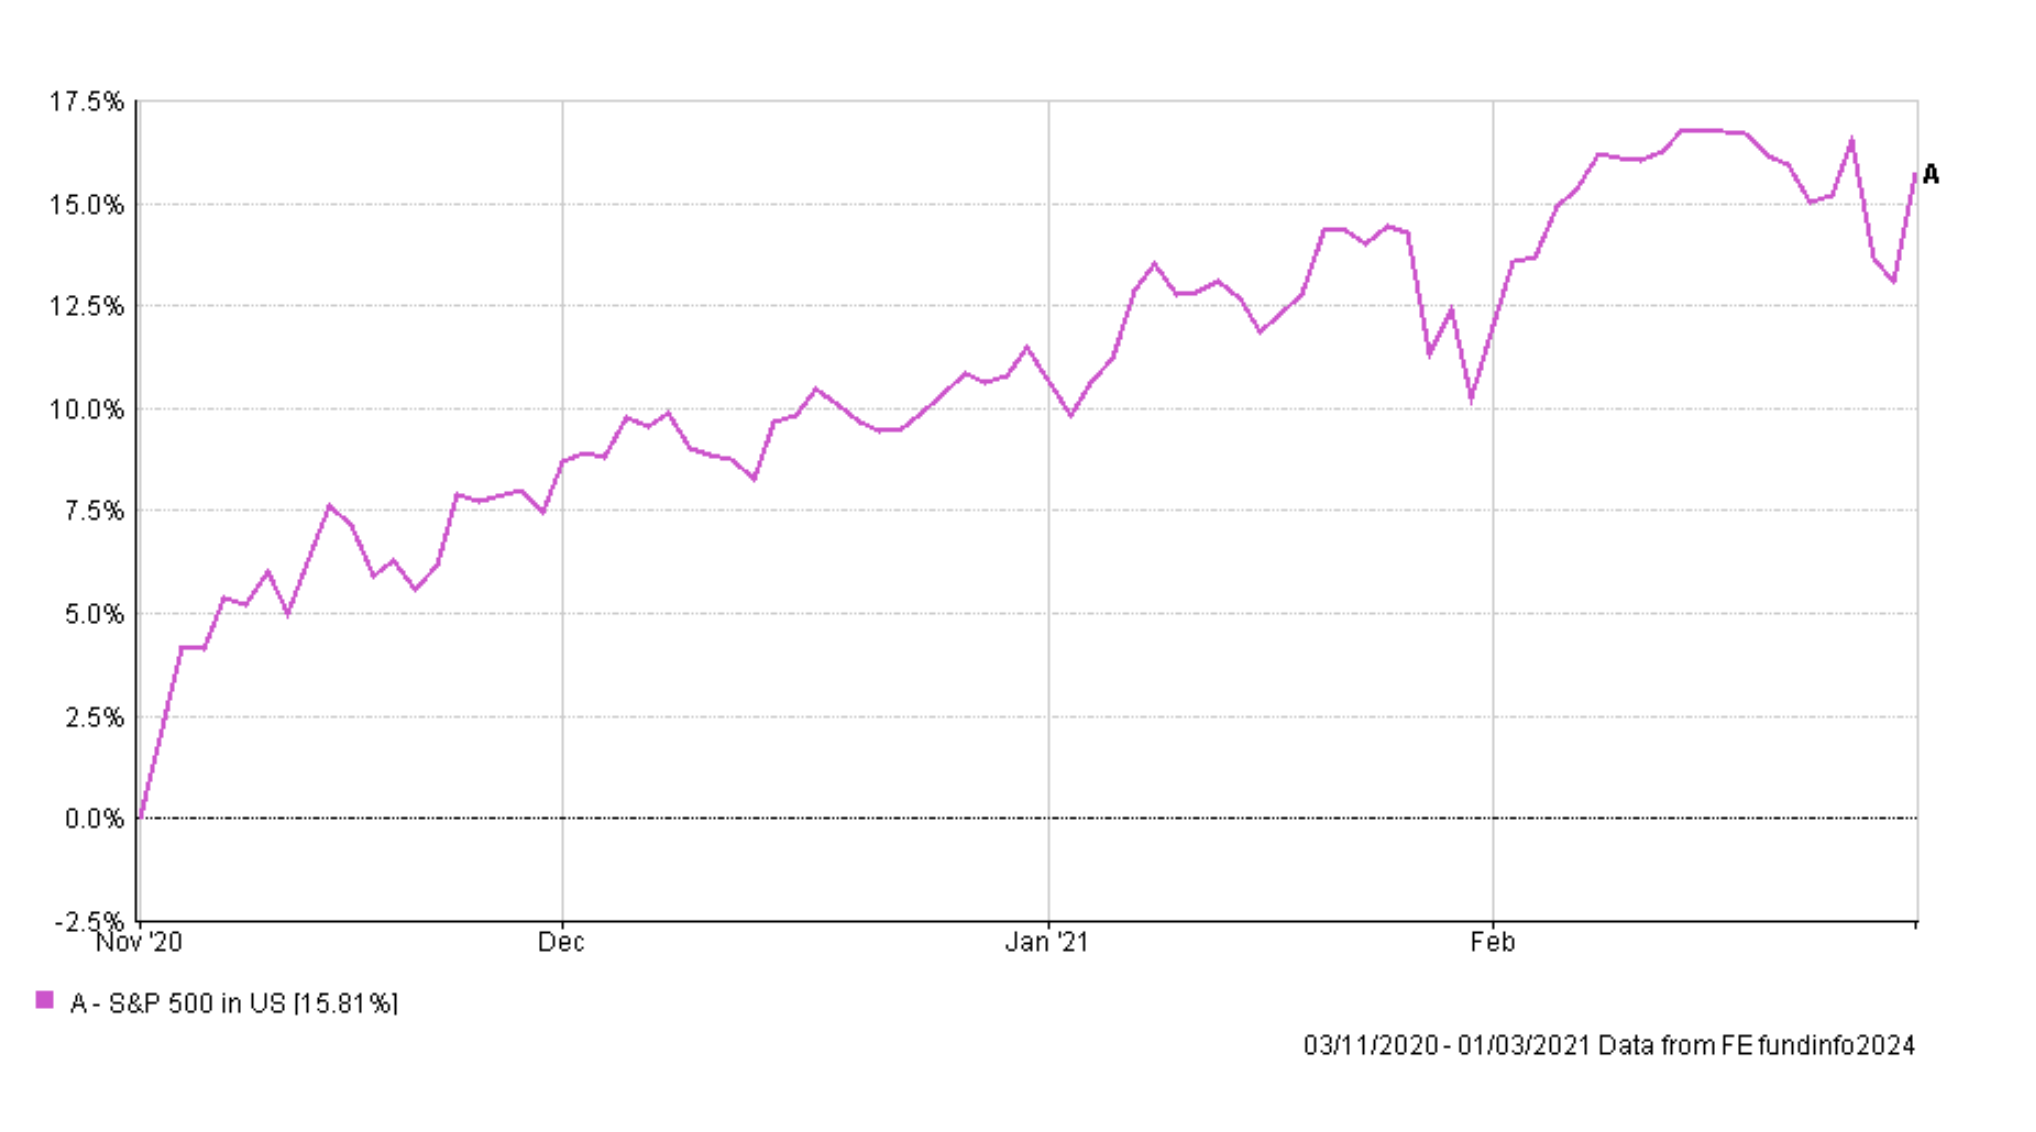
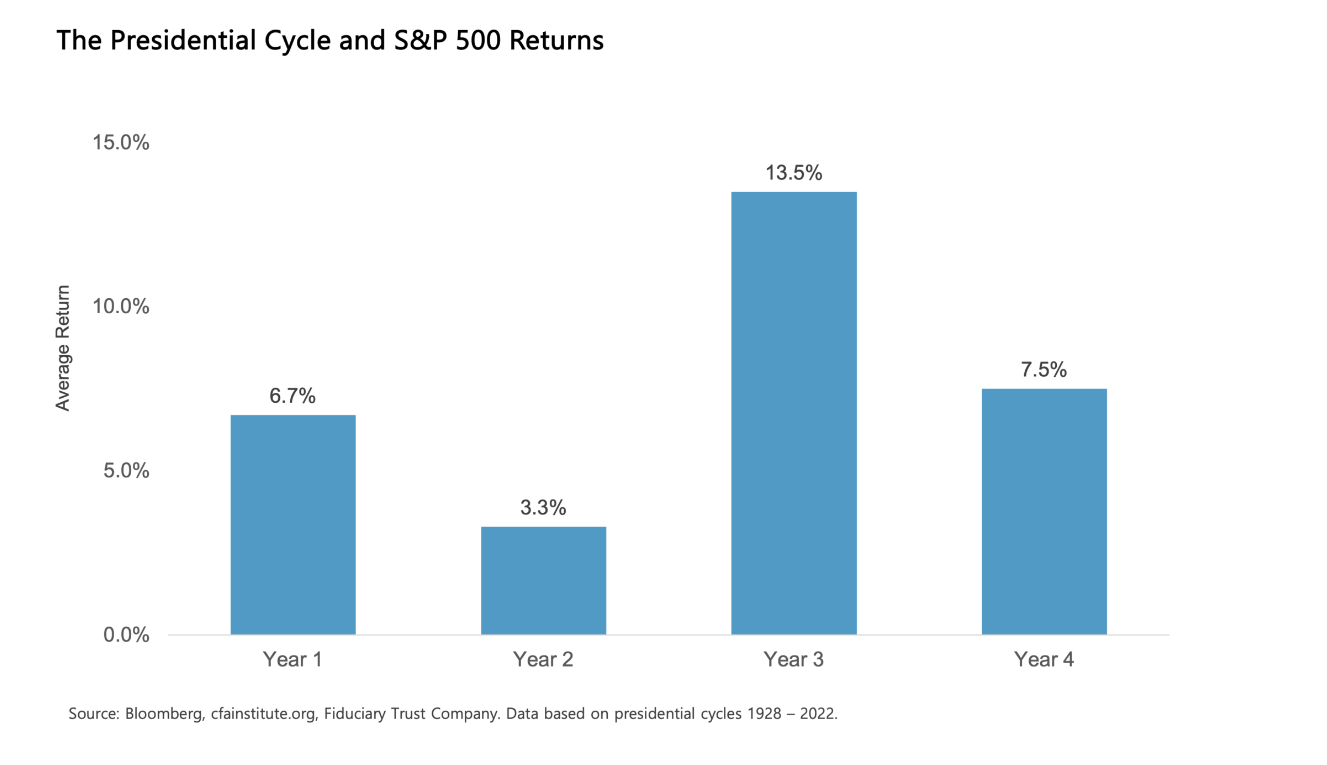
But how does the stock market perform longer-term? The chart below suggests that we can expect the annual return of the US stock market to fall over the next 2 years whoever wins.
Does it matter which party wins the US election?
Does the stock market perform better under one party than it does the other?
The table below produced in July by the Cetera Financial Group shows that investors typically enjoy significantly better annualised returns during a Democratic Presidential cycle rather than a Republican Presidential cycle.

This goes against the conventional belief that Republicans' pro-business politics should, in theory, be good for the stock market. However, the relationship between which party the President represents and stock market performance is more complex than the data suggests. Producing annualised returns causes some large distortions in the data. The biggest influence on the performance of stocks during a Presidential tenure is the macroeconomic backdrop.
George W Bush, the worst US President for the US stock market, presided over two recessions following the dotcom bubble bursting and the financial crisis. However, George W Bush inherited the excesses of Clinton's tenure and a technology bubble that was in the process of bursting. Donald Trump was the President during the Covid-19 pandemic, which sparked the fastest bear market in history. But interestingly he is still likely to outperform Joe Biden who has not had to contend with a recession or major economic slump. The above table was produced in July, and even after updating Joe Biden's number his annualised performance is 14.72%, still below Trump's 16%.
So have the Republicans just been unlucky? Since 1953,10 out of the 11 US recessions began under Republican presidents. Statistically speaking the odds of that happening are close to 1 in 100, suggesting that the Republicans have played a role in their own downfall. As recessions are generally not good news for stock market returns it is no wonder Democratic Presidents have fared better. So taking the evidence in the round, the message would seem to be that a Democratic win in November would be better for US investors over the longer term. Don't forget, ultimately what is good for US stocks is generally good for global stock markets too.
How the election is won matters more than who wins
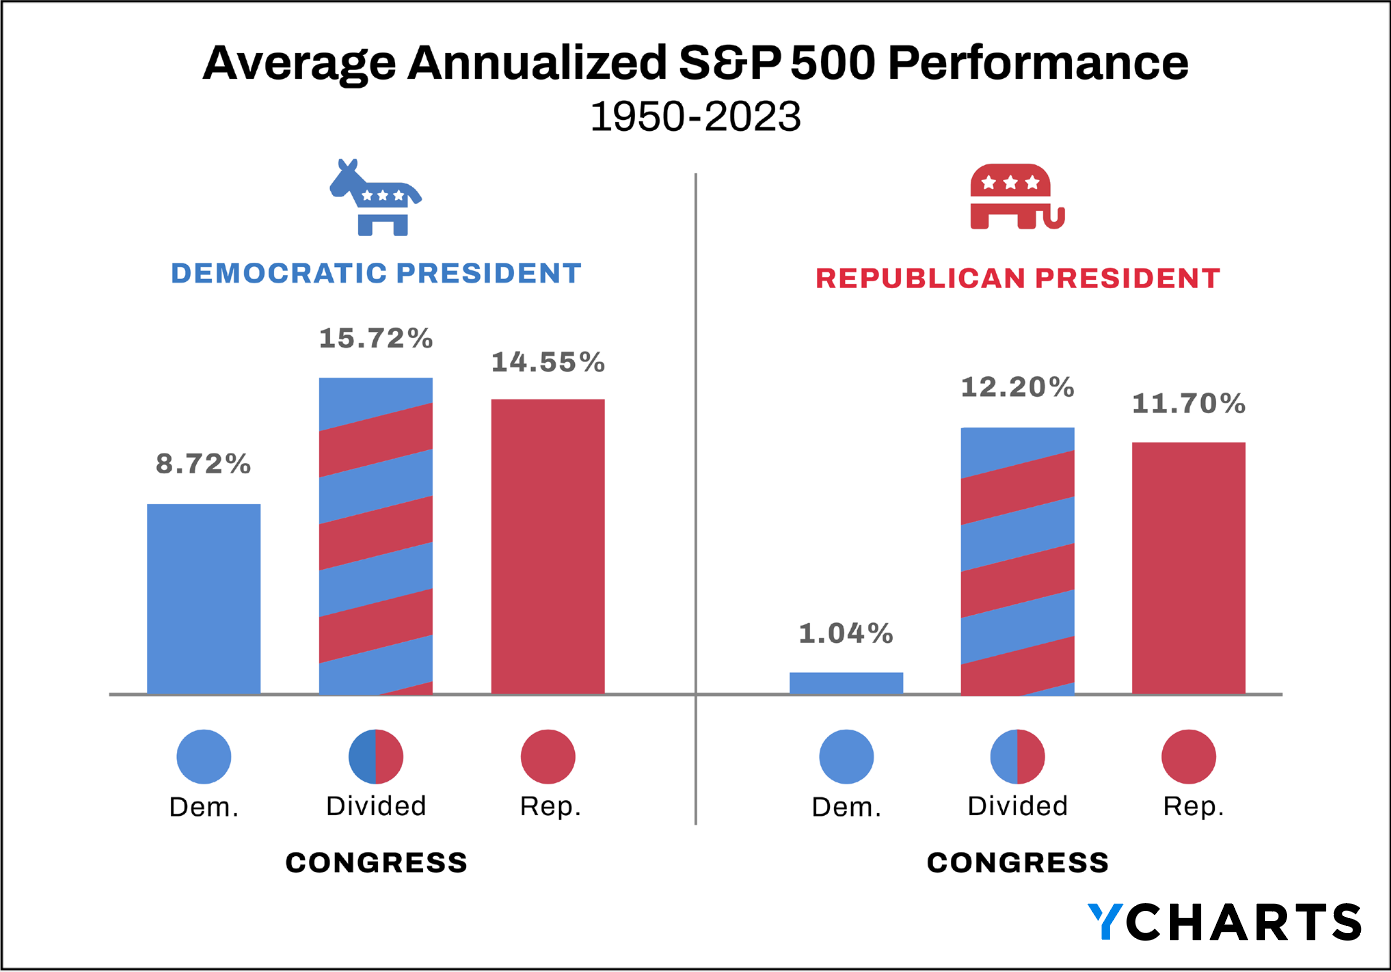
Research from Ycharts suggests that the stock market is far more concerned over the makeup of Congress than who actually wins the Presidency. The chart below looks at Presidencies since 1950 and shows that the stock market performs better when Congress is split (i.e. where different parties control the House and Senate) and performs best when that split is under a Democratic President.
How do other assets perform during a US election
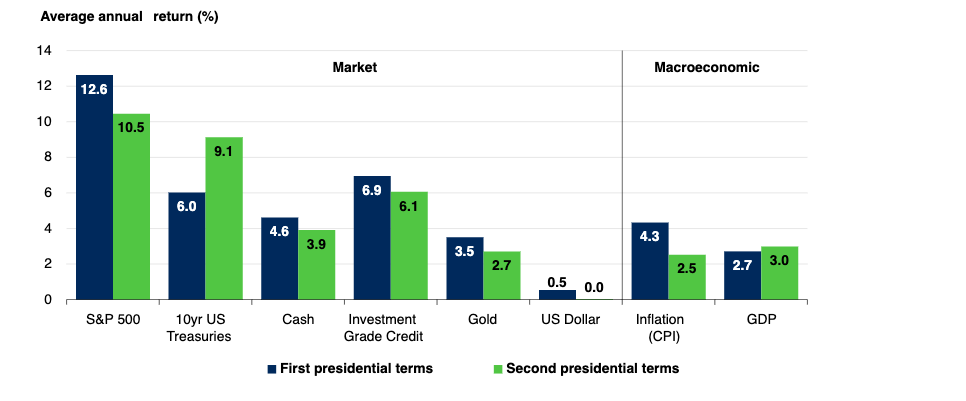
Back in July when Joe Biden was still the Democratic Presidential candidate, Schroders produced this interesting chart showing that historically most asset classes have seen lower returns during a President's second term in office. Of course, Kamala Harris is now the Democratic Presidential candidate but the chart is still interesting should Trump become president once again.

Looking beyond which candidate wins, how do various assets perform in the year following a US election and how does this differ under Republican and Democratic presidents? The chart below shows how a range of assets including US treasuries, gold and oil (WTI) have performed following US elections since 1993. While the sample set is small, the data would suggest that who wins the election has a bearing on which assets perform best.
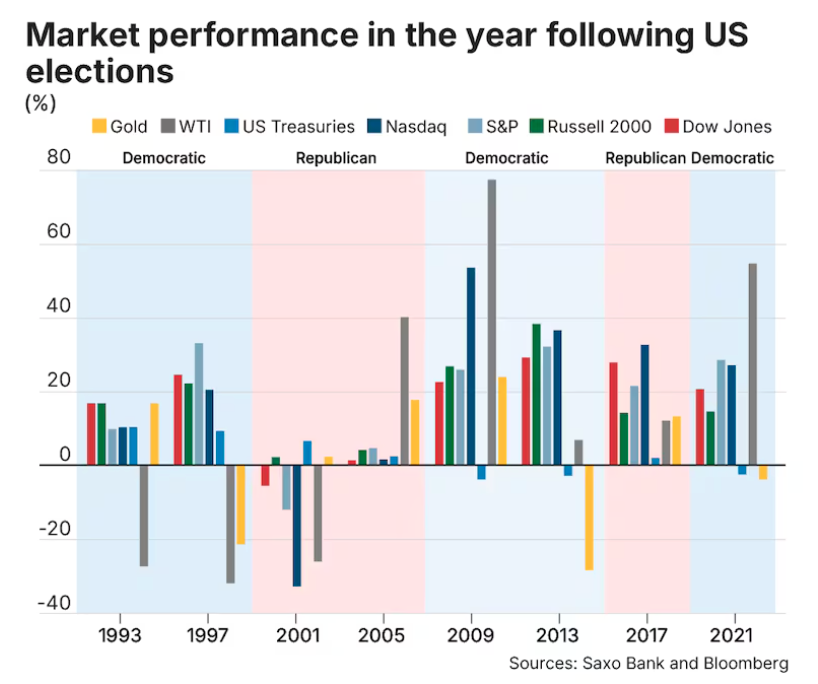
During Republican presidencies gold and bonds (US treasuries) have been the more consistent performers . Meanwhile during Democratic tenures, tech stocks (Nasdaq) have been among the best performing assets. Of course, this could be a result of the macroeconomic backdrop each president inherited (such as the dotcom bubble popping during a Republican tenure) but it will also be influenced by their politics. This is something that investment banks (which I will call the "smart money") are mindful of when positioning their portfolios ahead of this year's US election. I cover this in more detail in the next section.
What does the smart money think? Which US sectors should you invest in or avoid?
Trying to predict how individual sectors of the US stock market are likely to fare in the aftermath of the election is crystal ball gazing. While I would advise against trying to predict the future, investment banks are expected to do so by their clients. So below are the views of UBS, JP Morgan and Morgan Stanley. I place no emphasis on any outlook, but it gives you a feel for what the 'smart money' is thinking.
Morgan Stanley
Morgan Stanley outlines three primary ways the US election could impact markets:
- Tax Cuts: If the Republican Party wins, there is a strong possibility of extending the 2017 Tax Cuts and Jobs Act. This could increase the US deficit, leading to higher interest rates, which would put pressure on corporate profits and equity valuations. This scenario would be positive for sectors like energy, telecoms, and utilities, but could hurt broader market valuations due to rising interest rates.
- Tariffs: Proposed trade barriers, including tariffs on imports from major trading partners, could increase inflation and disrupt supply chains, potentially leading to stagflation (persistent inflation combined with slow growth). This would especially impact sectors like consumer goods and technology due to the reliance on international trade.
- Immigration: A Republican win could lead to policies that curb immigration, which may slow labour supply growth and increase wage pressures, negatively affecting sectors like housing and manufacturing that benefit from a growing labour pool.
Morgan Stanley suggests investors "should think about adding what could be leaders in a Republican-sweep scenario, such as energy, telecoms and utilities". They also suggest "positioning portfolios defensively, with a focus on investments that offer growth at a reasonable price, in areas like healthcare, industrials, aerospace and defense, select power generation and grid infrastructure, financials and residential real-estate investment trusts (REITs)".
They also suggest increasing exposure to Japan and gold may also be beneficial.
J.P. Morgan
J.P. Morgan highlights that while elections may lead to market volatility, the macroeconomic landscape often plays a larger role than electoral outcomes. They suggest focusing on longer-term strategies rather than making big bets based on political results.
Key points include:
- Fiscal Policy: Regardless of who wins, the next president will have to contend with a growing fiscal deficit. A Democratic victory could bring higher taxes, while a Republican win might extend the tax cuts, potentially leading to higher bond yields.
- Trade Policy: Both parties are likely to continue a tough stance on China, but the exact measures—such as tariffs or incentivising domestic production—will vary. This could impact sectors like technology and industrials, which are closely tied to global supply chains.
UBS
UBS has previously suggested that:
- A Republican win would likely benefit financials, energy, and value stocks, given a pro-growth, deregulation agenda.
- A Democratic win might favour sectors tied to renewable energy, healthcare, and infrastructure, reflecting policy priorities such as climate change and healthcare reform
What happens if the election result is contested
Back in 2020, the threat of Donald Trump contesting the election result, if he lost, concerned investors. But back then there was little historical precedent about how the stock market would react in such a scenario. The closest comparison was the aftermath of the 2000 election when it took 6 weeks for George Bush to officially beat Al Gore following a recount of the votes in Florida. Back then equity markets on both sides of the Atlantic fell with the S&P 500 down 6% in the two weeks after the election when the threat of litigation seemed likely.
However, in 2024 we now have a little bit more insight following Trump's attempt to overturn the 2020 election result. It resulted in his legal team filing 63 lawsuits with the Supreme Court, but none were successful. As shown by the earlier chart, by mid December 2020 the S&P 500 had rallied by almost 10% since the election day, largely a result of the Covid-19 vaccine discovery. This therefore clouds the one piece of real data we have. So it's impossible to discern what impact Trump's contestation really had on investment markets, especially as its substance was questionable in the first place. As a general rule of thumb, equity markets don't like uncertainty. If we get another contest/result delay, more reminiscent of 2000 rather than the 2020 Trump tantrum, equity markets are likely to be volatile.
Summary
So to sum up, a Democrat win is usually good news for stocks during the tenure of office but a change in Presidency wouldn't necessarily be a disaster in the short-term. What matters more is whether we get a unified government or not. If we don't then it could be positive for stocks no matter who wins, over the coming years, as no one party would have absolute control of US politics. History also suggests that a Democratic controlled Congress is a drag on US stock markets.
One thing that is almost certain is that volatility will pick up into the US election. A lesson from history and in particular from 2016 and 2020, is that the market volatility usually subsides quickly and often within four days of an election result. If the US election result is contested by Trump, then the lesson from 2020 is that the market will likely take it in its stride.
History also shows us that ultimately it's the economic backdrop (and central bank policy) which is still likely to have the biggest sway over the direction of stock markets in the US and globally both in the short term and during the next Presidential term. If the US Federal Reserve can engineer a soft landing (by using interest rates to tame inflation without crashing the economy) then whoever wins the election can likely look forward to strong stock market performance during their tenure. Ultimately with so many unknowns, it is a brave person who tries to alter their portfolio to benefit from the US election.

£200 Pension Cashback Offer
Make a qualifying deposit or transfer a pension to our partner Interactive Investor.
- Deposit or transfer a pension of at least £20k and you could earn £200 cashback
- Terms and Fees apply, Capital at risk
- New & Existing customers opening a SIPP
- Offer ends 31st July 2026
Before starting your transfer, check you won't lose any valuable benefits (such as guaranteed annuity rates or a lower protected pension age) and find out what exit fees you might have to pay
