

Back in 2015 I carried out a piece of research titled "The best strategy in a stock market crash – Stick or Twist?"
However a lot has happened over the course of the last nine years, including the fastest bear market in history. So do the findings of the original research article still hold true? What about during the pandemic crash?
There were two key conclusions that came out of the original piece of research and they were that:
- When markets suddenly sell-off typically they will bounce back strongly around 6 days later
- Typically the bounce after a sell-off will take you 1.8-2% above where the FTSE 100 closed on the initial bad day
Best and worst ever days for the FTSE 100
The FTSE 100 was launched in January 1984 which means that I now have over 40 years of daily movements in the FTSE 100 to analyse. In doing so I was able to compile a list of the 50 best trading days and a list of the 50 worst trading days over the last 40 years, as shown below:
50 worst trading days
| Date | Daily Change |
| 20/10/1987 | -12.22% |
| 12/03/2020 | -10.87% |
| 19/10/1987 | -10.84% |
| 10/10/2008 | -8.85% |
| 06/10/2008 | -7.85% |
| 09/03/2020 | -7.69% |
| 15/10/2008 | -7.16% |
| 26/10/1987 | -6.19% |
| 11/09/2001 | -5.72% |
| 06/11/2008 | -5.70% |
| 22/10/1987 | -5.69% |
| 21/01/2008 | -5.48% |
| 15/07/2002 | -5.44% |
| 16/10/2008 | -5.35% |
| 02/03/2009 | -5.33% |
| 29/09/2008 | -5.30% |
| 27/03/2020 | -5.25% |
| 01/12/2008 | -5.19% |
| 08/10/2008 | -5.18% |
| 24/10/2008 | -5.00% |
| 14/01/2009 | -4.97% |
| 22/07/2002 | -4.95% |
| 19/11/2008 | -4.82% |
| 12/03/2003 | -4.80% |
| 01/08/2002 | -4.75% |
| 30/09/2002 | -4.75% |
| 24/08/2015 | -4.67% |
| 22/09/2011 | -4.67% |
| 19/07/2002 | -4.63% |
| 18/08/2011 | -4.49% |
| 22/10/2008 | -4.46% |
| 30/11/1987 | -4.34% |
| 11/07/2002 | -4.30% |
| 16/08/2007 | -4.10% |
| 22/03/2001 | -4.08% |
| 05/10/1992 | -4.06% |
| 03/11/1987 | -4.05% |
| 18/03/2020 | -4.05% |
| 16/03/2020 | -4.01% |
| 11/06/2020 | -3.99% |
| 18/09/2002 | -3.97% |
| 28/08/2002 | -3.95% |
| 15/09/2008 | -3.92% |
| 24/02/2022 | -3.88% |
| 17/03/2008 | -3.86% |
| 01/04/2020 | -3.83% |
| 03/15/2023 | -3.83% |
| 04/01/2000 | -3.81% |
| 14/09/2001 | -3.80% |
| 23/03/2020 | -3.79% |
50 best trading days
| Date | Daily Change |
| 24/11/2008 | 9.84% |
| 24/03/2020 | 9.05% |
| 19/09/2008 | 8.84% |
| 13/10/2008 | 8.26% |
| 29/10/2008 | 8.05% |
| 21/10/1987 | 7.89% |
| 08/12/2008 | 6.19% |
| 13/03/2003 | 6.08% |
| 10/04/1992 | 5.59% |
| 20/10/2008 | 5.41% |
| 17/10/2008 | 5.22% |
| 10/05/2010 | 5.16% |
| 15/10/2002 | 5.05% |
| 25/07/2002 | 5.00% |
| 10/03/2009 | 4.88% |
| 24/01/2008 | 4.75% |
| 11/09/2020 | 4.68% |
| 11/10/2002 | 4.66% |
| 29/07/2002 | 4.63% |
| 25/03/2020 | 4.45% |
| 12/10/1998 | 4.44% |
| 17/09/1992 | 4.44% |
| 05/01/1988 | 4.42% |
| 06/10/1998 | 4.42% |
| 04/11/2008 | 4.42% |
| 31/03/2009 | 4.34% |
| 18/05/2020 | 4.29% |
| 02/04/2009 | 4.28% |
| 17/07/2002 | 4.20% |
| 11/11/1987 | 4.18% |
| 26/09/2002 | 4.17% |
| 24/09/2001 | 4.06% |
| 30/10/1987 | 4.03% |
| 27/09/2011 | 4.02% |
| 08/09/2008 | 3.92% |
| 25/02/2022 | 3.91% |
| 26/01/2009 | 3.86% |
| 12/11/1987 | 3.86% |
| 04/03/2009 | 3.81% |
| 15/08/2002 | 3.75% |
| 06/10/2011 | 3.71% |
| 04/11/2002 | 3.62% |
| 29/06/2016 | 3.58% |
| 08/08/2002 | 3.57% |
| 27/08/2015 | 3.56% |
| 05/10/1990 | 3.55% |
| 12/02/2008 | 3.54% |
| 18/03/2008 | 3.54% |
| 25/03/2008 | 3.53% |
| 17/08/2007 | 3.50% |
What you may have noticed is that the sell-off caused by the pandemic produced a number of historic days. As mentioned, the Covid crash produced the fastest bear market in history, meaning that key stock market indices fell by 20% or more in the shortest space of time on record. Unsurprisingly, the 2nd worst day in the history of the FTSE 100 occurred during that period. In fact, so did the 6th worst day on record. The two dates in question were 9th March 2020 and 12th March 2020 which were just 3 days apart.
Conversely the second best day in the history of the FTSE 100 also occurred during 2020, on 24th March. In total, 11 of the best/worst trading days in history occurred between March 2020 and June 2020.
It is still not random
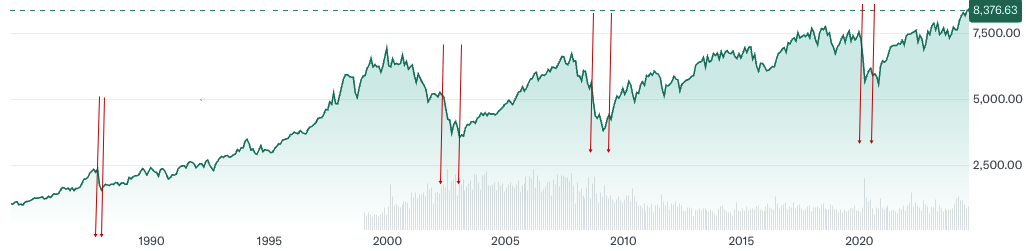
This adds further evidence to the fact that the best and worst days don't happen independently of one another. In fact rather than be spread out across the 40 year timeframe the updated chart below shows that the 50 best and 50 worst days are mostly grouped into 4 small windows centred around the biggest market corrections in history. The first was Black Monday, the second was the popping of the dotcom bubble, the third was the aftermath of the collapse of Lehman Brothers and the fourth was the pandemic in 2020. These are shown by the narrow areas between the red lines on the chart below. In fact, these four narrow time frames account for 77 of the 100 best/worst days identified above. Click on the chart to enlarge it
Long-term investors will remember the surreal nature of investment markets during 2020. At the time, the original piece of research was a comfort blanket to cling on to during the darkest days of the pandemic market crash. My favourite 80-20 Investor research articles are always those that are subsequently put to the test in live market conditions. And there hasn't been a more extreme live market test than the fastest bear market in history.
In 2020, the shortest timeframe between one of the worst days in history and one of the best days in history was just 1 day. The longest stretch was 151 days, which came after the slump on the 11th June 2020. As you can see the market rebounded during the rest of that year, but the rebound was steady and consistent and it wasn't until the Covid vaccine was discovered in November of that year that we finally saw another one of the top 50 best trading days.
But if you look at the median timeframe between the worst trading days in history, that occurred in 2020, and a subsequent 'best trading day' it was just 12 days. This was slightly longer than the historical average of 6 prior to 2015. Interestingly the research shows that rebounds in 2020 were more powerful than 'normal' with the bounce after a sell-off averaging 5.62% in a single day (versus the pre-2015 average of 4.65%). Obviously that didn't mean the market didn't head lower, but the short-squeezes were incredible that year.
Can you time the market?
So taking into account the new data, can you time the market? As I wrote last time, there will always be instances where the time between a terrible day on the FTSE 100 and one of its best days slips into months or occasionally years. We saw that again on one occasion in 2020. But is it possible to determine the typical length of time between one of the worst days and a subsequent bounce?
In the 40 years' worth of trading days there is a lot of bunching with just a few outliers, which is why I look at the median value. What you find is that following one of the worst days on the FTSE 100 you typically have to wait 7 days for one of its best performing days to appear. Or in other words...
When markets suddenly sell-off typically they will bounce back strongly around 7 days later.
That is one day higher than when I carried out the research in 2015, which is negligible.
But will you still lose money?
I once again decided to take the analysis one step further. I looked at where the FTSE 100 index was at the end of a bad day and then where it was after the subsequent 'best' day. Or in other words I was trying to see whether the bounce was worth waiting for.
As you'd expect there was a wide range of outcomes at either extreme but again there was a clustering.
Typically the bounce after a sell-off will take you 3.68% above where the FTSE 100 closed on the initial bad day.
The pandemic gave us one of the most volatile periods in stock market history, which explains why the above number has increased from the 2% from the original piece of research. The bear market happened so quickly and was so deep that the subsequent rebounds mirrored that intensity to a certain degree. This in turn had a significant impact on the long-term average.
Market overreaction
On the face of it my findings will surprise those investors who weren't aware of the original research piece. But why do rebounds happen so closely to market sell-offs? If you look back at the chart of the FTSE 100 above you will notice that the clumping I mentioned, where the best and worst trading days occur, are at the latter stages of a wider market correction. This is because at the start of an unfolding severe market correction investors are in denial and remain in the market. However once the trend becomes entrenched panic sets in and investors bail out en-masse.
This is when the biggest daily falls occur. However, there always comes a point when the market is oversold and eventually bounces back. This is when the best trading days occur as the fearless investors spot the value opportunities and everyone else catches on. The market then continues to climb but in a more tentative fashion as investor confidence returns.
So when the markets sell-off dramatically what should you do?
Clearly there is no fool-proof strategy but history suggests that following a severe market correction you could be better off staying in the market, especially if it comes after the market has already been falling. It's a case of holding your nerve as a knee-jerk reaction will crystallise the loss and you'll miss the subsequent bounce.

£200 Pension Cashback Offer
Make a qualifying deposit or transfer a pension to our partner Interactive Investor.
- Deposit or transfer a pension of at least £20k and you could earn £200 cashback
- Terms and Fees apply, Capital at risk
- New & Existing customers opening a SIPP
- Offer ends 31st July 2026
Before starting your transfer, check you won't lose any valuable benefits (such as guaranteed annuity rates or a lower protected pension age) and find out what exit fees you might have to pay
