

Over the past year holding a cash position in your portfolio has been a shrewd and profitable move as bonds and equities have struggled. As you will know my own £50k portfolio has had an elevated cash position for much of this year, typically between 5-7%.
Actively deciding to hold cash in a portfolio, whether it be to preserve capital or being ready to deploy back into the market, is one thing however holding cash over the longer term obviously raises its own problems. These include the threat of inflation erosion as well as the opportunity cost in terms of lost returns elsewhere. But obviously once the short-term benefit of holding cash passes it's sensible to invest the money into assets once again for the long term growth opportunities. However most investors are unaware that some of the funds within their portfolio may be holding significant cash positions.
Fund managers, be they running unit trust or investment trusts, will invest in accordance with a mandate that states how the fund will be managed and the types of assets that will be held. As such fund managers don't tend to have significant cash holdings because over the long term they can act as a performance drag making it hard for the manager to beat their benchmarks. But more importantly, it is hard for a fund manager to justify their fees if they are holding a lot of cash. Effectively they are not doing the job investors are paying them to do while investors are effectively paying to invest in cash which is a guaranteed way to lose money.
It is not unusual for funds to hold some cash, mostly temporarily, in order to facilitate transactions; however the amount typically accounts for less than 5% of the fund's assets. Having carried out an extensive amount of analysis there are a lot of funds that hold much more than this, some with over 20% cash holdings. Don't forget, investors will typically still be charged management fees on this cash that isn't invested. Cash is King (or can be) if you decide to hold it yourself, but not if you are unaware you are holding it and you are being charged for the privilege.
Identifying cash heavy funds
So in this article I have analysed the cash (or cash-like) holdings of over 1,200 unit trusts as well as over 60 investment trusts. The aim is to identify those funds you may want to take a second look at, if you hold them, and investigate their fund factsheets further.
One issue with analysing so many funds is that different managers classify assets differently. Not only that but some managers update their holdings data less frequently than others. Because of this I have produced heatmaps that give an indication of the percentage cash holding for different funds. The table is based upon each fund's percentage exposure to "money markets", according to the latest data available. In most instances "money markets" means simply cash, but it can include some alternative cash-like assets and also some very short-dated government debt.
Unit trusts - cash allocation
Below is a key to colour-coding for the heatmap.
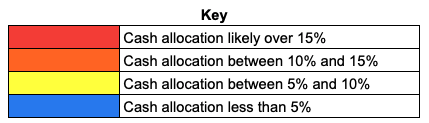
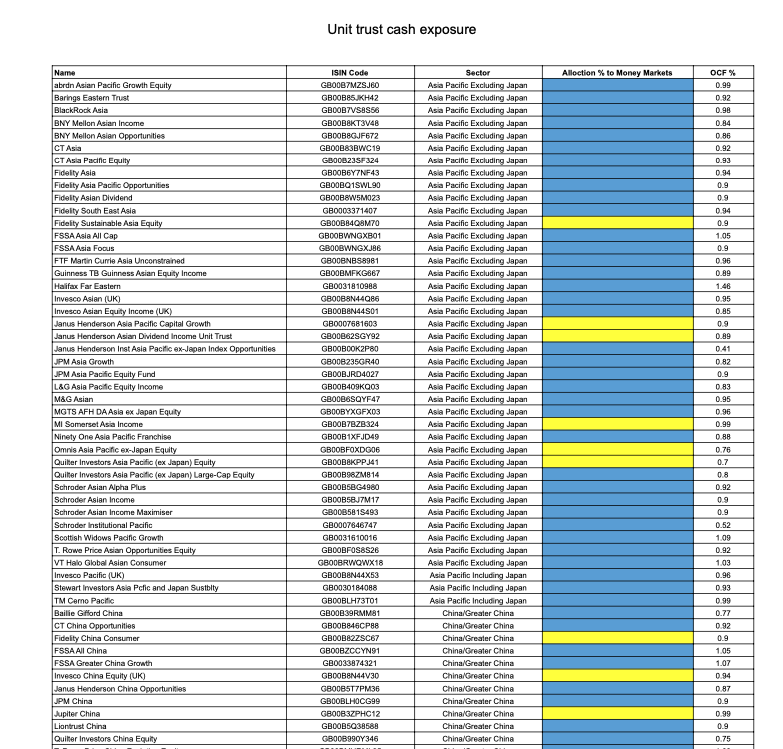
If a fund appears to have a large money market allocation then seek out the fund's latest factsheet for further information. From there you will be able to get an accurate picture and it may be that the fund's cash holding is smaller than indicated. Beside each fund I have also included the OCF - which is an indication of the percentage annual management charge. So not only can you see if a fund has a high allocation to cash but also those funds that are charging you heavily for the privilege.
(Click on the image to download the full heatmap)

Interestingly if you plot all 1,200+ unit trust on a scatter graph showing their cash allocation versus their annual management charge you can see that there is a weak trend (the red line) that the higher the OCF the higher the cash allocation is likely to be.
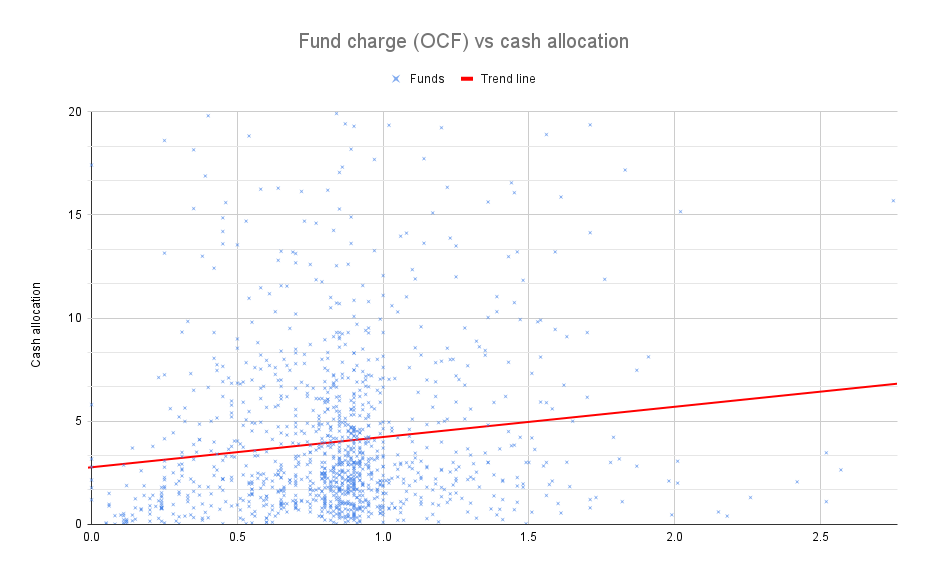
The table below summarises the cash allocations versus annual charge and you can see that as the OCF increases as the average cash allocation of the fund increases.
| Cash allocation% | Number of funds | Average OCF % (annual cost) | |
| Average across all 1,200+ unit trusts | 4.87 | 1267 | 0.84 |
| Blue funds | 0 to 5 | 900 | 0.82 |
| Yellow funds | 5 to 10 | 241 | 0.872 |
| Orange funds | 10 to 15 | 63 | 0.915 |
| Red funds | 15+ | 63 | 0.986 |
To a certain extent this makes sense, the higher the fund charges the more likely that the fund is an actively managed fund and therefore the greater the chance that the manager decides to hold cash, even if it is temporarily. But it is a concerning trend, as it means the more you pay, the more likely you are to be paying to actually hold cash. The question is whether this impacts performance and as my past research shows it often does (see my article "The sectors where active funds beat passives")
If you look at the scatter graph above you can see a cluster of funds with an OCF around 0.9% and with a cash allocation below 5% (the average is 4.87%). This area is the sweet-spot for most actively managed funds. If you look to the far left of the chart you can see that low-costing funds (which will inevitably include passive trackers) have hardly any exposure to cash. So if you want to remain fully invested, then perhaps the answer is to hold more passive funds.
But are certain types of fund managers more likely to hold cash or cash-like assets than others? The answer is yes. The chart below shows the average cash allocation for funds in each unit trust sector.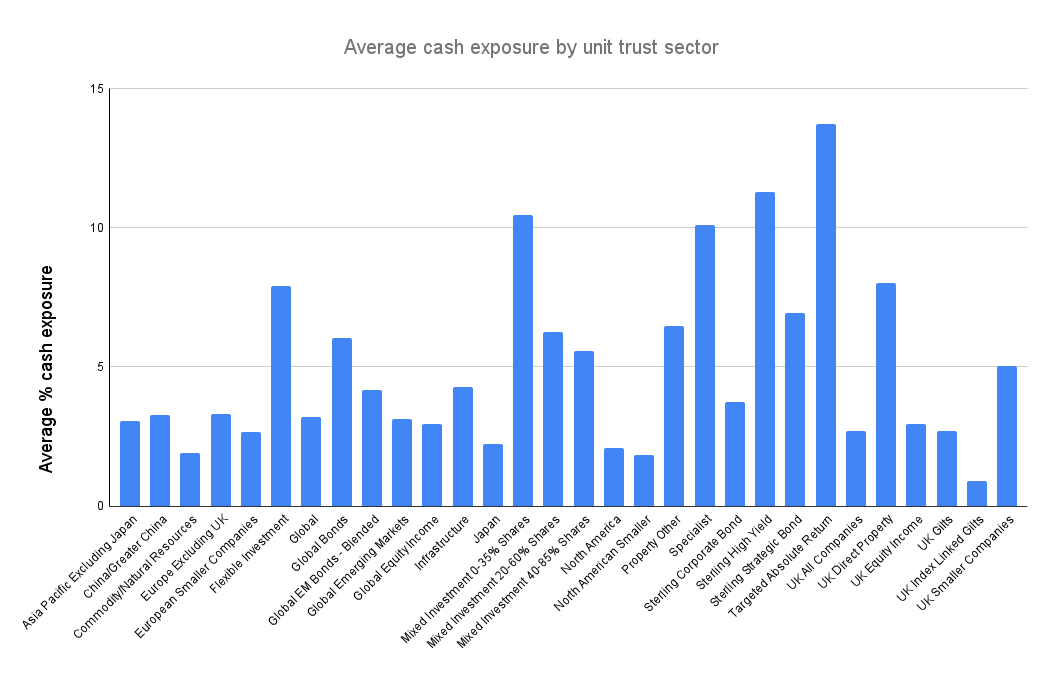
The sectors most likely to have the highest cash exposure (more than 10%) are those from the following sectors:
- Flexible Investment
- Mixed Investments 0-35% Shares
- Specialist
- Sterling High Yield
- Targeted Absolute Return
- UK Direct Property
Clearly unit trusts that invest in illiquid assets (such as UK Property) are more likely to hold much higher allocations to cash in order to meet investor withdrawal requests and avoid having to gate the fund. In fact, there have been instances where property funds holding such large cash balances (sometimes over 20% of the fund's assets) have agreed to not charge management fees on the portion of the fund held in cash.
In the case of funds from the Flexible Investment sector and especially those from the Targeted Absolute Return sector they often have a benchmark that is based upon a certain percentage they need to achieve above a cash benchmark. So it follows that they are likely to invest in cash or cash-like investments. The high cash allocation of Targeted Absolute Return funds explains why these funds often produce low long-term returns and why they have fared well in 2022.
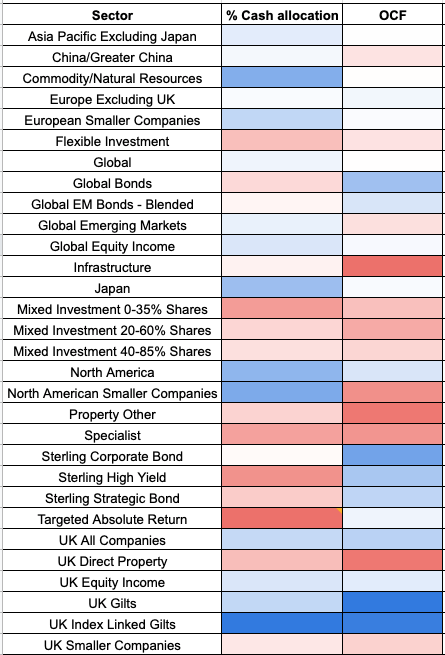
Unfortunately it does tend to follow that those sectors with the highest cash balances often tend to have some of the highest charges. The heatmap below compares the two variables, where blue signifies the lowest value for each column (either OCF or cash allocation) and red is the highest (i.e the worst).
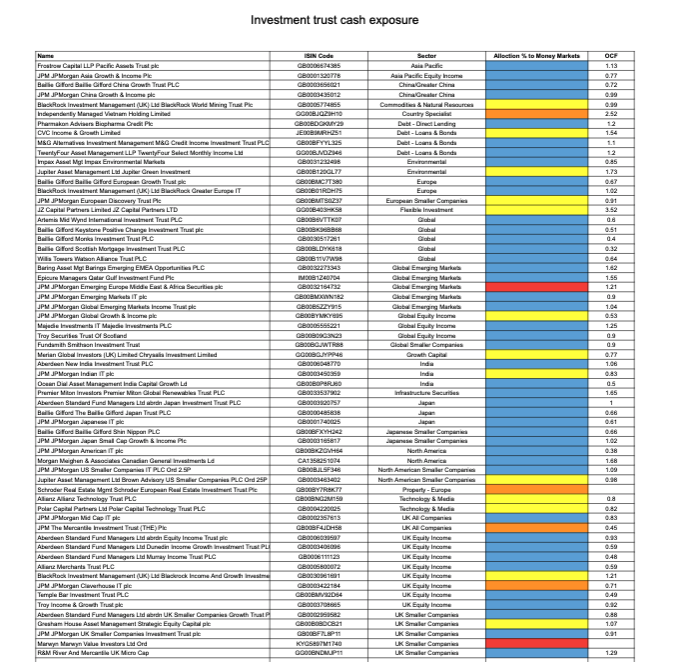
Investment trusts - cash allocation
High cash balances don't just occur in unit trusts, they also occur in investment trusts where the liquidity issue is less acute. Interestingly, investment trusts on average held 6% in cash and had an average OCF of 0.98%, both higher than the equivalent figures for unit trusts.
(Click on the image to download the full heatmap)

Summary
In summary:
- Holding higher cash positions can be advantageous in the short-term, as long as you are in control of it
- It is possible that your portfolio could hold more cash than you realise
- More actively managed funds are more likely to hold higher cash allocations
- Funds from certain unit trust sectors are much more likely to hold higher cash positions than funds from other sectors (such as equity sectors) and charge more
- Typically unit trust fund managers tend to hold under 5% in cash, although they can temporarily hold more.
- The investment trusts analysed held more cash than their unit trust peers (6%) which was unexpected.

£200 Pension Cashback Offer
Make a qualifying deposit or transfer a pension to our partner Interactive Investor.
- Deposit or transfer a pension of at least £20k and you could earn £200 cashback
- Terms and Fees apply, Capital at risk
- New & Existing customers opening a SIPP
- Offer ends 31st July 2026
Before starting your transfer, check you won't lose any valuable benefits (such as guaranteed annuity rates or a lower protected pension age) and find out what exit fees you might have to pay
