

What a difference a day makes
Within my recent monthly newsletter commentaries I mentioned that October is historically the worst month for stock market returns. In fact there have been numerous studies that examined how the stock market typically performs each month. Or in other words they examined the seasonality of stock market returns.
However for DIY investors, particularly those investing in funds for the long term, this is of limited use. That's because you should only invest money if you don't need access to it for at least 5 years.
Therefore what the stock market does over 5 years is far more important than what happens in any given month. But what I wanted to explore is whether there is a better time to invest, in any given year, to increase your chances of boosting returns. It's a question that until now has not been answered.
In fact I wanted to go as far as to see if investing on specific days of the year increases your investment returns.
How I worked it out
To try and answer the above questions I analysed every trading day on the FTSE 100 since its inception in December 1983. That means I analysed over 8,300 trading days. I then analysed what happened if you had invested in the FTSE 100 on each day since 1983 and sold out 5 years later. So for example, investing on 1st January 1984 and then selling out on 1st January 1989 etc.
I then calculated the average return for every day of the year. As you can imagine this was extremely difficult. That allowed me to not only calculate the average rise in the FTSE 100 Index (ignoring dividends) for any given day of the year but also to pick out the best and worst days to invest.
I was also able to determine the best and worst times of year to invest and the results
The best and worst days of the year to invest
I was able to calculate that over any given 5 year period the FTSE 100 rose by 36.21% on average, which gives the following figures some context
The 20 best days to invest
The best day to invest is the 3rd January which is often the first trading day of the New Year. In fact 4 of the top five days to invest are in January. Call this the New Year effect.
What is interesting is that the end of February. Both the 28th February and 29th February are in the top 20 best days. That bodes very well as we enter 2016 (a leap year). However, the figure for the 29th February is likely to be a statistical anomaly as there have been far fewer leap years than normal years since 1983. Also add in the fact that there has been even fewer 29th Februarys that were trading days (i.e. so the market was open so you could invest) it would suggest the outperformance to be a statistical outlier due to a low sample size.
| Day | % average rise in FTSE 100 Index over next 5 yrs |
| 03/01 | 43.20 |
| 10/01 | 42.72 |
| 24/01 | 42.46 |
| 17/01 | 42.45 |
| 14/02 | 41.85 |
| 19/07 | 41.78 |
| 27/12 | 41.76 |
| 07/02 | 41.74 |
| 28/02 | 41.74 |
| 07/03 | 41.71 |
| 31/01 | 41.68 |
| 21/02 | 41.39 |
| 12/07 | 41.25 |
| 20/12 | 41.07 |
| 13/12 | 41.06 |
| 29/02 | 40.88 |
| 06/12 | 40.85 |
| 23/01 | 40.81 |
| 14/03 | 40.74 |
The worst days of the year to invest
| Day | % average rise in FTSE 100 Index over next 5 yrs |
| 30/06 | 31.36 |
| 10/11 | 31.28 |
| 15/12 | 31.17 |
| 17/11 | 31.16 |
| 03/11 | 31.12 |
| 22/12 | 31.03 |
| 24/11 | 30.85 |
| 28/07 | 30.82 |
| 04/08 | 30.21 |
| 20/10 | 30.19 |
| 11/08 | 30.18 |
| 25/08 | 30.00 |
| 18/08 | 29.73 |
| 01/09 | 29.41 |
| 08/09 | 29.27 |
| 15/09 | 28.69 |
| 06/10 | 28.29 |
| 29/09 | 28.03 |
| 13/10 | 27.77 |
| 22/09 | 27.31 |
What time of year should you invest to boost returns?
Both of the above tables hint at a potential trend, with the worst days being centred around the Autumn. So I collated the average return for each day of the year and then charted them using a moving average to smooth out the line. I also removed the anomalous impact of the 29th February. The red line, in the chart below, is the average rise in the FTSE 100 for any given 5 year period. So if the black line (the average rise for any day of the year across the year) is above the red line it means that it is more profitable to invest during that period.
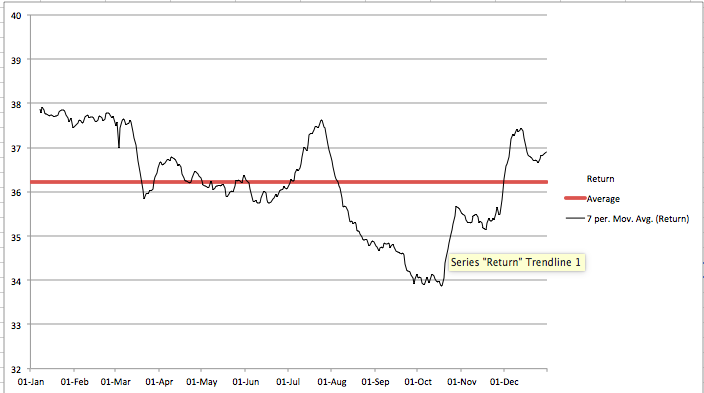
The analysis shows:
- that the most profitable time to invest is between December and March
- July is also profitable, somewhat surprisingly
- Late summer (August) through Autumn is the worst time to invest
In fact if you look at it purely on a month by month basis (by ranking the months by the number of profitable days which they contain) the best months of the year to invest are (in order):
- July
- January
- December
- February
- March
- May
- November
- April
- June
- August
- October
- September
So why the variations? I think there is a likely rational explanation. For starters, December often sees a Santa Rally (read my article Will there be a Santa Rally this year?) so investing just as one begins and selling as one is in motion should theoretically boost returns. If you recall a Santa Rally is the name given to the tendency for the stock market to rise into the year end.
Also, January to March is the peak of Stocks and Shares ISA sales. So this increase in demand is likely to have a knock-on effect within the stock market. If more people buy into the market the price of the FTSE 100 should rise. Conversely April sees a drop off in ISA sales after the tax year end, so perhaps it is not a surprise to see this month languishing at the foot of the rankings. If the overriding trend is a reflection of investor demand perhaps July is the pre-holiday rush as people sort their finances before enjoying some sun.
Yet what the research unequivocally shows is that we are now entering a good time historically to invest

Book a free financial review
Looking to ensure your finances are on track? Our partner Unbiased will arrange for a qualified, FCA-regulated adviser to contact you
- Discuss your financial situation
- Identify what steps, if any, you should take
- Free and without obligation
