


| Name | Year to date % |
| FTSE Eurofirst 300 | 15.64 |
| Nikkei 225 | 15.12 |
| MSCI AC World | 13.7 |
| S&P 500 | 11 |
| FTSE 100 TR in GB | 8.52 |
As we reach the end of November our attention turns to the final weeks of 2017 and the Santa Rally. It's a theme I've not looked at for a couple of years so I thought it time to update my previous research. This year the Santa Rally phenomenon is particularly interesting given the scale of this year's equity rally to date.
What is the Santa Rally?
The Santa rally is the name given to the end of year stock market rally. But like all the well known investment axioms there's a lack of analysis or hard facts surrounding the phenomenon. For example assuming there is such thing as a Santa Rally, when does it start? Traditionally the term Santa Rally describes a rally in stock prices in the month of December, or sometimes more specifically the trading days between Christmas and the second trading day of January. The reasons given for why we sometimes see a rally at this time of year range from traders closing loss making trades for tax purposes (and then reinvesting) to simple Christmas euphoria.
So to analyse this trend I've updated my previous research to now stretch back over 23 years of stock market movements to see if there is any evidence of a Santa Rally.
Does the Santa Rally exist?
The Santa rally is often more talked about in the US and where the US stock market leads other markets tend to follow, including the UK. The chart below shows the average stock market returns in the US and UK by month over the 30 year period to 2015. December is clearly the best month of the year for stock market returns.
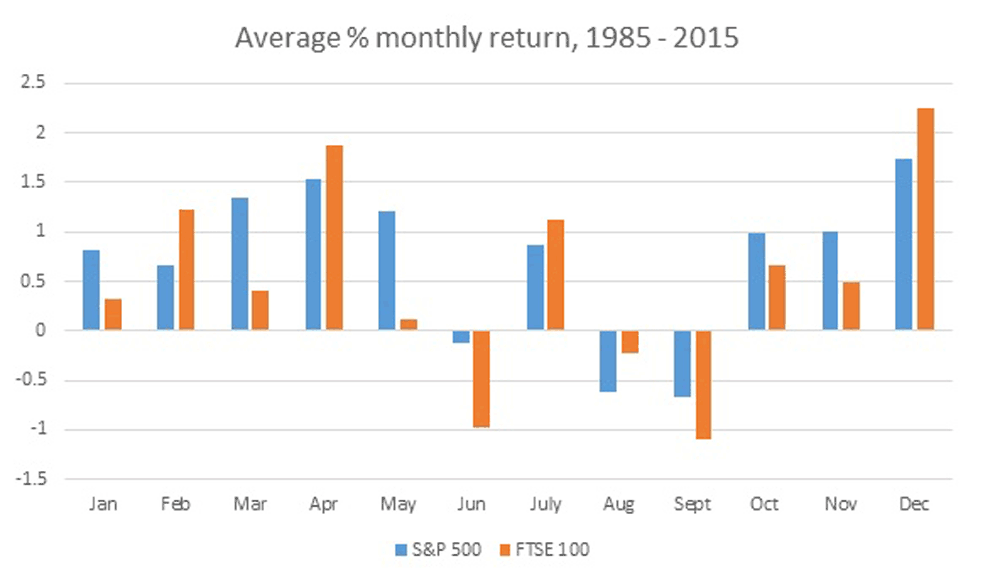
(chart courtesy of IG)
But how does the performance of the stock market in the lead up to December affect the possibility of a Santa rally? To answer this I analysed the price movements in the S&P 500 (in the US) during the 11 months up to the end of November and then for December itself during each of the last 22 years. We had a Santa Rally on 16 out of the 22 years, which equates to 73% of the time.
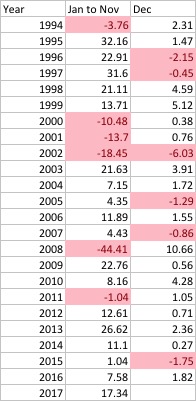
- If you look at the chart the evidence for the existence of a Santa rally is strong.
- The frequency of a Santa rally has even increased since the financial crisis. In 8 of the last 9 years (which equates to 89% of the time) December has been a positive month with only 2015 being the exception.
- There is no clear correlation between what happens in the first 11 months of a year and whether a Santa rally will occur or not. It was only in 2002, during the aftermath of the dotcom bubble bursting, that a poor Jan-Nov preceded a poor December. Weak market conditions during the year do not automatically mean a poor December will follow.
- When there was a very strong market rally in the first 11 months of the year (at least as big as we've had in 2017) a Santa rally occurred 71% of the time (5 out of 7 occasions), which is consistent with the wider Santa rally odds for the last 30 years. So it is no more or less likely to occur than in any other year.
What about in the UK stock market & can you predict a Santa Rally?
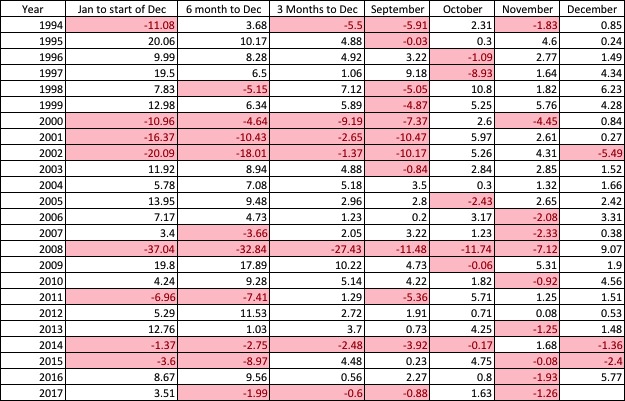
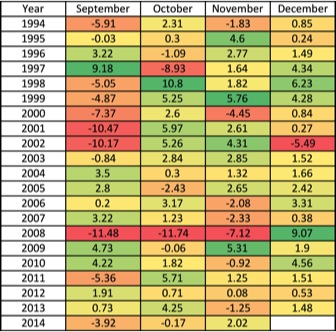
The table below shows the price move in the FTSE 100 over the last 23 years. It looks at the movements for the months preceding December as well as for December itself in each year. Just like the table above, negative returns are highlighted in red. Click to enlarge
To sum up:
- The stock market has risen in 20 of the last 23 years in December, which suggests that a Santa rally in the UK occurs around 87% of the time
- The average return in December is 1.89%
- Interestingly two of the three years where there wasn't a Santa rally occurred as recently as 2014 and 2015.
- Another pattern that is now apparent is that in 8 of the 9 years when November was a negative month it lead to a positive December. This bodes well for 2017 as the FTSE 100 is currently down for November. The exception was 2015 although November was only down -0.08% in that year.
20 positive December's out of 23 is statistically very significant. In theory in any given month you can either make money or lose money. So the binary nature of the outcome would lead you to expect the distribution to be nearer 12 good vs 11 bad years (or 11 good vs 12 bad) rather than 20-3. Of course that is slightly simplistic but just look at the columns for September, October and November above - the spread of good and bad years is much more in line with what you might expect. So the odds are that a Santa rally will occur in any given year.
Parallels with 2007?
If you look at the table above and follow through 2006 and into 2007 and then compare this pattern to 2016 to 2017 the setup is very similar, although the FTSE 100 struggled more this summer as a result of Brexit angst than it did in 2007. If the pattern was to continue it would suggest only a small positive return this December. Ominously in 2007 the financial crisis was just around the corner.
Can you predict the scale of a rally?
In theory a rally is simply when you make some money in December. So making 0.1% would be a rally as there is no definition of what constitutes a surging market. But can you get an indication of the size of any potential rally? The table below is a replica of the table above but coloured coded. Each month has been graded from green to red, with the strongest positive stock market moves in dark green while the biggest falls are in dark red. So you can pick out unusually strong or weak months.
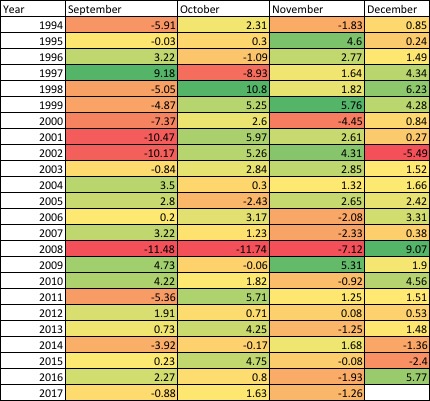
What becomes apparent is that the strongest Santa rallies (and falls) are preceded by strong market swings, both positive and negative. Essentially providing a springboard to a stronger December. Back in November 2015 when I performed this analysis the November figure was sitting at -0.49%. At the time I suggested that we needed that month to finish further in the red for it to possibly set-up a Santa rally. In the end November 2015 ended marginally down at -0.08% and the Santa rally didn't happen. Whether that prediction was luck on my part or not, this tendency for weak Novembers to precede strong Decembers was repeated in 2016.
Summary
Statistics suggest that the Santa rally does exist and based on recent history there is around a 70-80% chance of it occurring (depending on which market you look at) in 2017 despite the equity rallies we've seen globally this year. The exact timing of any rally remains difficult to pin down but usually occurs at some point after the last two weeks of November. However, macro events such as Donald Trump's election win in 2016 can suddenly skew the odds in favour or against a rally happening. This year Donald Trump has promised a tremendous tax cut for Christmas which the stock market is betting on happening. If it doesn't materialise (or at least doesn't look like being achieved in early 2018) we could see the stock market wobble and Trump likened more to the Grinch than Santa.

£200 Pension Cashback Offer
Make a qualifying deposit or transfer a pension to our partner Interactive Investor.
- Deposit or transfer a pension of at least £20k and you could earn £200 cashback
- Terms and Fees apply, Capital at risk
- New & Existing customers opening a SIPP
- Offer ends 31st July 2026
Before starting your transfer, check you won't lose any valuable benefits (such as guaranteed annuity rates or a lower protected pension age) and find out what exit fees you might have to pay
