


What is the Santa Rally?
The Santa rally is the name given to the end of year stock market rally. But like all the well-known investment axioms there's a lack of analysis or hard facts surrounding the phenomenon. For example assuming there is such a thing as a Santa Rally, when does it start? Traditionally the term Santa Rally describes a rally in stock prices in the month of December, or sometimes more specifically the trading days between Christmas and the second trading day of January. The reasons given for why we sometimes see a rally at this time of year range from traders closing loss-making trades for tax purposes (and then reinvesting) to simple Christmas euphoria.
So to analyse this trend I've updated my previous research, plus added some new angles, and look back at almost 50 years of stock market movements to see if there is any evidence of a Santa Rally.
Does the Santa Rally exist in US equities?
The table below shows the performance of the S&P 500 from January to November and then December for each year going back to 1994.
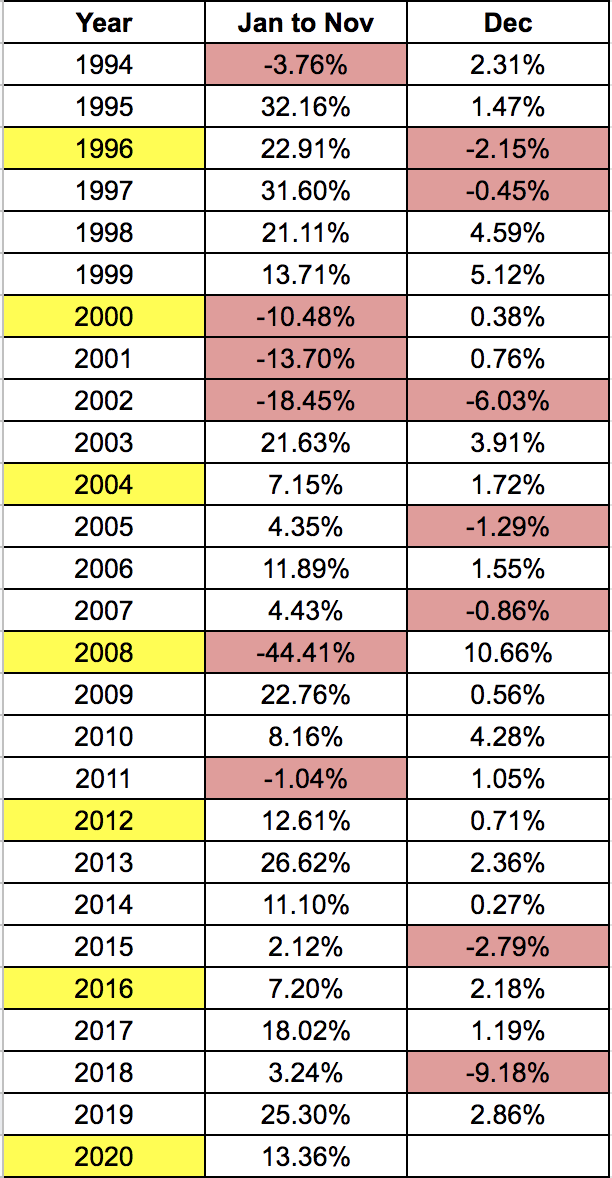
The first thing to note is that there is no clear correlation between what happens in the first 11 months of a year and whether a Santa rally will occur or not. However, that doesn't mean that there aren't some interesting observations.
First of all, there have been 19 Santa rallies in the last 26 years, which equates to a frequency of 73%. Despite a dismal 2018, this is exactly the same percentage as when I carried out similar analysis in 2017. That means that the odds are favourable that a Santa Rally will occur in any given year, with the odds being way higher than the 50% expected by pure chance alone. Clearly, there is seasonality to equity markets and the average return during December since 1994 has been 0.97%.
Anecdotally the Santa rally is supposed to be good for US technology stocks. However, if I rerun the above table but this time using the NASDAQ 100 then the pattern looks very different
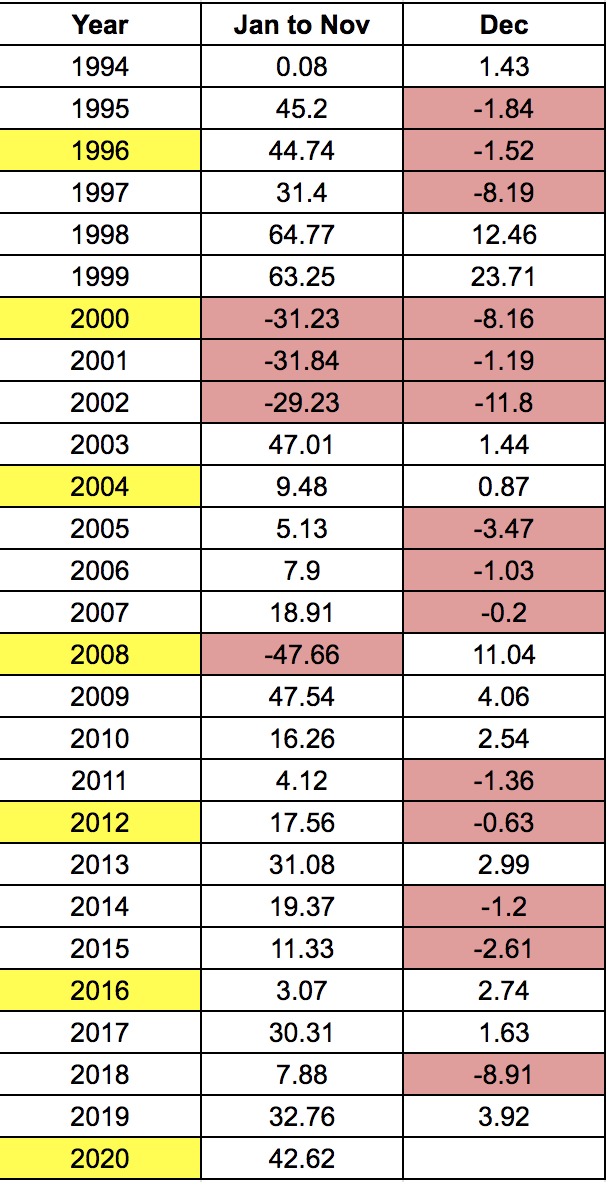
In fact, tech stocks don't particularly like December with 14 out of 26 years in the sample producing negative returns in the last month of the year. So there is no evidence of a Santa rally existing in US tech stocks, and the average return in December is also lower at 0.64%.
Does the Santa rally exist in the UK?
The table below shows the price move in the FTSE 100 over the last 26 years. It looks at the movements for the months preceding December as well as for December itself in each year. Just like the table above, negative returns are highlighted in red (click to enlarge).
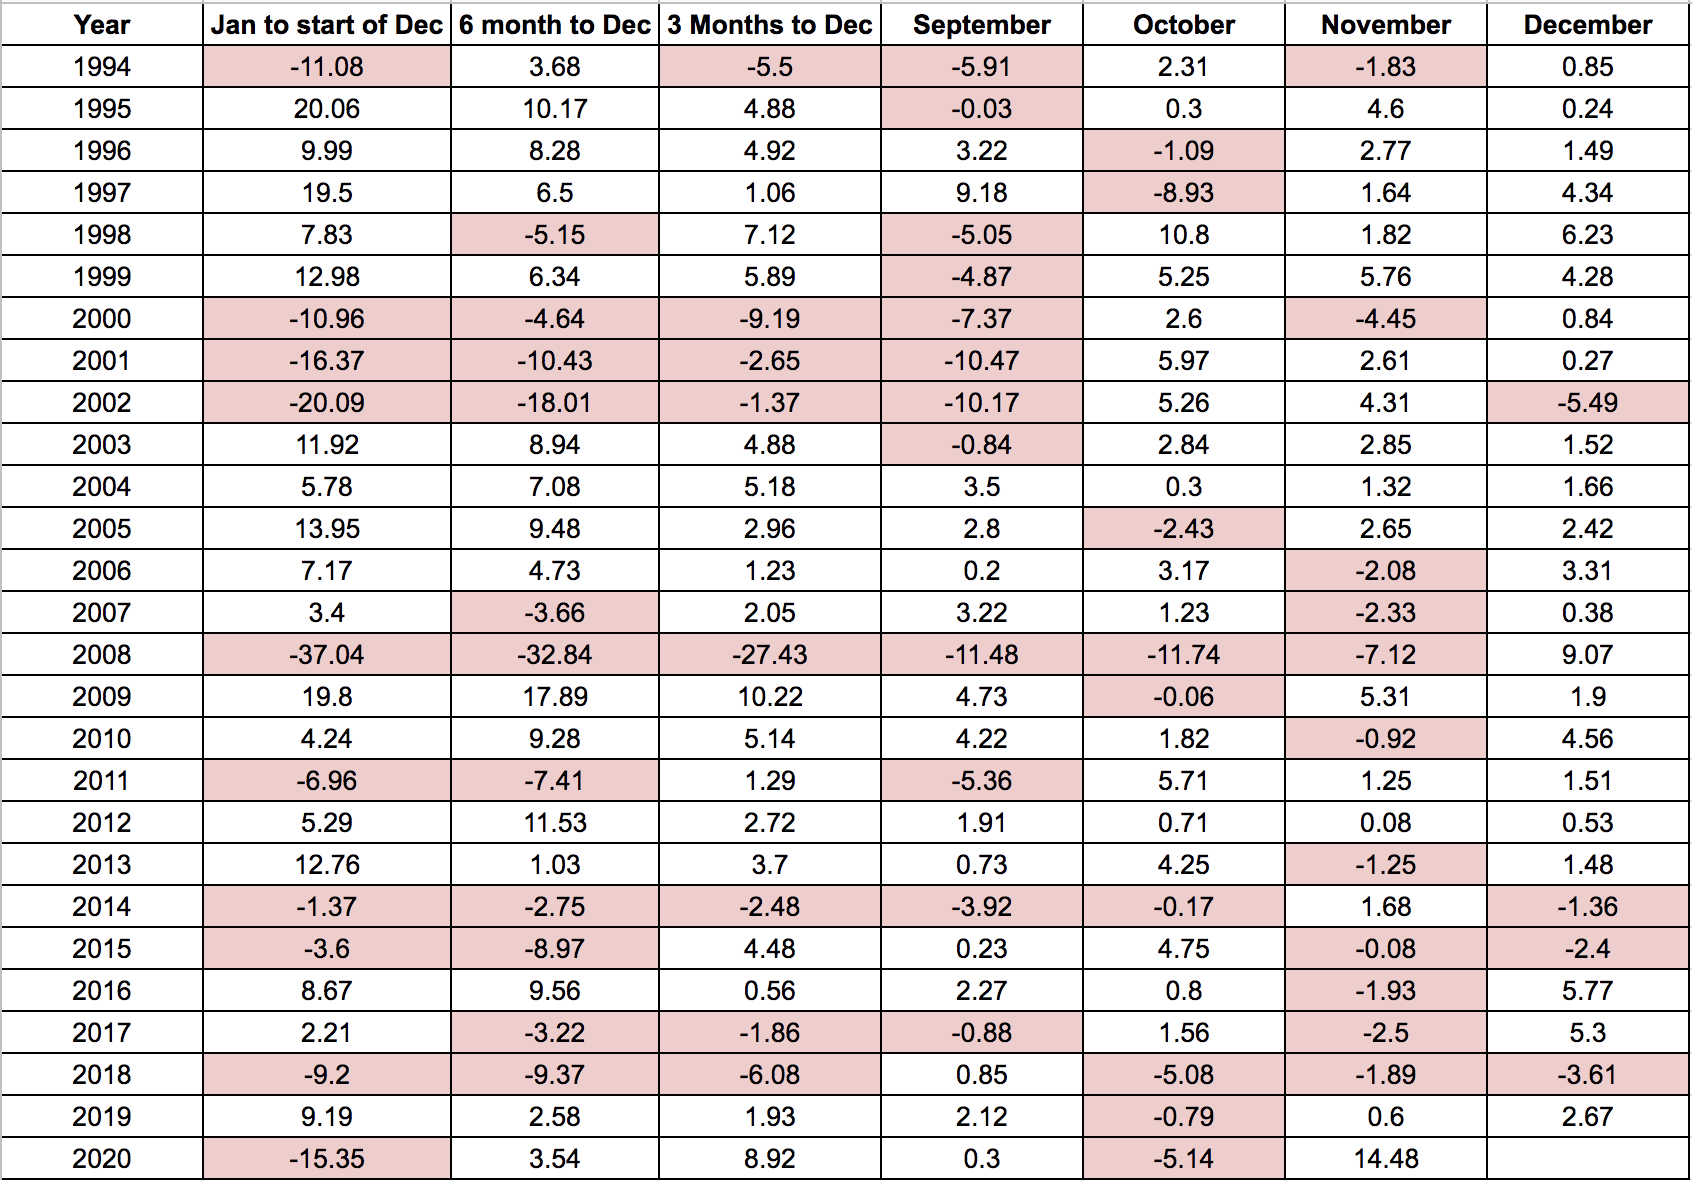
The evidence suggests that the Santa rally is in fact more prevalent in UK equities, with December being positive in 22 years out of the last 26. That is a hit rate of almost 85%, which is astonishingly high. Not only that, if you look at 2018, the annus horribilis for US stocks, the FTSE 100 only fell 3.61%. It means that on average the FTSE 100 has rallied 1.84% in December, over the last 26 years, almost twice that of the S&P 500 and three times that of the NASDAQ 100. Interestingly 2018 was a year that broke the mould on a number of Santa rally trends and it means that there is no discernible pattern between what goes on during the rest of the year and what happens in December.
The Santa rally could become the ghost of Christmas past
Upon analysing the data, there are two previously unnoticed trends developing. The first table below shows the frequency and average return of the Santa rally in the S&P 500 during recent timeframes. The second chart shows the same for the FTSE 100.
| Time period | S&P 500 average Dec return |
Frequency of Santa rally
|
| Since 1994 | 0.97% | 0.73 |
| Last 20 years | 0.71% | 0.75 |
| Last 10 years | 0.29% | 0.8 |
| Time period | FTSE 100 average Dec return | Frequency of Santa rally |
| Since 1994 | 1.84 | 85% |
| Last 20 years | 1.52 | 80% |
| Last 10 years | 1.45 | 70% |
In the US the odds of a Santa rally have been increasing over time yet the size of any rally has been rapidly falling. Similarly in the UK the average size of any Santa rally has been falling, but so too have the odds of even seeing one. We can only speculate as to why. Perhaps it has something to do with the amount of market manipulation from central banks, via their monetary policy measures. The average return from January to November in the last 20 years on the S&P 500 was 4.93%, whereas in the last 10 years that has increased to 11.33%. Perhaps indicating that the flood of easy money via quantitative easing has diluted the seasonality in equity markets by artificially boosting stock prices all year round.
2020 could be an unusually good year for the Santa rally
In the first two charts in this article, you may have noticed that certain years were highlighted yellow. These represent US election years. If you look closely you can see that they appear to be good years for a Santa rally. So I decided to look at all the US election years going back to 1972, which is the furthest I could go back on the S&P 500.
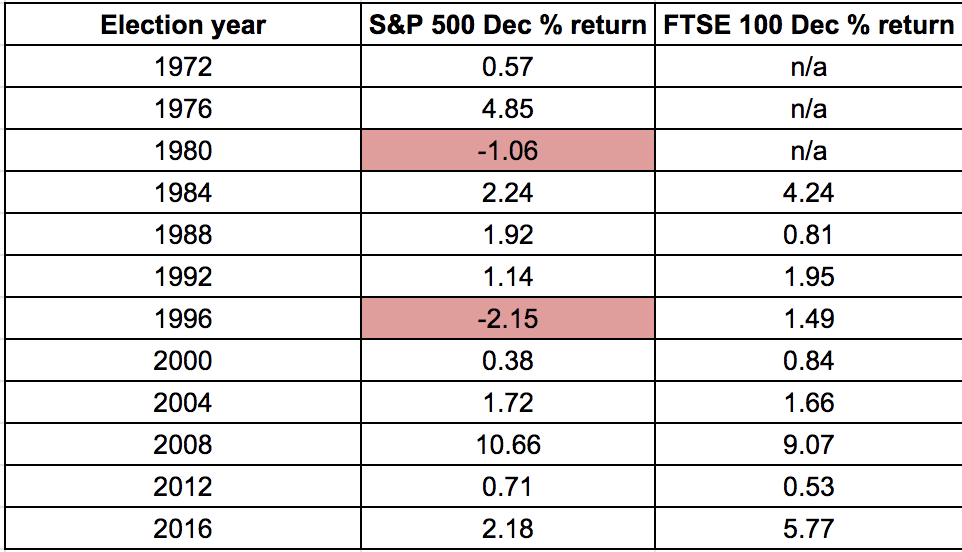
You can see that on 10 out 12 occasions (83% of the time) when there was an election we saw a Santa rally. More impressively since the FTSE 100 was launched in 1984 we have seen a Santa rally in every US election year since!
Summary
So to sum up:
- The Santa rally phenomenon (looking at the whole of December) certainly exists
- It is more prevalent and more profitable in UK equities than US equities.
- It doesn't exist in US technology stocks, despite conventional wisdom
- But it is becoming more difficult to exploit and its profitability is reducing over time
- What happens preceding the month of December has no discernable impact on the likelihood of a Santa rally, even a stellar November such as we've seen this year makes no difference.
- The odds of a Santa rally are greater in a year where there is a US election such as 2020, again, especially in UK equities.

£200 Pension Cashback Offer
Make a qualifying deposit or transfer a pension to our partner Interactive Investor.
- Deposit or transfer a pension of at least £20k and you could earn £200 cashback
- Terms and Fees apply, Capital at risk
- New & Existing customers opening a SIPP
- Offer ends 31st July 2026
Before starting your transfer, check you won't lose any valuable benefits (such as guaranteed annuity rates or a lower protected pension age) and find out what exit fees you might have to pay
