


What is the Santa Rally?
As a recap, the Santa rally is the name given to the end of year stock market rally. Traditionally the term Santa Rally describes a rally in stock prices during the month of December, or more specifically the trading days between Christmas and the second trading day of January. For the purposes of this research article I will assume the term Santa rally relates to a positive stock market return during December.
Does the Santa Rally exist in US equities?
The table below shows the performance of the S&P 500 from January to November and then December for each year going back to 1994.
S&P 500
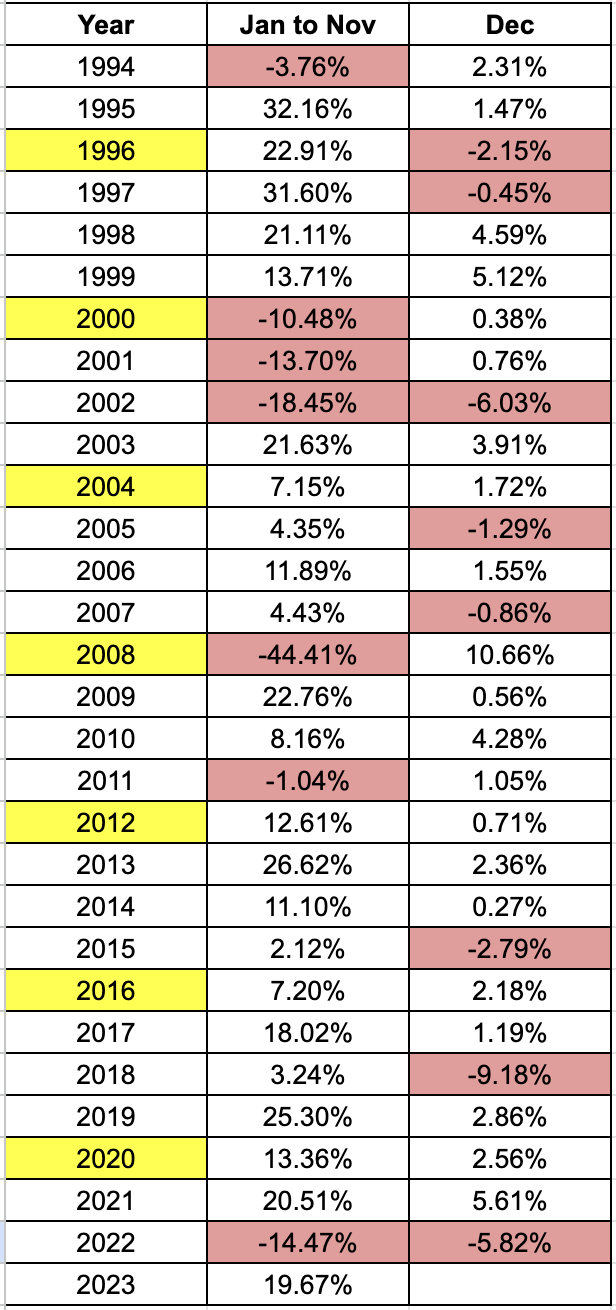
The first thing to note is that there is no clear correlation between what happens in the first 11 months of a year and whether a Santa rally will occur or not. However, that doesn't mean that there aren't some interesting observations. The table below shows the frequency of a Santa rally for the S&P 500 along with the average December % performance over various time frames. The numbers in brackets are the comparable figures from my last update back in 2020.
| Time period | S&P 500 average December return |
Frequency of Santa rally
|
| Since 1994 | 0.95% (0.97%) | 72% (73%) |
| Last 20 years | 1.08% (0.71%) | 75% (75%) |
| Last 10 years | -0.08% (0.29%) | 75% (80%) |
| Last 5 years | -0.79% (-1.15%) | 60% (60%) |
There have been 21 Santa rallies in the last 29 years on the S&P 500, which equates to a frequency of 72%. This is marginally down on the 73% frequency I calculated when I carried out the analysis in 2020. That means that the long-term odds suggest that a Santa Rally is likely to occur in any given year, with the odds being higher than the 50% expected by pure chance alone. Clearly, there is seasonality to equity markets and the average return during December since 1994 has been 0.95%. However, there is evidence that the Santa rally has begun to weaken. The odds over the last 10 years of a Santa rally have fallen, but also the average return is now negative at -0.08%. Over the last five years the situation has improved marginally since I last ran the analysis but still the odds and average return are far worse than over longer time frames.
Nasdaq 100
Anecdotally the Santa rally is supposed to be good for US technology stocks. However, if I rerun the above table but this time using the tech-heavy NASDAQ 100 then the pattern looks very different.
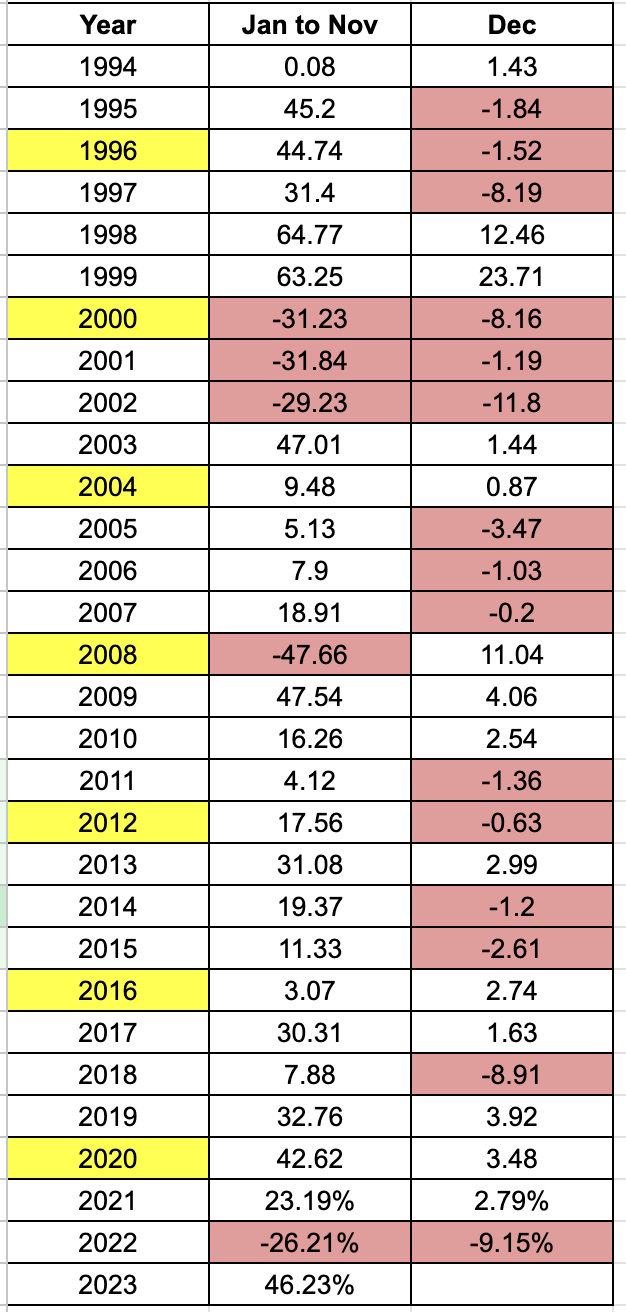
In fact, tech stocks don't particularly like December with 15 out of 29 years in the sample producing negative returns in the last month of the year. There is no evidence that the Santa rally phenomenon exists in US tech stocks, in fact, the long-term odds, based on the data going back to 1994, of a positive December are just 48%. Meanwhile the average long-term return in December has fallen to 0.48% (down from a long-term average of 0.64% calculated back in 2020). The situation seems to be getting worse with the average December return over the last 10 and 5 years significantly worse than previously (see table below).
One trend to note is that the odds of a Santa rally have improved over time with the Nasdaq 100, unlike the S&P 500 where the odds have dropped. But, trying to play the Santa rally with tech stocks is a risky strategy, given the worsening December performance record in recent years (see the Santa or bust section below for more on this).
It is interesting to see that the average December return improved in the 20 year scenario from the last time I ran the analysis, but this is purely a quirk of the 'dotcom bubble pop' years (2000 to 2002) falling out of the calculation. Similarly the long-term positive average December return for the Nasdaq 100 since 1994 is a result of the dotcom rally in 1998 and 1999, ahead of the bubble eventually bursting. If we were to remove the entire dotcom boom and bust era (1998 to 2002) from the data the long-term average would be negative.
| Time period | Nasdaq 100 average Dec return |
Frequency of Santa rally
|
| Since 1994 | 0.48% (0.64%) | 48% (46%) |
| Last 20 years | 0.45% (-0.47%) | 55% (45%) |
| Last 10 years | -0.43% (-0.09%) | 60% (50%) |
| Last 5 years | -1.57% (-0.65%) | 60% (60%) |
Does the Santa rally exist in the UK?
The table below shows the price move in the FTSE 100 over the last 29 years. It looks at the performance for the months preceding December as well as for December itself in each year. Just like the table above, negative returns are highlighted in red.
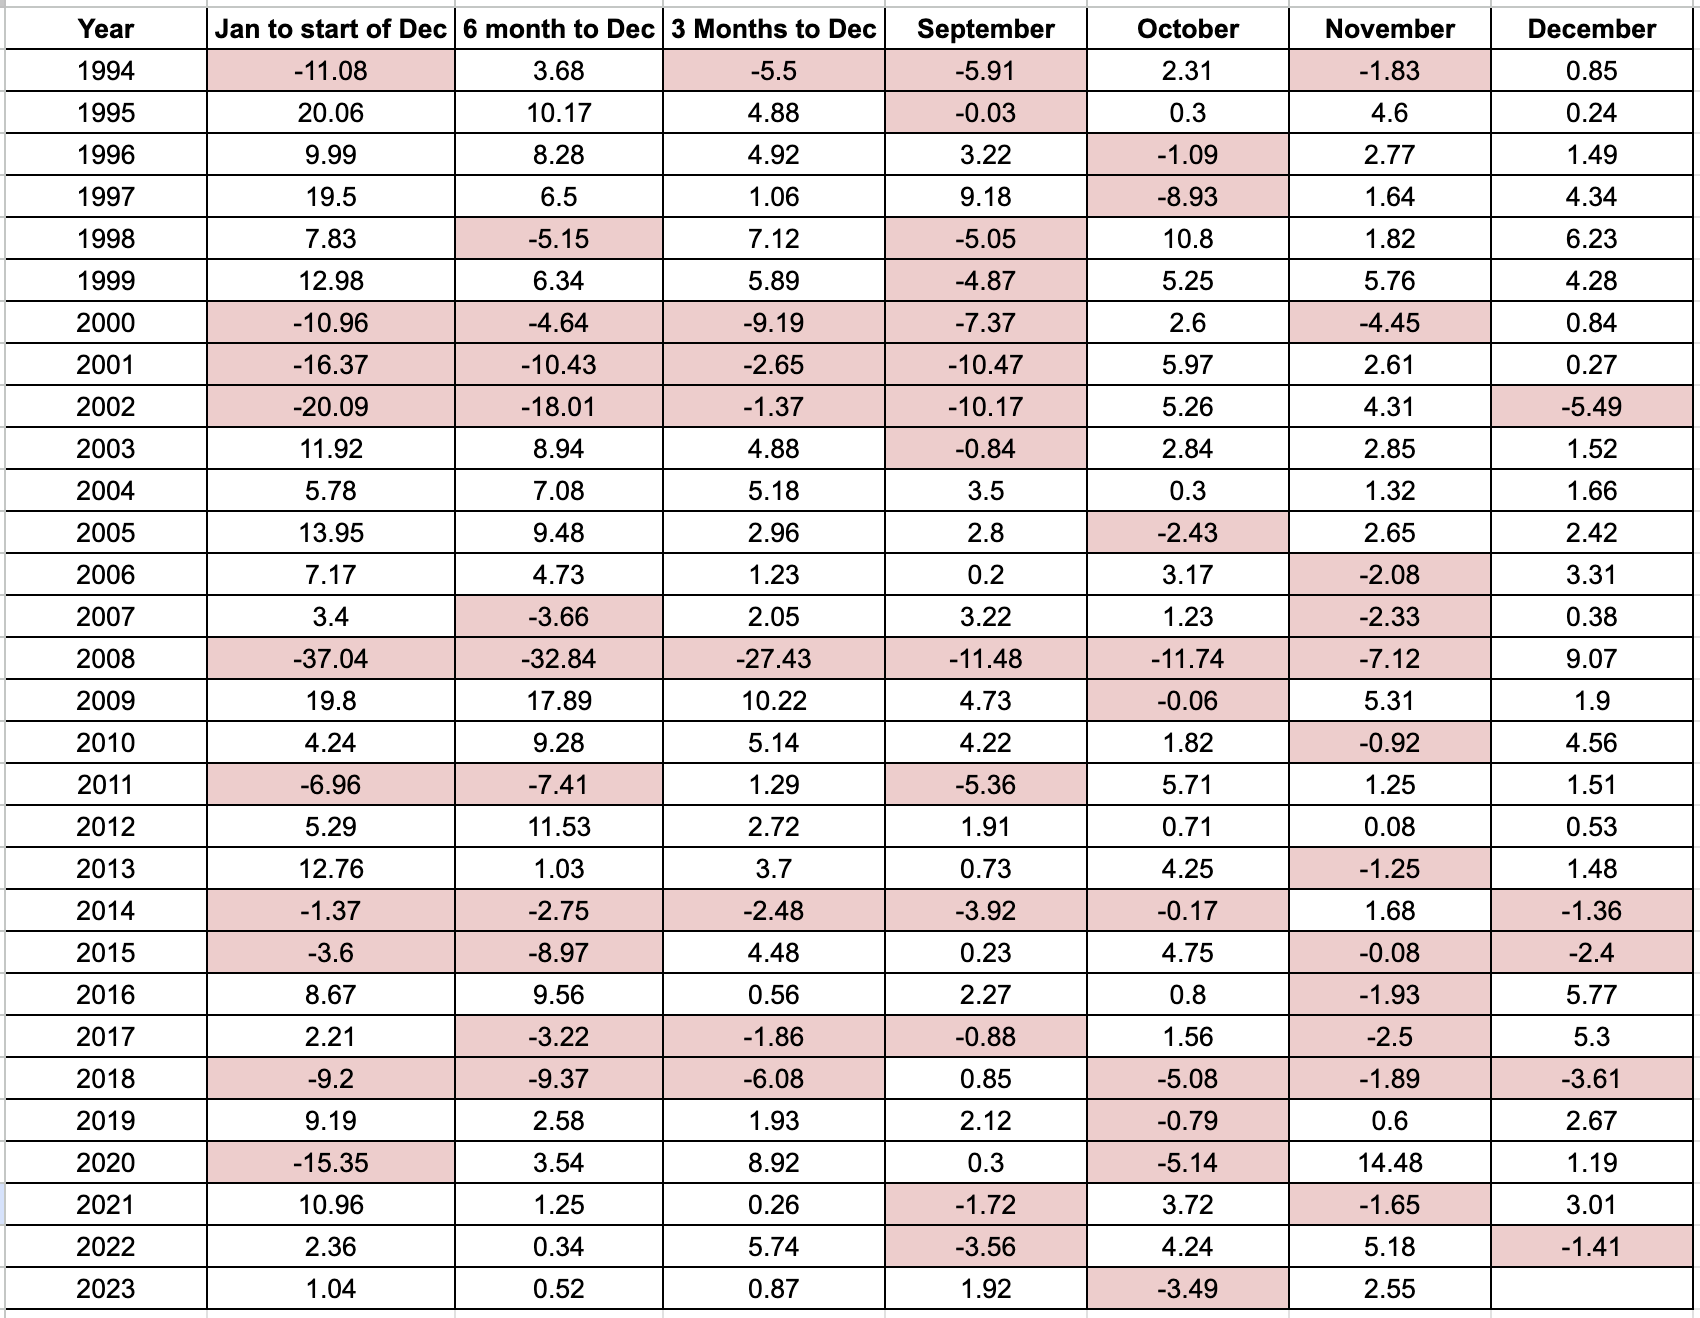
The evidence suggests that the Santa rally is in fact more prevalent in UK equities, with December being positive in 24 years out of the last 29. That is a hit rate of almost 83%, which is still astonishingly high. Not only that, but during 2018 and 2022 when both the S&P 500 and the Nasdaq 100 suffered heavy losses of up to 9.18%, the FTSE 100 only fell by -3.61% in 2018 and -1.41% 2022. It means that on average the FTSE 100 has rallied 1.79% in December, over the last 29 years, almost twice that of the S&P 500 and three times that of the NASDAQ 100.
The table below highlights the changing trend in the Sata rally over time in the UK, with the numbers in brackets representing the equivalent data from my last update in 2020.
| Time period | FTSE 100 average Dec return | Frequency of Santa rally |
| Since 1994 | 1.74% (1.84%) | 83% (85%) |
| Last 20 years | 1.88% (1.52%) | 80% (80%) |
| Last 10 years | 1.06% (1.45%) | 60% (70%) |
| Last 5 years | 0.37% (1.55%) | 60% (60%) |
Just like the US stock markets the odds of a Santa rally have been falling over time as has the size of any rally. But interestingly, the average December return remains positive over each of the stated time periods.
Santa or bust?
While the evidence suggests that the Santa rally effect is waning, in the last five years there are also signs of a 'Santa or Bust' pattern forming in the US. Or in other words, when there is a Santa rally it is usually strong, but when it is absent the market slump is more extreme than the historical average (see table below). Of course, it is a very small sample set (of just the last five years) but it's worth watching going into the future.
Once again though the FTSE 100 (UK equities) demonstrates its stronger Santa rally credentials. The performance versus history (see below) has remained fairly consistent, however, the December losses have in fact improved in the last five years.
| FTSE 100 | S&P 500 | NASDAQ 100 | |
| Average % December return during an UP year (over the last 5 years) | 2.29% | 3.68% | 3.40% |
| Average % December return during an UP year (1994-2017) | 2.76% | 2.50% | 5.90% |
| Average % December return during a DOWN year (over the last 5 years) | -2.51% | -7.50% | -9.03% |
| Average % December return during a DOWN year (1994-2017) | -3.08% | -2.26% | -3.32% |
Why December 2024 could be more exciting
In the first two charts in this article, you may have noticed that certain years were highlighted yellow. These represent US election years. If you look closely you can see that they appear to be good years for a Santa rally. Now that we have 2020's data to add into the mix, the table below shows the performance of the S&P 500 and the FTSE 100 during December in US election years going back to 1972, which is the furthest I could go back on the S&P 500.
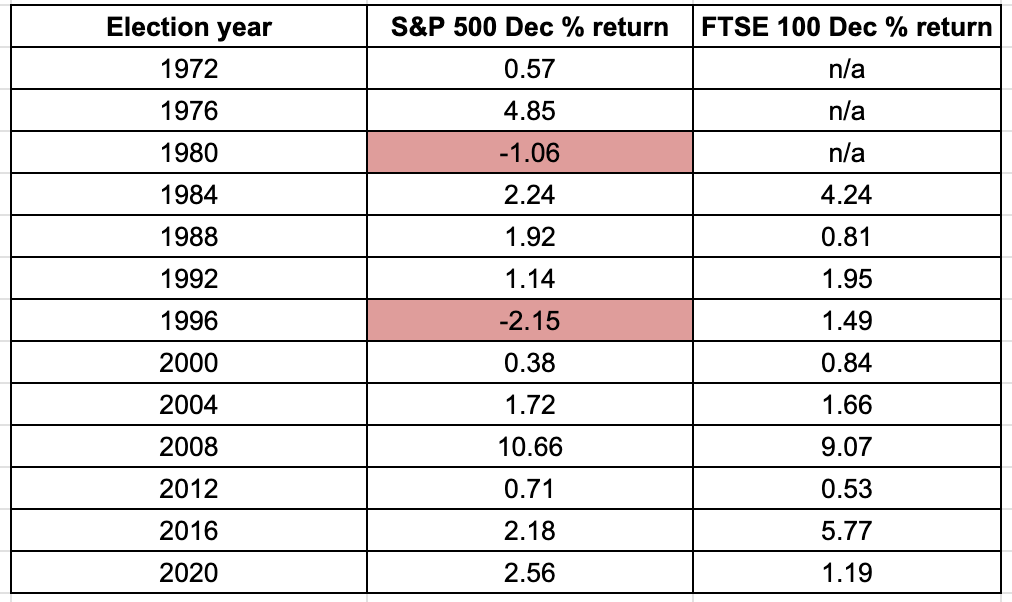
You can see that on 11 out 13 occasions (85% of the time) when there was an election we saw a Santa rally. More impressively since the FTSE 100 was launched in 1984 we have seen a Santa rally in every US election year since! That means next Christmas (in 2024) could be a particularly exciting year for the Santa rally phenomenon given that it is a US election year.

£200 Pension Cashback Offer
Make a qualifying deposit or transfer a pension to our partner Interactive Investor.
- Deposit or transfer a pension of at least £20k and you could earn £200 cashback
- Terms and Fees apply, Capital at risk
- New & Existing customers opening a SIPP
- Offer ends 31st July 2026
Before starting your transfer, check you won't lose any valuable benefits (such as guaranteed annuity rates or a lower protected pension age) and find out what exit fees you might have to pay
